

Abstract
A new, region-based mathematical model of the urine concentrating mechanism of the rat renal medulla was used to investigate the significance of transport and structural properties revealed in anatomic studies. The model simulates preferential interactions among tubules and vessels by representing concentric regions that are centered on a vascular bundle in the outer medulla (OM) and on a collecting duct cluster in the inner medulla (IM). Particularly noteworthy features of this model include highly urea-permeable and water-impermeable segments of the long descending limbs and highly urea-permeable ascending thin limbs. Indeed, this is the first detailed mathematical model of the rat urine concentrating mechanism that represents high long-loop urea permeabilities and that produces a substantial axial osmolality gradient in the IM. That axial osmolality gradient is attributable to the increasing urea concentration gradient. The model equations, which are based on conservation of solutes and water and on standard expressions for transmural transport, were solved to steady state. Model simulations predict that the interstitial NaCl and urea concentrations in adjoining regions differ substantially in the OM but not in the IM. In the OM, active NaCl transport from thick ascending limbs, at rates inferred from the physiological literature, resulted in a concentrating effect such that the intratubular fluid osmolality of the collecting duct increases ∼2.5 times along the OM. As a result of the separation of urea from NaCl and the subsequent mixing of that urea and NaCl in the interstitium and vasculature of the IM, collecting duct fluid osmolality further increases by a factor of ∼1.55 along the IM.
Keywords: countercurrent system, NaCl transport, urea transport, kidney
during periods of water deprivation, the mammalian urine concentrating mechanism, which is localized in the renal medulla, stabilizes the osmolality of blood plasma by producing a urine that has an osmolality that substantially exceeds that of blood plasma. However, despite decades of sustained experimental and theoretical investigation (24, 37, 54, 58), the nature of the urine concentrating mechanism in the inner medulla (IM) of the mammalian kidney remains controversial.
Anatomic studies have revealed a highly structured organization of tubules and vasa recta in the outer medulla (OM) of some mammalian kidneys (2, 29), with tubules and vessels organized concentrically around vascular bundles, tightly packed clusters of parallel vessels, and tubules containing mostly vasa recta. Recent studies of the three-dimensional architecture of the rat IM and expression of membrane proteins associated with fluid and solute transport in nephrons and vasculature have revealed transport and structural properties that likely impact the IM urine concentrating mechanism in the rat kidney. These studies have shown that the IM portion of the descending limbs have at least two or three functionally distinct subsegments and that clusters of collecting ducts (CDs) form the organizing motif through the first 3–3.5 mm of the IM (50–52).
Based on the findings on the IM three-dimensional architecture, we previously developed a detailed model of the urine concentrating mechanism in the rat IM (39). That model represents a “solute-separation, solute-mixing” mechanism, which may be regarded as a refinement of the “passive” mechanism proposed by Kokko and Rector (26) and by Stephenson (60). The fundamental principle of the passive mechanism is that sustained diffusive absorption of NaCl from the loops of Henle can be promoted by a favorable concentration gradient that is sustained by diffusive absorption of urea from CDs. The absorption of NaCl from loops, with little or no accompanying water absorption from loops, concentrates other medullary structures, and dilute ascending thin limb tubular fluid provides for a solute and water mass balance configuration that promotes the generation of an axial medullary gradient.
Like the passive mechanism, the model in Ref. 39 assumes that the urea permeability along most of the IM portion of the descending limbs is nearly zero. However, that assumption appears to be inconsistent with measurements in isolated perfused thin limbs, which revealed significant urea permeabilities in some segments of thin limbs in a number of species (5, 14, 44). Indeed, preliminary data suggest that urea permeabilities in defined regions of rat IM thin limbs may be higher than previously thought (Dantzler DL and Pannabecker TH, personal communication). When the thin limbs of Henle in the model in Ref. 39 were assumed to have significant urea permeabilities, with the transport properties of other structures kept unchanged, a substantial axial osmolality gradient (i.e., an osmolality gradient distributed along the corticomedullary axis) could not be generated (unpublished observations).
The goal of this study is to describe and evaluate, by means of mathematical modeling, an alternative concentrating mode for the IM based on the assumption of high thin-limb urea permeabilities. We use a “region-based” model that represents the preferential interactions among the tubules and vessels, which arise from the three-dimensional architecture of the rat renal medulla. The model is based on the detailed model of the urine concentrating mechanism of the rat OM (35) and on the analogous model for the rat IM (39) that we previously developed. The model is used to assess implications of the functional anatomy of the renal medulla and to evaluate hypotheses, previously set forth by us (54), that are suggested by the functional anatomy. Among these hypotheses are 1) the absence of aquaporin-1 (AQP1) in some segments of descending thin limbs promotes concentrating function by eliminating the need to concentrate all fluid at each medullary level; 2) the radial configuration in the OM contributes to the sequestration of urea in vascular bundles and promotes a preferential increase in the CD tubular fluid; 3) the organizing motif of tubules and vessels within and around CD clusters in the upper IM results in differing interstitial fluid composition within, and external to, the CD clusters; these differing concentrations are made possible by the nodal microdomains within the CD clusters; 4) in the innermost IM, loop bends that run transversely along CDs in the innermost IM enhance preferential solute mixing of NaCl and urea; and 5) the IM concentrating mechanism is composed of three distinct countercurrent systems, each with specialized properties and functions.
The findings of this modeling study give general support to most, but not all, aspects of these hypotheses.
MATHEMATICAL MODEL
Our mathematical model is based on the “region-based” models of the OM (34, 35) and of the IM (39). Tubules and vasa recta are represented by rigid tubes that extend from the corticomedullary boundary (x = 0) to the papillary tip (x = L). The model represents loops of Henle that turn at all levels of the IM, vasa recta that terminate or originate at all levels of the medulla, and a composite CD. For simplicity and compatibility with our previous OM model (35), loops that reach into the IM are assumed to have the same fluid flow rate and composition at each the OM level; the same assumption was also applied to long vasa recta.
The model is formulated for three solutes: NaCl, urea, and a nonreabsorbable solute; NaCl is represented by Na+. The nonreabsorbable solute, denoted “NR,” is assumed to be present only in significant amounts in the tubular fluid of the CD and is represented only in the CD tubular fluid. The osmotic coefficients for NaCl, urea, and NR are taken to be 1.84, 0.97, and 1.84, respectively. The model predicts fluid flow, solute concentrations, transepithelial water and solute fluxes, and fluid osmolality, as a function of medullary depth, in the tubules, vasa recta, and interstitium of the model medulla.
In the OM, the radial organization with respect to a vascular bundle (27, 31) is represented by means of four concentric regions (35). In the IM, two concentric regions are employed (39). The portion of each concentric region that is exterior to both tubules and vasa recta represents merged capillaries, interstitial cells, and interstitial space. At a given medullary level, each concentric region is assumed to be a well-mixed compartment with which tubules and vasa recta interact. To specify the relative positions or distributions of the tubules and vasa recta and to simulate the potential preferential interactions among them, each tubule or vas rectum is assigned to a particular concentric region, or, in some cases, fractions of a tubule or vas rectum are distributed to two concentric regions. Tubules and vasa recta that are in contact with different concentric regions are influenced by differing interstitial environments. However, tubules or vasa recta that do not contact the same region may still interact via interstitial diffusion of solutes around tubules and vasa recta; these diffusive fluxes are simulated by assigning non-zero solute permeabilities to the boundaries that separate concentric regions.
Model positions of tubules and vasa recta in the OM, based on descriptions in Refs. 17, 27, 31, and 41, are shown in Fig. 1, left, for the outer stripe and inner stripes. Distinct populations of ascending vasa recta (AVR) were used to avoid having AVR straddle regional boundaries; otherwise, unrealistic mixing between regions would be introduced, owing to the high effective solute permeabilities assumed for AVR. Vasa recta that supply the IM, i.e., long descending vasa recta (DVR) and AVR (labeled LDV, LAV1, and LAV2 in Fig. 1) are assumed to form the vascular bundle, which is contained within the two centermost regions (R1 and R2). Long and short DVR are assumed to reside in R1 and R2, respectively, consistent with immunolabeling results, which indicate that DVR are distributed centrally within the vascular bundle, but also consistent with short DVR peeling off to supply the capillary plexus of the inner stripe. CDs, which are located distant from the vascular bundle, are assigned to R4, the outermost region. Distinct populations of short AVR (labeled SAV3 and SAV4 in Fig. 1) ascend through R3 and R4, respectively. Thick ascending limbs (TALs) from short loops of Henle (i.e., SALs), which are near the CD throughout the OM, are assumed to straddle R3 and R4. At the beginning of the outer stripe, the long loops of Henle are situated near the vascular bundle, in R2 and R3, where the long ascending limbs (LALs) maintain their position throughout the OM.
Fig. 1.

Schematic diagram of a cross section through the outer stripe, inner stripe, upper inner medulla (IM), mid-IM, and deep IM, showing concentric regions and relative positions of tubules and vessels. Decimal numbers indicate relative interaction weightings with regions. R1, R2, R3, and R4, concentric regions in the OM; R5 and R6, concentric regions in the IM; SDL, descending limbs of short loops of Henle; SAL, ascending limbs of long loops of Henle; LDL, descending limb of long loop of Henle; LAL, ascending limb of long loop of Henle. Subscripts “S,” “M,” and “L” associated with a LDL or LAL denote limbs that turn with the first millimeter of the IM (S), within the mid-IM (M), or reach into the deep IM (L). CD, collecting duct; SDV, short descending vasa recta; SAV3 and SAV4, 2 populations of short ascending vasa recta; LDV, long descending vas rectum; LAV1, LAV2, LAV5, and LAV6: populations of long ascending vasa recta.
In the IM, radial organization with respect to a CD cluster (50–53) is represented by means of two concentric regions: an intracluster region, denoted by “R6,” which represents a CD cluster; and an outer, intercluster region, denoted by “R5.” Recent anatomic studies have shown that, in the upper 3–3.5 mm of the rat IM, clusters of the inner medullary collecting duct (IMCD) provide the organizing motif around which loops of Henle and vessels are arranged (51, 53). Most LALs and some of the AVR are within these CD clusters, whereas other LALs and AVR, along with AQP1-positive LDLs and DVR, are external to the CD clusters. In the final 1.5–2 mm of the IM, however, the CD clusters can no longer be distinguished. Schematic diagrams of cross sections through the model IM are shown in Fig. 1, right.
Parameters
Most morphological and transport parameters of the present model are taken from those in Refs. 35 and 39. Below, we describe selected parameters that are different from previous studies (35, 39), or are of particular importance in the present study.
In the mid-inner stripe, Kriz (27) found the ratio of CDs to loops, which we denote by nCD, to be 1/6.1, and we assume this value throughout the OM. Two-thirds of the loops of Henle are assumed to be short (27). We assume a ratio of short DVR (SDV) to loops of nSDV = 44/71 and ratios of SAV to loops of nSAV3 = 219/71 and nSAV4 = 73/71. Similarly, nLDV = 12/71, nLAV1 = nLAV5 = 17/71 (LAV that lie within the center of the vascular bundle and outside the CD cluster), and nLAV2 = nLAV6 = 33/71 (LAV that lie in the periphery of the vascular bundle and within the CD cluster). The justification for these ratios can be found in Ref. 35.
In the rat IM, the number of loops of Henle decreases as a function of increasing medullary depth (13). As in previous studies (38, 40), this loop configuration is represented by continuously distributed loops that have bends at all IM levels (39). The fraction of loops remaining at the medullary level x is given by
| (1) |
where LOM and LIM are the lengths of the model OM and IM (see below), respectively, a1 = 4.42, a2 = 8.016, a3 = 21.08, a4 = 304.8, and a5 = 0.7782.
The population of CDs also decreases as a function of increasing IM depth, as the CDs undergo successive coalescences. The changes in CD population affect intratubular fluid pressure and luminal area, which in turn affect pressure-driven transepithelial water fluxes and intratubular diffusion. However, our model does not represent hydrostatic pressure or intratubular diffusion. CD population decrease also results in a reduction in tubular area available for transepithelial transport. Thus, as in Ref. 38, we represent the effect of such coalescences on CD tubular area (13) by multiplying the CD radius by the fraction wCD of CDs remaining at a given medullary level x; that fraction was approximated by (38, 39)
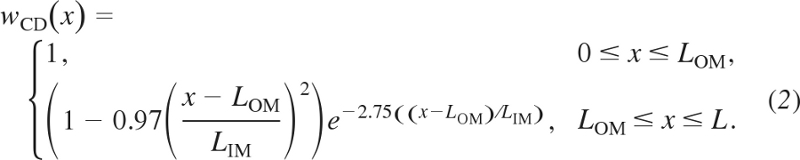 |
As previously noted, the model includes in the OM one SDV and two SAV, which represents vasa recta which terminate or originate in the OM. Their distribution are given by
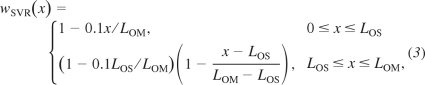 |
where LOS denotes the length of the outer stripe. In addition, the model represents one LDV and two LAV, each of which represents a population of vasa recta that reach to differing levels of the IM. Each of the LDV and LAV population distributions is given by
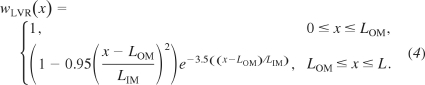 |
Model equations in the present study can be found in Refs. 35 and 39. Some of the model equations embody the principle of mass conservation of solute and water; others represent transmural transport of solutes and water by means of single-barrier equations that provide a summary representation of double-barrier transepithelial or transendothelial transport. Transmural solute diffusion is characterized by solute permeabilities; active transport is represented by a saturable expression that has the form of Michaelis-Menten kinetics. Transport equations for water represent osmotically driven fluxes, except for AVR, where water flux is assumed to be pressure-driven advection through fenestrations.
The axial lengths of the model OM and IM were taken to be 2 and 5 mm, respectively (22); thus L = LOM + LIM = 7 mm. The lengths of the outer and inner stripes are taken to be 0.6 and 1.4 mm, respectively. The diameters and transport properties of tubules and vasa recta are given in Table 1. These parameters were given by, based on, or estimated from, sources cited in Refs. 34, 35, and 39.
Table 1.
Diameters and transport parameters
| Diameter, μm | Pf , μm/s | PNa, 10−5 cm/s | Purea, 10−5 cm/s | Vmax, Na, nmol•cm−2•s−1 | |
|---|---|---|---|---|---|
| SPST | 20 | 3,570 | 10 | 1.5 | 2.1 |
| SDL1 | 21→16 | 3,257 | 1.5 | 7.4 | 0.43 |
| SDL2 | § | 0 | 1.1 | 20 | 0 |
| LPST | 80 | 3,570 | 10 | 1.5 | 2.1 |
| LDL1 | 21→16 | 2,295 | 63 | 0.5 | 0.43 |
| LDL2S | 15→11 | 13 | 0 | 0 | 200 | 0 |
| LDL2 | 15→11 | 13 | 2,200 | 0 | 13 | 0 |
| LDL3 | 0 | 0 | 180 | 0 | |
| SAL* | 21→10 | 0 | 1.1 | 1.4 | 0.9 | 10.5 | 25.9 |
| LALOM | 20 | 0 | 1.1 | 1.4 | 0.6 | 10.5 | 25.9 |
| LALS* | 20→13 | 0 | 80 | 200 | 0 |
| LALL* | 20→13 | 0 | 80 | 190 | 0 |
| LALL* | 20→13 | 0 | 80 | 190 | 0 |
| OMCD | 31→22 | 463† | 1 | 0.3 | 3–5 |
| IMCD | 20→25 | 460→750‡ | 1 | 0.3 to 110† | 8→2‡ |
| DVR | 11 | 1,257 | 76 | 360 | 0 |
| AVR | 28→10 | 10 | 750 | 690 | 0 |
Parameters are given by, based on, estimated from, or suggested by references given in Refs. 34 and 39. P, permeability. SPST and LPST, proximal straight tubules associated with the short (SDL) and long descending limb of Henle (LDL); LAL, long ascending limb. SDL diameter is given at outer-inner stripe boundary and beginning of prebend segment; LDL1 diameter is given at outer-inner stripe and outer medullary (OM)-inner medullary (IM) boundaries; Short ascending limb (SAL), collecting duct (CD), and ascending vasa recta (AVR) diameters are given at corticomedullary and OM-IM boundaries. Arrow (→) indicates that parameter is assumed to vary linearly as x increases; vertical line (|) indicates that parameter is assumed to change abruptly at outer-inner stripe or OM-IM boundary. The Michaelis constant KM, Na, used in conjunction with Vmax, Na in all cases of active Na+ transport, was 70 mM. All tubules and vasa recta were assumed to have no active urea transport, i.e., Vmax, urea = 0.
A prebend segment is assumed to have the same transport parameters as its contiguous ascending limb.
Parameter increases exponentially as medullary depth x increases from 4.5 to 7.0 mm.
SDL2 diameter is included in SDL1 diameter.
See description in text.
In our model, we represent two short loops of Henle, and a distributed long loop of Henle that reaches into the IM. The descending limb of one short loop (SDLa) is structurally and functionally divided into four segments. The first SDL segment, which corresponds to the proximal straight tubule, terminates at the outer-inner stripe boundary (i.e., at x = 0.3LOM). The second descending limb segment, which we call “SDL1,” is highly water permeable and moderately permeable to solutes, characteristics typically ascribed to SDL (57). The SDL1 segment extends into the inner stripe and terminates at x = 0.7LOM. The third segment, which we call “SDL2,” is a water-impermeable, but urea-permeable, portion of the SDL located in the inner stripe; its transport properties are inferred from immunohistochemical localization studies (48, 65). The SDL2 segment spans ∼40% of the inner stripe. The fourth segment, which we call the “prebend segment,” is a terminal portion of the descending limb that is given the diameter and transport properties of the TAL. The prebend segment begins at x = 0.975LOM. The descending limb of the other short loop (SDLb) is assumed to have no prebend segment and is structurally and functionally divided into three segments.
Both the outer stripe segment of the model LDL, which corresponds to the pars recta, and the inner stripe segment, which we call “LDL1,” are highly water permeable. The average luminal areas of proximal straight tubules from juxtamedullary nephrons, those likely to give rise to long loops, take into account the large, flattened cross-sectional shapes of the tubules, which arise from their tortuosity (29, 31).
The IM portion of a model LDL of a loop of Henle that reaches beyond the first millimeter of the model IM was divided structurally and functionally into three segments. The first segment, which we call “LDL2” and which spans the initial 40% of the IM portion of the LDL, was assumed to be highly water permeable, NaCl impermeable, and moderately urea permeable. The second IM segment, which we call “LDL3,” corresponds to the AQP1-null segment of the LDL (50). The LDL3 segment was assumed to be impermeable to NaCl (15, 45) and to water (6). Contrary to the assumption made in the passive mechanism, the LDL3 segment was assumed to be highly urea permeable, as suggested by the significant urea permeabilities revealed in isolated perfused thin limb experiments in a number of species (5, 14, 44) and by preliminary measurements by Dantzler, Evans, and Pannabecker in defined regions of rat IM thin limbs. The third segment corresponds to the prebend segment, which was assigned the transport properties of the contiguous LAL segment. In a loop that turns within the first 3.5 mm of the model IM, the prebend segment has a length of 166.7 μm (50). The prebends of some of the longer loops of Henle change drastically in the terminal 500 μm of the IM. About half of the loops that reach into that level have very broad transverse prebend segments which tend to lie alongside, and to be curved laterally around, the terminal portions of CDs (53). The effect of laterally running prebends on LDL and LAL tubular areas is represented by increasing the radii of both the LDL and LAL near the loop bend (39).
The IM portion of the LDL of a loop of Henle that turns within the first millimeter of the model IM was reported to express no AQP1 (50) and thus was assumed to be water impermeable. The IM portion of those loops is divided functionally and structurally into two segments. The first segment, which is denoted by “LDL2S” (“S” for “short”) and assumed to be impermeable to NaCl, extends to the second segment, the prebend segment, which was assumed to have a length of 166.7 μm and to be functionally like its contiguous LAL, which is denoted by “LALS.”
All model LALs were assumed to be water impermeable throughout the medulla; they were assumed to be NaCl impermeable in the OM, but highly NaCl permeable in the IM (14). NaCl was assumed to be actively absorbed from the TALs, with the maximum active Na+ transport rate higher in the inner stripe than in the outer stripe (25.9 vs. 10.5 nmol·cm−2·s−1), in accordance with experiments by Garg et al. (9). Beyond the OM-IM boundary, the LAL active Na+ transport rate was assumed to decrease exponentially quickly:
| (5) |
where Vmax, TAL, Na0 denotes the inner stripe TAL Vmax, TAL, Na. The Vmax, LAL, Na(x) decreases sufficiently quickly that beyond the first millimeter of the IM, the thin ascending limbs have practically zero active NaCl absorption. The LAL was assumed to have a low urea permeability in the OM, but highly urea permeable in the IM, consistent with urea permeability in chinchilla (5). The IM portion of the LAL of a loop that turns within the second and third millimeters of the model IM is denoted “LALM”; the IM portion of the LAL of a loop that reaches into the final 2 mm of the model is denoted “LALL.” The LALL was assumed to occupy a position external to the CD cluster in the upper IM.
The CD urea permeability was assumed to be 0.3 (in units of 10−5 cm/s) for the OM and for the first one-fifth of the model IM [i.e., for x ∈ (0, xCD) where xCD = LOM + 0.2LIM]; for the remainder of the IM [x ∈ (xCD, L)], CD urea permeability was assumed to increase exponentially, according to the formula
| (6) |
where P0 and P1 are the initial and terminal CD urea permeabilities, 0.3 × 10⁻⁵ and 110 × 10−5 cm/s, respectively. This profile was constructed to be consistent with experiments in antidiuretic rats showing high urea permeabilities in the terminal CD (19, 59) and to ensure sufficient urea delivery to the deep IM to support the hypothesized mode of concentration.
The CD Na+ maximum transport rate Vmax, Na (in units of nmol·cm−2·s−1) was assumed to be 3 and 5 in the outer and inner stripes, respectively, to be 8 for the initial three-tenths of the model IM, to decrease linearly to 2 for the next two-tenths of the IM, and remains constant at 2 for the remainder of the IM. The profile for Vmax, Na was chosen to ensure that substantial urea was absorbed from the terminal CD (by means of maintaining a sufficient transepithelial urea gradient) and that the solute load reaching the terminal CD was consistent with experimental evidence for moderately antidiuretic rats (see below).
In the OM, the interregion solute permeabilities were estimated as describe in Ref. 35. That same approach was used to estimate interregion permeabilities in the initial IM (LOM ≤ x ≤ LOM + 0.2LIM), where the CD clusters are well defined. In the mid-IM (LOM + 0.2LIM ≤ x ≤ LOM + 0.7LIM), where structural organization gradually diminishes (53), the inter-region solute permeabilities were assumed to increase exponentially. In the remainder of the IM (LOM + 0.7LIM ≤ x ≤ L), where CD clusters can no longer be clearly distinguished, inter-region permeabilities were set to 100 × 10−5 cm/s.
In the IM, the interstitial cells connect loops of Henle and vasa recta, spanning these axial structures like “rungs of ladder” (42), which likely impede solute diffusion along the corticomedullary axis. A previous sensitivity study (36) suggests that the predictions of the region-based OM model are nearly insensitive to variations in axial diffusivity within physiological ranges. Based on these considerations, axial solute diffusion is taken to be zero in the present model.
Boundary Conditions
The boundary concentrations and water flows for descending limbs and DVR at the corticomedullary boundary (x = 0) are given in Table 2. Boundary conditions for CD inflow were based on four assumptions. First, the CD water inflow rate at the corticomedullary boundary was prescribed at 6.5 nl·min−1·CD−1. Second, the osmolality of CD fluid at the corticomedullary boundary is equal to blood plasma osmolality, and NR concentration is set to 7 mM. Third, 20% of the urea that is delivered to the early distal tubule by the cortical TAL is absorbed in the cortex. Fourth, the water flow rate to the early distal tubule equals the water flow rate in the corresponding TAL at the corticomedullary boundary. Fifth, no urea is absorbed from the cortical CD, which has been reported to have a low urea permeability (21). These assumptions suffice to determine the CD inflow Na+ and urea concentrations (34, 35).
Table 2.
Boundary conditions at corticomedullary boundary
| Tubule or Vessel | CNa+, mM | Curea, mM | CNR, mM | FV,* nl/min | FV,† nl/min |
|---|---|---|---|---|---|
| SDL | 160 | 15 | 0 | 10 | 6.667 |
| LDL | 160 | 15 | 0 | 12 | 4 |
| DVR | 163.7 | 8 | 0 | 8 | 5.954 |
| CD | 61.54‡ | 188.5‡ | 7 | 6.5 | 1.07 |
See text for justification of boundary conditions. Table entries that are not exact are given to 4 significant places. Flow rates FV are given for 2 scalings: per individual tubule or vessel (*) and per nephron (†).
The CD inflow concentrations are based on model assumptions.
Recall that because the long loops of Henle turn at all levels of the IM, the IM portion of the LDL was represented using the distributed-loop formulation, which assumes that the intratubular concentration profiles and fluid flow rates of the long loops may differ at differing IM levels. In the distributed-loop formulation, as many model loops are represented as there are numerical grid points. In contrast, the OM portion of the LDL was represented using a single tubule, with the concentrations and flow rates assumed to be the same at each OM level. Based on the evidence that juxtamedullary glomeruli have higher single-nephron glomerular filtration rates than the glomeruli that give rise to short-looped nephrons (8), we did not assume simple continuity and set the water flow rates in all LDLs to be equal at the OM-IM boundary; rather, we assumed that water flows in LDLs that turn within the first millimeter of the IM are slower than LDL of longer loops. Let FV, LDL, OM(x) and Ck, LDL, OM(x) denote the water flow rate and solute k concentration, respectively, of the OM portion of the LDL at OM level x; and FV, LDL, IM(x, y) and Ck, LDL, IM(x, y) denote the water flow rate and solute k concentration, respectively, of the IM portion of the LDL that reach into IM level y. Analogous notations are used for the LAL. With these notations, we assumed that, at the OM-IM boundary, the intratubular concentrations and flow rate of the fluid entering the IM LDL are given by
| (7) |
| (8) |
Thus all LDLs were assumed to have the same concentration at the OM-IM boundary. As previously noted, longer loops were assumed to have higher water flow rates, so FV, LDL, S < FV, LDL, L. To impose conservation of water flow at the OM-IM boundary, FV, LDL, S and FV, LDL, L satisfy the condition
| (9) |
where wl(LOM + 1 mm) is the fraction of long loops that reach beyond the first millimeter below the OM-IM border.
At the OM-IM boundary, the flow rate and solute concentrations of the tubular fluid entering the LAL are given by the weighed average of the ascending thin limbs:
| (10) |
| (11) |
where −wl′(y) is the rate of change of loop population at level y. Technically speaking, the intratubular fluid compositions of the TALs associated with loops of differing lengths are different. That can be represented using the distributed-loop formulation, as is done for the IM portions of the LDL and LAL. However, the distributed-loop formulation requires large computational times (because 1 model loop is assumed to turn at each numerical grid point, so there are as many loops as there are numerical grid points). To reduce computational times, we therefore assume that the intratubular fluid composition of the TALs associated with all long loops is the same (Eq. 11). That assumption also facilitates the incorporation of our previous OM model (35), which represents all LALs as a single tubule. We believe that that assumption can be justified, inasmuch as both Na+ and urea permeabilities of the LAL are low (1.1 and 0.6 × 10⁻⁵ cm/s, respectively), and solute fluxes along the TALs involve mostly active Na+ transport, which is largely insensitive to intratubular fluid composition. The validity of this assumption is assessed in results.
Intratubular concentrations and fluid flow rate of each of the model long vasa recta are assumed to be the same at any given medullary level. In the OM, one LDV and two LAVs are represented by means of single rigid tubules. In the IM, again one LDV and two LAVs are represented. Each of the IM tube represents a population of vasa recta that reach to differing levels of the IM, with a fraction of the DVR flow directed into the interstitium at each IM level. For the LDV, intratubular concentrations and fluid flow rate are assumed to be continuous at the OM-IM boundary; i.e., Ck, LDV, IM(LOM) = Ck, LDV, OM(LOM) and FV, LDV, IM(LOM) = FV, LDV, OM(LOM).
Because the axial paths of the AVR are not well characterized, we assume that, at the OM-IM boundary, the intratubular concentrations and fluid flow rates of the OM LAV are equal to the averages of the IM LAV:
| (12) |
| (13) |
RESULTS
The Base Case
The model equations were solved to obtain steady-state solutions for the base-case configuration, parameter set, and boundary conditions. Key results are displayed graphically in Figs. 2, 3, and 4. Figure 2 shows axial osmolality, Na+ concentration, and urea concentration profiles in the concentric regions and in each class of tubule and vessel (and NR concentration in the CD). Figures 3 and 4 show corresponding water, Na+, and urea luminal flow profiles. This figure portrays directed flow; thus, flow toward the cortex is considered to be negative. In Figs. 2, 3, and 4, the designations A, B, and C are used in a roughly analogous way: A designates either osmolality or water, B designates Na+ or NR, and C designates urea. As was described in model formulation, in the IM, the loops of Henle are represented by a continuous distribution, with the loops turning at all IM levels. However, Figs. 2 and 3 contain only the profiles that correspond to representative loops of Henle, specifically, those that turn at x = 3, 4.5, and 7 mm.
Fig. 2.

Osmolalities and concentration profiles of concentric regions, tubules, and vasa recta. The ordinate is identified at the top of each column: column A, osmolality; column B, Na+ or NR concentration; column C, urea concentration. The topmost row, indicated by 0, contains profiles for the interstitia of the regions. Row 1 contains profiles for the vasa recta; row 2, loops of Henle; and row 3, CD. Note variation, among panels, in ordinate scalings.
Fig. 3.

Water and solute flows in regions, tubules, and vasa recta, given per individual tubule or vessel. Notation is analogous to that used in Fig. 2; however, the ordinates, given above each column, are water flow (column A); Na+ flow (column B); and urea flow (column C). Negative flows in ascending limbs and ascending vasa recta are directed toward the cortex; flows in descending structures are directed toward the papillary tip. No axial flow is assumed in the regions.
Fig. 4.

Water and solute flows in IM vasa recta, given per nephron. Notation is analogous to that used in Fig. 3.
The model predicts a urine osmolality of 1,283 mosmol/kgH2O and a urine flow rate of 0.0627 nl·min−1·nephron−1, or 2.42 μl·min−1·kidney−1, assuming 38,000 nephrons/kidney. Assuming an average single-nephron glomerular filtration rate of 33 nl/min (8), the base-case urine flow corresponds to a U/P inulin ratio of 526. Model urine Na+, urea, and NR concentrations are 266, 593, and 119 mM, respectively (see Table 3, column labeled “Base case”). These concentrations are in general agreement with experimental measurements in rats by Pennell et al. (55) and by Hai and Thomas (12). One notable discrepancy is the loop-bend urea concentration, predicted to be 592 mM by our model, whereas micropuncture experiments by Pennel et al. (55) reported a substantially lower value of 287 mM. This discrepancy is examined in the discussion.
Table 3.
Comparison of base-case predictions with measurements in rats
| Base Case | Rat | |
|---|---|---|
| Urine | ||
| Osmolality, mosmol/kgH2O | 1,283 | 1,216 |
| Na+ concentration, mM | 266 | 100 |
| Urea concentration, mM | 593 | 345 |
| NR concentration, mM | 119 | 379 |
| Flow, nl/min | 0.0627 | 0.0597 |
| U/P inulin | 526 | 553 |
| Loop bend | ||
| Osmolality, mosmol/kgH2O | 1,298 | 1,264 |
| Na+ concentration, mM | 393 | 475 |
| Urea concentration, mM | 592 | 287 |
| Flow, nl/min | 5.48 | 6.83 |
| TF/P inulin | 6.02 | 4.83 |
| Interstitium at papillary tip | ||
| Osmolality, mosmol/kgH2O | 1,284 | |
| Na+ concentration, mM | 386 | |
| Urea concentration, mM | 593 |
Urine flow (nl/min per nephron) is based on 38,000 nephrons. Model loop-bend value are given for the longest loop of Henle. Rat data are mean values or estimated mean values from Ref. 55.
OM
A general osmolality gradient was generated in the OM along the corticomedullary axis by means of active Na+ transport by the TALs. The Na+ concentrations of tubular fluid in the prebend segment of the short loop of Henle and in the TALs were progressively reduced along the luminal flow direction by active Na+ transport. At the beginning of the prebend segment associated with the SDL, the Na+ concentration was predicted to be 221 mM; at the OM-IM boundary, the Na+ concentration of the LAL was predicted to be 324 mM. The Na+ absorbed from the prebends and TALs progressively reduced the Na+ concentration of the SAL and LAL fluid to be 115 and 125 mM, respectively, at the corticomedullary boundary. The Na+ reabsorbed raised the interstitial osmolality. For example, at the corticomedullary boundary, the osmolality of the interstitial fluid in R3 and R4, where the TALs are located, were predicted to be 336 and 329 mosmol/kgH2O, exceeding the luminal fluid of CDs, descending limbs, and DVR at 309 mosmol/kgH2O.
Owing to the higher interstitial osmolality, water was continuously withdrawn from the tubular fluid of the water-permeable tubules and vessels, namely, the CD, LDL, DVR, proximal straight tubules, and the SDL1 segment. Indeed, along the proximal straight tubules of both long and short loops, osmolality increases were in large part attributable to water absorption from the proximal straight tubules. However, in the lower inner stripe, where the water-impermeable SDL2 segment prevented transepithelial osmotic equilibration, the SDL luminal fluid osmolality was nearly constant, owing to little net absorption of Na+ and urea from this segment. Results from a previous modeling study (36) suggest that the SDL2 segment augments the concentrating effect of the OM by reducing the load that would have been presented by the SDL fluid to the OM concentrating mechanism if the SDL were significantly water permeable throughout. (We will use the word “load” to mean a descending tubular or vascular fluid flow that must be concentrated by the concentrating mechanism.) Unlike the SDL, the LDL is highly water permeable throughout the OM. As the LDLs traversed the inner stripe, they lost a significant fraction of water, but gained significant NaCl by diffusion.
Figure 2, A0 and B0, shows that at each medullary level, the Na+ concentration and osmolality in the concentric regions are highest in R3 (outer stripe) or R4 (inner stripe) and lowest in R1. The osmolality is higher away from the vascular bundle (i.e., higher in R3 or R4 than in R1 and R2) because the majority of inner stripe TALs (all SALs and 50% of the LALs) are assumed to be situated away from the vascular bundle. Thus most Na+ transported from TALs was directed into R3 and R4. Although the majority of TALs are in R3, the osmolality in R3 is lower than in R4 in the inner stripe. This paradoxical result arises because in the inner stripe, LDL fluid flow in R3 presents a higher load to the single effect than does fluid in R4, which principally contains the CD.
The urea profiles in Fig. 2C0 show a contrasting pattern in which the urea concentrations in R1 and R2 ultimately exceed the urea concentration in R3 and R4. These higher urea concentrations in R1 and R2, which are permitted by the isolation of the vascular bundle, arise from elevated urea concentrations entering in LAV from the IM, and from the transfer of much of that urea to the LDV, as is clear from Fig. 2, C1 and C2, and Fig. 3, C1 and C2.
IM
The model predicts that the “solute-separation, solute-mixing” mechanism can generate a substantial urea gradient along the IM water-permeable tubules and vasa recta. The loops of Henle that turn within the first millimeter of the IM were assumed to be entirely water impermeable. Nonetheless, the osmolality in the LDL2S segments of those loops increased due to diffusive urea entry. Similarly, urea entered the LDL2 and LDL3 segments of longer loops, raising their tubular fluid osmolality. Beginning at the transition to the prebend segment, osmolality decreased abruptly in all loops, driven by the vigorous absorption of Na+, which is a consequence of the abrupt increase in Na+ permeability and a transepithelial gradient that favors Na+ absorption. That gradient arises because urea absorbed from the papillary CD results in a high interstitial urea concentration relative to interstitial Na+ concentration. As a result, the interstitial Na+ concentration is below that of the loop Na+ concentration, and a substantial transepithelial outwardly directed Na+ concentration gradient is maintained around the loop bend and along the IM part of the LAL.
Owing to the high LDL3 urea permeability, much urea entered that segment and its urea concentration approximately equilibrated with the interstitium. Along the upper part of the IM, the LALs exited the CD cluster. Because the interstitial urea concentration of the intercluster region (R5) is low relative to the LAL intratubular fluid, urea was reabsorbed from the upper part of the LAL, and its fluid osmolality continued to decrease along its flow direction. Although the addition of urea to loops is ultimately dissipative, urea entry into LDLs nonetheless resulted in the advection of fluid that is hyperosmotic, relative to fluid in other structures, toward the papillary tip. This effect is made possible by the water-impermeable segments of the LDLs, which permit a decoupling of loop tubular fluid osmolality from interstitial osmolality. And although the LAL intratubular fluid urea concentration was elevated relative to the associated LDL, the LAL Na+ concentration was sufficiently low that the LALs carried out of the IM a fluid that was dilute relative to the fluid in the corresponding descending limb flows, thereby producing a concentrating effect.
Sufficiently far away from the OM-IM boundary (≥0.25 mm), the interstitial fluid in R6 is more concentrated than CD tubular fluid, because of Na+ reabsorption from the prebends of the Henle's loops and from the CD. Water reabsorption from CD followed, but because the initial IMCD was assumed to be only moderately water permeable, CD fluid osmolality lagged that of the surrounding interstitium. In contrast, near the OM-IM boundary, interstitial fluid in R5 is more concentrated than DVR (706 vs. 591 mosmol/kgH2O), but slightly dilute relative to LDL (755 mosmol/kgH2O). As previously noted, throughout the OM, DVR fluid is dilute relative to other structures because of its isolation within the vascular bundles. Thus, in the upper IM, water reabsorbed from the DVR has a diluting effect on the local interstitial fluid. The largest difference between the fluid osmolalities in the two regions occurs at the OM-IM boundary, where R6 fluid osmolality is ∼77.1 mosmol/kgH2O higher than R5; most of that difference is attributable to the difference in Na+ concentration, which is ∼47.8 mM higher in R6 than in R5. Compared with the OM, the difference in interstitial fluid composition between the two IM regions is small. In the OM, the active Na+ transport along TALs raises the interstitial Na+ concentration of R3 and R4, reaching a maximum R4-R1 difference of 140.0 mM at the mid-OM. In the IM, however, the thin ascending limbs lack sufficient active transport. Active Na+ transport along the IMCD alone cannot produce a significant concentrating effect because the IMCD is water permeable. Also, the relative difference in IM region urea concentrations was small, compared with the relative differences in OM region urea concentrations (see Fig. 2C0). That is because in the upper IM, CD urea permeability was assumed to be low (3 × 10⁻⁶ cm/s), which limits urea reabsorption in the intracluster region. Also, ascending thin limbs were assumed to occupy an intercluster position in the upper IM, and the urea absorbed from these highly urea-permeable limbs raises the urea concentration in the intercluster region. In the deep IM, CD urea permeability became large, which elevated the interstitial urea concentration of both regions because the CD clusters have been found to disappear in the deep IM.
Because of sufficiently high DVR water and solute permeabilities, and because of the fenestrated nature of the AVR walls, vas rectum osmolality tends to track the osmolality and solute concentrations of the local interstitium. This tracking allows LDV and LAV6 to serve the traditionally ascribed roles as countercurrent exchangers: at each level of the IM, DVR flow tends to have an osmolality or a solute concentration that is slightly below that of the surrounding region (except near the OM-IM boundary, where the R5 fluid osmolality decreases); LAV6 flow tends to have an osmolality or solute concentration that is slightly above that of the surrounding region. Thus, taken as a whole, the transport properties and the countercurrent anatomic arrangement of the vasa recta allow them to return the solute and water that is absorbed from the tubules back to the general circulation while at the same time minimizing the washout effect of vascular flow on local medullary osmolality and concentrations, and, more generally, on the axial IM osmolality and concentration gradients.
Fluid flow rates, given in units of nanoliters per minute per individual tubules or vessel, are shown in Fig. 3A for the CD, vasa recta, and selected loops of Henle. Along the IM, 82.4% of the tubular fluid in the CD was reabsorbed (compared with 66.5% along the OM). In the initial IM, most of that water reabsorption was driven by the active transport of Na+ from the CD (water accompanies the Na+ to preserve nearly equal osmolalities on each side of the CD epithelium); in the deep IM, water reabsorption from the CD was driven mostly by the diffusive efflux of urea. Also, because the model assumed that only a small fraction of the vessels reach into the deep IM, water flow along each individual AVR that reaches into the deep IM is substantial. Despite the high fluid flow rates in the AVR, vascular fluid solute concentrations closely track local interstitial solute concentrations.
Solute flow rates per individual tubule or vessel are shown in Fig. 3, B and C, for the CD, vasa recta, and selected loops of Henle. The CD lost 40.5% of its Na+ in the first 1.0 mm of the IM, because, by our modeling assumption, Na+ was vigorously and actively absorbed (at a rate of Vmax, Na of 8 nmol·cm−2·s−1). This active absorption promoted water absorption from the early CD, because the model's low CD urea permeability (3 × 10⁻⁶ cm/s) restricts the participation of urea flux in transepithelial osmotic equilibration. Moreover, the active Na+ absorption and the accompanying water reabsorption raised the relative concentration of urea in CD tubular fluid (see Fig. 2C1), which ultimately promoted vigorous urea absorption from the terminal CD, where urea permeability greatly increased. In the innermost millimeter of the IM, active Na+ transport from the CD is only sufficient to nearly balance diffusive Na+ backleak.
Near the papillary tip, AVR flow rates appear to be substantially smaller than DVR flow rates, although none of the flow rates are zero. However, mass balance is not significantly violated, because the flow rates in Fig. 3 are given per vessel, and the model represents more AVR than DVR (there are 17 LAV5 and 33 LAV6 per 12 LDV). Furthermore, we assume that only a small fraction of the vasa recta reach into the deep IM (see Eq. 4). Thus the vascular flows per nephron are small compared with other tubular flows. Indeed, near the papillary tip, the net differences among DVR and AVR flows, which are expected to be approximately zero, are smaller than numerical errors. It is also noteworthy that LAV6 flows are substantially larger than those of LAV5. Those differences can be attributed to the large influx of water and solutes into LAV6 near the papillary tip, where most of the loops and vasa recta have turned or terminated, whereas a relatively larger fraction of the CD population remains (compare Eqs. 1, 2, and 4). Thus the amount of fluid and solute reabsorbed is much larger in R6, where the model CD and LAV6 are located, than in R5, where LAV5 resides. As a result, LAV6 carries away fluid and solutes at rates that are higher than LAV5.
In the next set of studies, we investigate model sensitivity to some of the fundamental structural assumptions. The impacts of variations in parameters that characterize the three-dimensional architecture of the model medulla are examined in a companion paper (33).
CD Boundary Conditions at the Corticomedullary Border
The model does not include explicit representation of the cortex; rather, the actions of the cortex are represented implicitly by means of boundary conditions imposed at the corticomedullary border. Specifically, we assumed that the flow rates and solute concentrations of the descending limbs and DVR are known a priori, and CD fluid composition is computed from TAL flows at the corticomedullary boundary. In the base case, we assumed that CD intratubular fluid flow rate is 6.5 nl/min at the corticomedullary boundary, or ∼1.1 nl·min−1·nephron−1, a middle ground between measurements in hydropenic rats, which indicate that accessible late distal tubule flow may be as little as 2.3 nl/min (1), and measurements which show that urine flow may be as little as ∼0.065 nl·min−1·nephron−1. To study how variations in CD flow rate affect the model's concentrating capability, we varied the corticomedullary CD boundary flow rate by ±10% and ±20%. CD boundary osmolality was kept at base-case value, and solute concentrations were determined as in the base case.
Profiles for CD intratubular fluid osmolality, fluid flow rate, and urea flow rate are shown in Fig. 5. As CD inflow rate increased from 5.2 (20% below base case) to 7.8 nl/min (20% above base case), the load on both the OM and IM concentrating mechanisms increased: CD fluid osmolality (in units of mosmol/kgH2O) decreased from 841 to 792 at the OM-IM boundary, and urine osmolality decreased from 1,422 to 1,012 which corresponds to a 28.8% decrease. A higher urine flow rate was predicted when CD boundary flow rate was increased, as one might expect, but the increase in urine flow rate, 122% above base case when CD inflow rate was increased by 20%, was several-fold larger than the corresponding increase in CD inflow rate, a result that can be attributed, in part, to the reduction in the concentrating effectiveness of the system.
Fig. 5.

Model sensitivity results in which CD boundary water flow rate was varied by ±10% and ±20%. A: CD tubular fluid osmolality. B: CD water flow rate. C: CD urea flow rate. Results suggest that a higher CD boundary water flow rate imposes a larger load on the concentrating mechanism of the model renal medulla and reduces its concentrating effectiveness.
When the model assumed a lower CD fluid inflow rate at the corticomedullary boundary, one might expect a corresponding decrease in urea inflow rate, which would result in reduced urea availability to the IM and an impaired IM urine concentrating mechanism. In contrast, as shown in Fig. 5C, CD urea flow rate increased as CD fluid inflow rate decreased. That apparent paradox can be understood via a careful study of Fig. 5C. As CD fluid inflow rate was reduced, the load on the IM concentrating mechanism was reduced as previously discussed and the IM concentrating effect was augmented. As a result, more urea was reabsorbed from the IMCD (compare the slope of the IMCD urea flow for the different cases in Fig. 5C); more urea entered the long loops of Henle, and more urea is returned to the cortex via the LALs. Thus, assuming that the same fraction (80%) of the urea delivered to the cortex is returned to the medulla via the OMCD, the urea inflow rate into the OMCD increased.
The high sensitivity of the predicted urine flow rate, and model results in general, to the CD boundary flow rate may be attributable, in part, to IMCD active Na+ transport, which is largely insensitive to CD tubular fluid composition. As a result, when the CD boundary fluid flow rate is lowered, the IMCD active Na+ transport gives rise to water reabsorption from the IMCD that does not vary proportionally to changes in boundary flow rate. Thus IMCD water reabsorption accounts for a substantially larger fraction of CD tubular fluid flow, and a disproportionally low urine flow rate is produced.
To determine CD urea concentration at the corticomedullary boundary, we assumed that a fixed fraction, δDT, of the urea that is delivered to the early distal tubule by the cortical TAL is absorbed in the cortex (an assumption also used in Ref. 67); this fraction was taken to be 0.2 in the base case, based on a typical difference between early and late distal tubule urea flow as measured in hydropenic rats (1). In a set of simulations, we assessed the degree to which the concentrating capability of the model is affected by the fraction urea reabsorption along the cortical TAL. To achieve that, we obtained model results for δDT = 0.1, 0.15, 0.25, and 0.3 (base-case δDT = 0.2).
Profiles for CD intratubular fluid urea concentration, osmolality, and fluid flow rate are shown in Fig. 6. As the distal tubule fractional urea absorption increased from 0.1 to 0.3, CD fluid urea concentration at the corticomedullary boundary decreased from 247 to 147 mM. Because the CD boundary fluid flow rate was assumed fixed at 6.5 nl/min, that corresponds to a 40.5% decrease in urea delivery to the OMCD, and subsequently a 31.4% decrease in CD fluid urea concentration at the OM-IM, from 621 mM at δDT = 0.1 to 426 mM at δDT = 0.3. With less urea available, the concentrating capability of model IM was reduced: a lower IMCD fluid urea concentration, and thus osmolality, reduced water reabsorption from the IMCD, which increased the interstitial Na+ concentration. A lower interstitial urea-to-Na+ concentration ratio reduced the predicted urine osmolality (in mosmol/kgH2O), from 1,502 at δDT = 0.1, to 1,283 at base-case δDT = 0.2, and to 1,106 at δDT = 0.3. It is noteworthy that the concentrating mechanism of the model OM was little affected, with the CD fluid osmolality virtually unchanged at the OM-IM boundary (819 at δDT = 0.1 and 827 at δDT = 0.3).
Fig. 6.

Model sensitivity results in which fractional urea reabsorption from the distal tubules was varied from 0.1 to 0.3 (base-case value, 0.2). Model results indicate that the effectiveness of the IM concentrating mechanism depends on the delivery of sufficient urea to the IM.
In the previous set of simulations, the CD boundary urea flow was varied while fluid flow rate and osmolality were fixed. These assumptions led to substantial variations in the CD boundary Na+ flow (in pmol·min−1·nephron−1), from 32.9 at δDT = 0.1 to 89.0 at δDT = 0.3. To avoid such unrealistic fluctuations in Na+ flow, we conducted another set of simulations, in which CD boundary Na+ flow was kept at base-case value (65.6 pmol·min−1·nephron−1); the CD boundary fluid flow rate and Na+ concentration were computed to yield base-case CD boundary fluid osmolality.
With these assumptions, as fractional urea reabsorption δDT increased from 0.1 to 0.3, CD boundary fluid urea concentration decreased from 201 to 171 mM, and the CD boundary fluid flow rate increased from 5.83 to 7.39 nl/min. Together, the reduction in urea delivery and the increase in osmotic load lowered urine osmoality (in mosmol/kgH2O) from 1,328 at δDT = 0.1 to 1,186 at δDT = 0.3.
DVR Flow Rates at the Corticomedullary Boundary
Because it has been proposed that blood flow along DVR may be regulated by their intrinsic contractile capability (49), we investigated how variation in DVR flow rate affects the model's concentrating capability. The base-case corticomedullary boundary flow rate of 8 nl/min per DVR was varied by ±10% and ±20%; DVR boundary solute concentrations were kept at the base-case values. Decreasing the DVR boundary flow rate by 10 and 20% resulted in 2.48 and 5.08% increases, respectively, in CD fluid osmolality at the OM-IM boundary, relative to base case, and in 5.13 and 11.1% increases, respectively, in urine osmolality relative to base case. On the other hand, increasing the flow rate by 10 and 20% resulted in decreases of 2.81 and 5.40%, respectively, in CD fluid osmolality at the OM-IM boundary, and in 6.00 and 11.0% decreases, respectively, in urine osmolality. Thus these findings yield the intuitive result that decreasing DVR flow decreases the load on the concentrating mechanisms, in both the OM and in the IM, and consequently increases the concentrating effect.
Single-Tube Representation of the LAL
In the OM, the TALs associated with the long loops of Henle were represented using a single tube, even though, technically speaking, the intratubular fluid compositions of the TALs associated with loops of differing lengths may differ. A single-tube representation was used instead of a distributed-loop formulation, as was used for the IM-portion of the LDL and LAL, to reduce computational times. At the OM-IM boundary, the single-tube LAL fluid flow rate and solute composition were set to the corresponding averages of the ascending thin limbs (see Eq. 9).
To test the validity of the single-tube TAL representation, we conducted simulations to assess the effects on model predictions when the LALs are represented using multiple tubes. In one simulation, we used five model LALs in the OM, which represent LALs that reach between d − 1 and d mm into the IM, where d = 1, 2, 3, 4, and 5. The flow rate and solute concentrations of the tubular fluid entering each LAL are given by the weighed average of the ascending thin limbs that it represents. In another simulation, we represented 10 LALs in the OM, which are associated with LALs reaching between (d − 1)/2 and d/2 mm into the IM, where d = 1,…, 10. Both simulations yielded urine osmolalities that are within 2% of the base-case value. These results suggest that the single-tube representation of the long TALs can be justified, inasmuch as the solute permeabilities of the LAL are low (1.1 × 10⁻⁵ cm/s for Na+ and 0.6 × 10⁻⁵ cm/s for urea), and solute fluxes along the TALs involve mostly active Na+ transport. Thus the TAL transepithelial solute fluxes are largely insensitive to intratubular fluid composition.
Boundary Conditions for the LAV
Because the distribution of blood flow, including the transition of AVR from the IM to the OM, has yet to be well characterized, we assumed that in the OM two model LAV (i.e., LAV1 and LAV2) have the same flow rate and fluid composition at the OM-IM boundary. In a set of simulations, we assessed the degree to which model predictions are impacted by the variations in boundary solute concentrations of the LAV. We conducted two simulations: case 1, in which the boundary Na+ and urea concentrations of LAV1 was 10% higher than LAV2, and case 2, in which the boundary solute concentrations of LAV1 was 10% lower than LAV2. The boundary fluid flow rates of the two LAV were assumed equal, as in base case.
Among the three cases, case 2 yielded the highest concentrating effect. In that case, the solute concentrations of LAV2, which occupies an interbundle position, were assumed to be higher than the intrabundle LAV1. Because the AVR are highly permeable, the more concentrated intravascular fluid in LAV2 raised the osmolality of the surrounding interstitial fluid and further facilitated water absorption from the OMCD. As a result, the OMCD fluid osmolality was predicted to be 842 mosmol/kgH2O in case 2, which is 2.01% higher than base case, and 4.58% higher than case 1 (805 mosmol/kgH2O). Urine osmolality was predicted to be 1,248 and 1,300 mosmol/kgH2O for case 1 and case 2, respectively. These differences are significant but not substantial. Thus these results suggest that variations in the relative solute concentrations of the two model LAV have small impacts on the model's concentrating effect.
DISCUSSION
Model Formulation and Implications
We have developed a highly detailed mathematical model for the urine concentrating mechanism in the renal medulla of the rat kidney. The model represents the radial organization of renal tubules and vessels, with respect to vascular bundles, by means of a region-based configuration. Transmural transport by tubules and vessels is approximated by single-barrier expressions that summarize experimental results for osmotically driven water fluxes, solute diffusion, and active solute transport. The model, which was solved to steady state, predicts, in all represented structures, the concentrations of sodium, urea, and a nonreabsorbable solute, the osmolality arising from these solutes, intratubular (or intravascular) flow rates of water and solutes, and transmural fluxes of water and solutes.
Using base-case parameters, the model attains in most structures an osmolality increase of about a factor of ∼2.5 along the OM, and another factor of ∼1.55 along the IMCD and vessels (see Fig. 2, A1 and A3). These increases are consistent with tissue slice experiments in rats (12, 70), rabbits (20), and dogs (62), and with electron microprobe experiments in rats (25). However, it is noteworthy that in the IM, the model's osmolality increases are attributable almost entirely to axial urea concentration increases. Except for the CD, the Na+ concentrations in most structures fail to rise significantly along the IM axis, a result that is in disagreement with published experimental data (e.g., Ref. 25).
As predicted by many investigators (2, 7, 17, 23, 28, 30, 43, 61, 64, 67), the model indicates that the marked radial organization of the OM, which is centered on the vascular bundles, has a significant impact on the interstitial concentrations seen by the various tubules and vessels, most notably, the sequestration of urea in and near the vascular bundles, and a focusing of TAL concentrating capacity on LDLs and CDs (see Fig. 2).
In contrast, the model predicts that, despite a structured organization of tubules and vessels around the CD cluster in the upper IM, the solute concentrations are approximately homogeneous at a given IM level (see Fig. 2, A0–C0). A significant difference in interstitial Na+ concentration (∼50 mM) between the two IM regions is predicted at the OM-IM border, but that difference quickly dissipates within the first millimeter of the IM. These results appear to suggest that, unlike in the OM, the radial organization in the IM does not lead to substantial solute sequestration. If that is the case, what are the roles of the CD clusters in the context of the urine concentrating mechanism? Indeed, in a previous modeling study (39), we compared the concentrating capability of an IM model that represents radial organization to one that assumes that the interstitial solute concentrations are homogeneous (i.e., no radial organization) and found that the radially homogeneous model produced a substantially concentrated urine. [It should be noted that, in that study (39), we assumed that the thin limbs of loops of Henle have low urea permeabilities.] A similar result was obtained in a companion study (33), in which we compared the present model with a radially homogeneous version. So, why are tubules and vessels organized the way they are, in the IM, when it does not appear to augment the concentrating capability of the system?
On the other hand, it may be that the radial organization of the IM functions in ways that are not directly (but possibly indirectly) related to the urine concentrating mechanism. The DVR location in the upper IM, which is external to the CD clusters, can be viewed as a continuation of the vascular bundles, which are prominent in the OM, particularly in the inner stripe. The isolation of DVR within the tightly packed vascular bundles not only increases OMCD fluid osmolality, it also preserves oxygen supply to the IM (4). We hypothesize that the separation of DVR from the CD clusters serves a similar function: it preserves oxygen supply to the deep IM. This issue is further discussed in the companion study (33).
Although the results of this study do not reveal a role of the radial tubular-vascular organization, in terms of solute sequestration, our findings are consistent with the hypothesis that the IM concentrating mechanism may be composed of three countercurrent systems (37). In the upper IM, the CD cluster form an intracluster countercurrent system, which may function specifically to raise the osmolality of CD tubular fluid by facilitating the targeted delivery of NaCl via loop-bend segments. In the peripheral regions of the CD cluster, tubules and vessels form an intercluster countercurrent system, where urea is absorbed from the ascending thin limbs, some of which is cycled back into the deep IM via the DVR. A third papillary countercurrent system can be found in the final 1.5–2 mm of the IM, where NaCl is absorbed from the loop bends, and urea and water are absorbed from the CD, eventually producing a concentrated urine.
In the review (37), we hypothesized that water is absorbed from the water-permeable portions of descending thin limbs, raising their tubular fluid NaCl concentration, a process which facilitates the concentrating processes in the papillary countercurrent system. However, our model predicted that a small amount of water was secreted into the LDL2 segments, which, taken in isolation, provides a diluting effect. Thus, although the model was able to generate a moderately concentrated urine, it appears that aspects of the tubular-vascular interactions remain to be understood.
Comparison with Previous Models
In 1991, Wexler, Kalaba, and Marsh (67) developed the highly innovative and influential “WKM model”, which represents a three-dimensional medullary structure and inspired a number of studies of the effects of regionalization (e.g., Refs. 61 and 66). In the WKM model, radial organization is represented by means of weighted, direct connections between each tubule and nearby vessels, and solute concentrations of AVR fluid are assumed to equal local interstitial concentrations. The connection network varies as a function of medullary depth, and at a particular medullary level, the connection-based representation allows each tubule to be influenced by the differing concentrations in adjoining vessels, which are in turn influenced by other tubules and vessels. The local nature of the interactions allows this model configuration to simulate preferential interactions among tubules and vessels that are anatomically nearby, and an implicit regionalization emerges from the localized interactions (67, 68).
In addition to having incorporated new findings on the transport properties of the loops of Henle, our model differs from the WKM model in that tubules and vessels do not interact directly but, rather, through the merged capillaries and interstitial fluid that make up the portions of the concentric regions that are exterior to tubules and vasa recta. Moreover, within a region, tubule-tubule interaction is on a common footing with tubule-vessel interaction. Tubules or vessels may straddle boundary walls and interact with two regions simultaneously. Adjoining regions interact via capillary flows and direct diffusion. By varying the solute permeabilities of region boundaries, differing degrees of regionalization can be simulated. Also in our model, AVR solute concentrations are allowed to differ from local interstitial concentrations, thus allowing us to investigate the dependence of the corticomedullary osmolality gradient on AVR permeability. The region-based approach is more suited to our distributed-loop formulation, which would have presented a challenge to the connection-based methodology when the loops occupy neighboring positions. [The WKM model used the shunted-loop representation (67); thus the following analysis does not apply to the WKM model.] Recall that in the distributed-loop formulation, one model loop is assumed to turn at each numerical grid point. Thus the model represents as many model loops as there are numerical grid points. Let us suppose that the LDLs of these loops occupy neighboring positions. In practice, each LDL is adjacent to no more than four or five other LDLs. However, because the precise connectivity is not known, and because the connectivity likely varies among different groups of LDLs, a reasonable approach might be to assume that each LDL is equally connected to all other LDLs. Under this assumption if there are N numerical grid points, then there are N(N − 1) connections. With that many connections, the computations will likely take a prohibitively long time. In contrast, the same scenario can be represented using the region-based methodology that requires only N connections, from each of the model LDLs to the appropriate region.
The IM concentrating mechanism considered in this study corresponds to the “solute secretion” mode that we proposed in Ref. 38, which assumes that those portions of the loop of Henle that are AQP1 null have very high urea permeability so that near equilibration with the interstitium can be maintained. The solute secretion mode was previously shown to be capable of producing a significant corticomedullary gradient in the IM while maintaining reasonable urine flow and free water absorption rates (38). However, the simple model used in Ref. 38 assumed that the composition of the interstitial fluid is homogeneous at each IM axial level and thus cannot adequately represent the three-dimensional architecture of the IM. In contrast, the present study does represent that IM three-dimensional architecture, and model results suggest that that the tubular-vascular structural organization constitutes an IM concentrating mechanism comprising three countercurrent systems, as discussed above.
The present study uses the “region-based” approach to represent the preferential interactions among the tubules and vessels. The OM component of the model is based on our previous region-based model (35), which explicitly represents only the OM, with the IM implicitly represented via boundary conditions. The two models generated similar predictions for the OM, a result that is not surprising, since we have previously shown that the predictions of our OM model nearly insensitive to the boundary conditions imposed at the OM-IM border, or to the assumed urine composition. That insensitivity can be attributed to small urine fluid and solute flows, relative to tubular flows in the OM.
The IM component of the present model is based on our previous region-based IM model (39), which explicitly represent the IM only; the content of the tubular and vascular fluids entering the IM is assumed to be known a priori. Unlike the OM model (35), IM model results are highly sensitive to boundary conditions at the OM-IM border. Thus, by representing the whole medulla, the present model more realistically represents the interactions between the OM and IM. Perhaps the most notable difference in the OM-IM boundary tubular content is that the present model predicts a substantial osmolality difference between CD and DVR, inasmuch as the regionalization in the OM gives rise to a substantial radial osmolality gradient. In contrast, the previous model (39) assumed that the fluids entering the DVR, LDL, and IMCD have the same osmolality. As a result, the present model predicted that the fluid enters the IMCD at a higher osmolality than assumed in Ref. 39 (820 compared with 765 mosmol/kgH2O); this osmolality difference is attributable to the higher urea content (481 vs. 409 mM). That difference, taken in isolation, may promote a more effective IM concentrating effect. On the other hand, the DVR of the present model enters the IM carrying a fluid that is substantially more diluted than the boundary conditions assumed in the previous IM model (39) (583 compared with 765 mosmol/kgH2O). Thus the DVR fluid imposes a larger load to the IM concentrating mechanism of the present model.
The IM concentrating mechanism considered in Ref. 39 corresponds to the “pipe” mode that we proposed in Ref. 38, which assumes that the AQP1-null portions of the loop of Henle have nearly zero urea permeability, an assumption not very different from the passive mechanism (26, 60). In contrast, the IM concentrating mechanism considered in the present study corresponds to the high loop of Henle urea permeability limit. Despite these differences, both models predict a generally increasing axial osmolality gradient along the IM, and the production of a moderately concentrated urine.
Comparison with Experimental Measurements
The osmolalities predicted by the model for tubular fluid in the bends of the longest loops, and in the final urine, are similar to osmolalities measured in antidiuretic rats (55) (see Table 3). An osmolality of the fluid at the bend of the long loops nearly identical to that in the fluid at the terminal end of the CDs is also observed in hamsters (10, 11). The interstitial fluid osmolality predicted by the model for the papillary tip (1,353 mosmol/kgH2O) is similar to that predicted for the urine. Moreover, the osmolality measured in vascular fluid near the papilla tip in moderately antidiuretic rats (18, 56) or hamsters (11, 46, 47), or predicted by this model, is similar to that measured in or predicted for the fluid at the bend of the loops or the CDs at the same level of the papilla (11, 18, 46, 47, 56).
However, significant differences between physiological data and model predictions remain. Micropuncture experiments by Pennell et al. (55) reported urine and loop-bend urea concentrations of 345 and 287 mM, respectively, whereas the model predicts substantially higher urea concentrations of 593 and 592, respectively (see Table 3). Nonetheless, higher urine urea concentrations (∼400–700 mM) have been measured in rats (3, 32, 63, 69). The differences in these measurements may be explained, in part, by the strain, size, age, diet, and physiological state of the rats, and the stimulus applied to induce antidiuresis. Measurements by Pennell et al. (55) were done using young, ADH-infused Sprague-Dawley rats, whereas some of the other studies were done with larger Wistar rats (32, 63), larger Sprague-Dawley rats (3), or urea-infused, young Sprague-Dawley rats (69). Also, micropuncture experiments by Jamison et al. (16) in antidiuretic Brattleboro rats yielded loop urea concentrations as high as 658 mM. Similarly high urea concentrations have been measured in the loops of Henle of hamsters (10, 45). It is noteworthy, however, that those studies also revealed loop-bend Na+ concentrations that are higher than urea, and substantially higher than the value predicted by our model (see below).
Another disagreement can be found in the Na+ concentration profiles predicted along the IM structures. Electron microprobe measurements performed in antidiuretic rat kidneys revealed a large axial Na+ concentration gradient (see Fig. 5 in Ref. 25). In contrast, except for the IMCD, the model predicts no significant axial Na+ concentration gradient in the fluid of most tubules, vessels, or interstitium in the IM. Indeed, the axial osmolality gradient generated in the model IM is attributed to the urea concentration gradient.
Yet another disagreement, perhaps related to the Na+ concentration gradient issue discussed above, appears in the urea and Na+ concentrations at the bend of Henle's loop (Table 3). Studies in moderately antidiuretic rats (55) and hamsters (10) consistently indicate that the Na+ concentration is substantially higher than the urea concentration in tubular fluid at the bend of the loop, the reverse of the composition in the final urine (or tubular fluid at the terminal end of the CDs). However, the reverse relationship (i.e., with urea concentration greater than Na+ concentration) is predicted by the model. The predicted urea concentration at the bend of the longest loop, 592 mM, is high relative to a measured concentration of 393 mM at the loop bend (55); the high model value arises from the high urea permeability and zero water permeability assumed for the AQP1-null segment of the descending thin limb. Nonetheless, the model predicts, in accordance with measurements, a Na+ concentration in the loop-bend fluid that is much higher than in the final urine.
Assuming that the descending limb tubular fluid osmolality increases along the AQP1-null segment, how is that gradient generated? Given that Dantzler et al. (6) reported a near zero water permeability along that segment, then if not by water reabsorption, is that osmolality gradient generated by solute secretion? Diffusive entry of NaCl seems unlikely, because the descending limb fluid NaCl concentration appears to be higher than local interstitial fluid. Our model predicted passive urea secretion, but that yielded loop-bend fluid composition that appears to be inconsistent with experimental measurements. A satisfactory resolution of this issue merits future studies.
GRANTS
This research was supported by National Institute of Diabetes and Digestive and Kidney Diseases Grant DK089066 and by National Science Foundation Grant DMS-0701412.
DISCLOSURES
No conflicts of interest, financial or otherwise, are declared by the author.
ACKNOWLEDGMENTS
The author thanks Dr. Tom Pannabecker and Dr. Bill Dantzler of the University of Arizona for helpful discussion on thin limb urea permeability measurements.
REFERENCES
- 1. Armsen T, Reinhardt HW. Transtubular movement of urea at different degrees of water diuresis.Pflügers Arch 326:270–280, 1971 [DOI] [PubMed] [Google Scholar]
- 2. Bankir L, de Rouffignac C. Urinary concentrating ability: insights from comparative anatomy.Am J Physiol Regul Integr Comp Physiol 249:R643–R666, 1985 [DOI] [PubMed] [Google Scholar]
- 3. Blount MA, Sim JH, Zhou R, Martin CF, Lu W, Sands JM, Klein JD. Expression of transporters involved in urine concentration recovers differently after cessation of lithium treatment.Am J Physiol Renal Physiol 298:F601–F608, 2010 [DOI] [PMC free article] [PubMed] [Google Scholar]
- 4. Chen J, Layton AT, Edwards A. A mathematical model of oxygen transport in the rat outer medulla: I. model formulation and baseline results.Am J Physiol Renal Physiol 297:F517–F536, 2009 [DOI] [PMC free article] [PubMed] [Google Scholar]
- 5. Chou CL, Knepper MA. In vitro perfusion of chinchilla thin limb segments: urea and NaCl permeabilities.Am J Physiol Renal Fluid Electrolyte Physiol 264:F337–F343, 1993 [DOI] [PubMed] [Google Scholar]
- 6. Dantzler WH, Evans KK, Pannabecker TL. Osmotic water permeabilities in specific segments of rat inner medullary thin limbs of Henle's loops.FASEB J 23:970.3, 2009 [Google Scholar]
- 7. de Rouffignac C. The urinary concentrating mechanism.In: Urinary Concentrating Mechanisms, edited by Kinne RKH.Basel: Karger, 1990, p. 31–102 [Google Scholar]
- 8. de Rouffignac C, Bouvalet JP. Étude chez le rat des variations du débit individuel de filtration glomérulaire des néphron superficiels et profonds en fonction de l'apport sodé. Pflügers Arch 317:141–156, 1970 [DOI] [PubMed] [Google Scholar]
- 9. Garg LC, Mackie S, Tischer CC. Effects of low potassium diet on Na-K-ATPase in rat nephron segments.Pflügers Arch 394:113–117, 1982 [DOI] [PubMed] [Google Scholar]
- 10. Gottschalk CW, Lassiter WE, Mylle M, Ullrich KJ, Schmidt-Nielsen B, O'Dell R, Pehling G. Micropuncture study of composition of loop of Henle fluid in desert rodents.Am J Physiol 204:532–535, 1963 [DOI] [PubMed] [Google Scholar]
- 11. Gottschalk CW, Mylle M. Micropuncture study of the mammalian urinary concentrating mechanism: evidence for the countercurrent hypothesis.Am J Physiol 196:927–936, 1959 [DOI] [PubMed] [Google Scholar]
- 12. Hai MA, Thomas S. The time-course of changes in renal tissue composition during lysine vasopressin infusion in the rat.Pflügers Arch 310:297–319, 1969 [DOI] [PubMed] [Google Scholar]
- 13. Han JS, Thompson KA, Chou CL, Knepper MA. Experimental tests of three-dimensional model of urinary concentrating mechanism.J Am Soc Nephrol 2:1677–1688, 1992 [DOI] [PubMed] [Google Scholar]
- 14. Imai M. Function of the thin ascending limb of Henle of rats and hamsters perfused in vitro.Am J Physiol Renal Fluid Electrolyte Physiol 232:F201–F209, 1977 [DOI] [PubMed] [Google Scholar]
- 15. Imai M, Taniguchi J, Yoshitomi K. Transition of permeability properties along the descending limb of long-loop nephron.Am J Physiol Renal Fluid Electrolyte Physiol 254:F323–F328, 1988 [DOI] [PubMed] [Google Scholar]
- 16. Jamison RL, Buerkert J, Lacy F. A micropuncture study of Henle's thin loop in Brattleboro rats.Am J Physiol 224:180–185, 1973 [DOI] [PubMed] [Google Scholar]
- 17. Jamison RL, Kriz W. Urinary Concentrating Mechanism: Structure and Function. New York: Oxford University Press, 1982 [Google Scholar]
- 18. Johnston PA, Battilana CA, Lacy FB, Jamison RL. Evidence for a concentration gradient favoring outward movement of sodium from the thin loop of Henle.J Clin Invest 59:234–240, 1977 [DOI] [PMC free article] [PubMed] [Google Scholar]
- 19. Kato A, Naruse M, Knepper MA, Sands JM. Long-term regulation of inner medullary collecting duct urea transport in rat.J Am Soc Nephrol 9:737–745, 1998 [DOI] [PubMed] [Google Scholar]
- 20. Knepper MA. Measurement of osmolality in kidney slices using vapor pressure osmometry.Kidney Int 21:653–655, 1982 [DOI] [PubMed] [Google Scholar]
- 21. Knepper MA. Urea transport in nephron segments from medullary rays of rats.Am J Physiol Renal Fluid Electrolyte Physiol 244:F622–F627, 1983 [DOI] [PubMed] [Google Scholar]
- 22. Knepper MA, Danielson RA, Saidel GM, Post RS. Quantitative analysis of renal medullary anatomy in rats and rabbits.Kidney Int 12:313–323, 1977 [DOI] [PubMed] [Google Scholar]
- 23. Knepper MA, Roch-Ramel F. Pathways of urea transport in the mammalian kidney.Kidney Int 31:629–633, 1987 [DOI] [PubMed] [Google Scholar]
- 24. Knepper MA, Saidel GM, Hascall VC, Dwyer T. Concentration of solutes in the renal inner medulla: interstitial hyaluronan as a mechano-osmotic transducer.Am J Physiol Renal Physiol 284:F433–F446, 2003 [DOI] [PubMed] [Google Scholar]
- 25. Koepsell H, Nicholson WAP, Kriz W, Höhling HJ. Measurements of exponential gradients of sodium and chloride in the rat kidney medulla using the electron microprobe.Pflügers Arch 350:167–184, 1974 [DOI] [PubMed] [Google Scholar]
- 26. Kokko JP, Rector FC. Countercurrent multiplication system without active transport in the inner medulla.Kidney Int 2:214–223, 1972 [DOI] [PubMed] [Google Scholar]
- 27. Kriz W. Der architektonische and funktionelle Aufbau der Rattenniere.Z Zellforsch 82, 1967 [PubMed] [Google Scholar]
- 28. Kriz W. Structural organization of the renal medulla: comparative and functional aspects. Am J Physiol Regul Integr Comp Physiol 241:R3–R16, 1981 [DOI] [PubMed] [Google Scholar]
- 29. Kriz W, Kaissling B. Structural organization of the mammalian kidney.In: The Kidney: Physiology and Pathophysiology (3rd ed.).Philadelphia, PA: Lippincott Williams & Wilkins, 2000, p. 587–654 [Google Scholar]
- 30. Kriz W, Lever AF. Renal countercurrent mechanisms: structure and function. Am Heart J 78:101–118, 1969 [DOI] [PubMed] [Google Scholar]
- 31. Kriz W, Schnermann J, Koepsell H. The position of short and long loops of Henle in the rat kidney.Z Anat Entwickl-Gesch 138:301–319, 1972 [DOI] [PubMed] [Google Scholar]
- 32. Lassiter WE, Gottschalk CW, Mylle M. Micropuncture study of net transtubular movement of water and urea in nondiuretic mammalian kidney.Am J Physiol 200:1139–1146, 1961 [DOI] [PubMed] [Google Scholar]
- 33. Layton AT. A mathematical model of the urine concentrating mechanism in the rat renal medulla. II. Functional implications of three-dimensional architecture.Am J Physiol Renal Physiol (First published November 10, 2010)doi:10.1152/ajprenal.00204.2010 [DOI] [PMC free article] [PubMed] [Google Scholar]
- 34. Layton AT, Layton HE. A region-based model framework for the rat urine concentrating mechanism. Bull Math Biol 65:859–901, 2003 [DOI] [PubMed] [Google Scholar]
- 35. Layton AT, Layton HE. A region-based mathematical model of the urine concentrating mechanism in the rat outer medulla. I. Formulation and base-case results.Am J Physiol Renal Physiol 289:F1346–F1366, 2005 [DOI] [PubMed] [Google Scholar]
- 36. Layton AT, Layton HE. A region-based mathematical model of the urine concentrating mechanism in the rat outer medulla. II. Parameter sensitivity and tubular inhomogeneity.Am J Physiol Renal Physiol 289:F1367–F1381, 2005 [DOI] [PubMed] [Google Scholar]
- 37. Layton AT, Layton HE, Pannabecker TL, Dantzler WH. The mammalian urine concentrating mechanism: hypotheses and uncertainties.Physiology 24:250–256, 2009 [DOI] [PubMed] [Google Scholar]
- 38. Layton AT, Pannabecker TL, Dantzler WH, Layton HE. Two modes for concentrating urine in the rat inner medulla.Am J Physiol Renal Physiol 287:F816–F839, 2004 [DOI] [PubMed] [Google Scholar]
- 39. Layton AT, Pannabecker TL, Dantzler WH, Layton HE. Functional implications of the three-dimensional architecture of the rat renal inner medulla.Am J Physiol Renal Physiol 298:F973–F987, 2010 [DOI] [PMC free article] [PubMed] [Google Scholar]
- 40. Layton HE. Distribution of Henle's loops may enhance urine concentrating capability.Biophys J 49:1033–1040, 1986 [DOI] [PMC free article] [PubMed] [Google Scholar]
- 41. Lemley KV, Kriz W. Cycles and separations: the histotopography of the urinary concentrating process.Kidney Int 31:538–548, 1987 [DOI] [PubMed] [Google Scholar]
- 42. Lemley KV, Kriz W. Anatomy of the renal interstitium.Kidney Int 39:370–381, 1991 [DOI] [PubMed] [Google Scholar]
- 43. Lever AF, Kriz W. Countercurrent exchange between the vasa recta and the loop of Henle.Lancet 14:1057–1060, 1966 [DOI] [PubMed] [Google Scholar]
- 44. Liu W, Morimoto T, Kondo Y, Iinuma K, Uchida S, Imai M. Avian-type renal medullary tubule organization causes immaturity of urine-concentrating ability in neonates.Kidney Int 60:680–693, 2001 [DOI] [PubMed] [Google Scholar]
- 45. Marsh DJ. Solute and water flows in thin limbs of Henle's loop in the hamster kidney.Am J Physiol 218:824–831, 1970 [DOI] [PubMed] [Google Scholar]
- 46. Marsh DJ, Azen SP. Mechanism of NaCl reabsorption by hamster thin ascending limbs of Henle's loop.Am J Physiol 228:71–79, 1975 [DOI] [PubMed] [Google Scholar]
- 47. Marsh DJ, Solomon S. Analysis of electrolyte movement in thin Henle's loops of hamster papilla.Am J Physiol 208:1119–1128, 1965 [DOI] [PubMed] [Google Scholar]
- 48. Nielsen S, Pallone T, Smith BL, Christensen EI, Agre P, Maunsbach AB. Aquaporin-1 water channels in short and long loop descending thin limbs and in descending vasa recta in rat kidney.Am J Physiol Renal Fluid Electrolyte Physiol 268:F1023–F1037, 1995 [DOI] [PubMed] [Google Scholar]
- 49. Pallone TL, Turner MR, Edwards A, Jamison RL. Countercurrent exchange in the renal medulla.Am J Physiol Regul Integr Comp Physiol 284:R1153–R1175, 2003 [DOI] [PubMed] [Google Scholar]
- 50. Pannabecker TL, Abbott DE, Dantzler WH. Three-dimensional functional reconstruction of inner medullary thin limbs of Henle's loop.Am J Physiol Renal Physiol 286:F38–F45, 2004 [DOI] [PubMed] [Google Scholar]
- 51. Pannabecker TL, Dantzler WH. Three-dimensional lateral and vertical relationship of inner medullary loops of Henle and collecting duct.Am J Physiol Renal Physiol 287:F767–F774, 2004 [DOI] [PubMed] [Google Scholar]
- 52. Pannabecker TL, Dantzler WH. Three-dimensional architecture of inner medullary vasa recta.Am J Physiol Renal Physiol 290:F1355–F1366, 2006 [DOI] [PubMed] [Google Scholar]
- 53. Pannabecker TL, Dantzler WH. Three-dimensional architecture of collecting ducts, loops of Henle, and blood vessels in the renal papilla.Am J Physiol Renal Physiol 293:F696–F704, 2007 [DOI] [PubMed] [Google Scholar]
- 54. Pannabecker TL, Dantzler WH, Layton HE, Layton AT. Role of three-dimensioal architecture in the urine concentrating mechanism of the rat renal inner medulla.Am J Physiol Renal Physiol 295:F1217–F1285, 2008 [DOI] [PMC free article] [PubMed] [Google Scholar]
- 55. Pennell JP, Lacy FB, Jamison RL. An in vivo study of the concentrating process in the descending limb of Henle's loop.Kidney Int 5:337–347, 1974 [DOI] [PubMed] [Google Scholar]
- 56. Pennell JP, Sanjana V, Frey NR, Jamison RL. The effect of urea infusion on the urinary concentrating mechanism in protein-depleted rats.J Clin Invest 55:399–409, 1975 [DOI] [PMC free article] [PubMed] [Google Scholar]
- 57. Sands JM, Layton HE. Urine concentrating mechanism and its regulation.In: The Kidney: Physiology and Pathophysiology (3rd ed.), edited by Seldin DW, Giebisch G. Philadelphia, PA: Lippincott Williams & Wilkins, 2000, p. 1175–1216 [Google Scholar]
- 58. Sands JM, Layton HE. The urine concentrating mechanism and urea transporters.In: Seldin and Giebisch's The Kidney: Physiology and Pathophysiology (4th ed.), edited by Alpern RJ, Hebert SC.New York: Elsevier, 2007, p. 1143–1178 [Google Scholar]
- 59. Sands JM, Nonoguchi H, Knepper MA. Vasopressin effects on urea and H2O transport in inner medullary collecting duct subsegments. Am J Physiol Renal Fluid Electrolyte Physiol 253:F823–F832, 1987 [DOI] [PubMed] [Google Scholar]
- 60. Stephenson JL. Central core model of the renal counterflow system.Kidney Int 2:85–94, 1972 [DOI] [PubMed] [Google Scholar]
- 61. Thomas SR. Cycles and separations in a model of the renal medulla.Am J Physiol Renal Physiol 275:F671–F690, 1998 [DOI] [PubMed] [Google Scholar]
- 62. Ullrich KJ, Jarausch KH. Untersuchungen zum Problem der Harnkonzentrierung and Harnverdünnung Ueber der Verteilung von Electrolyten (Na, K, Ca, Mg, Cl, anorganischem Phosphat), Harnstoff, Aminosäuren and exorgenem Kreatinin in Rinde und Mark der Hundeniere bei verschiedenen Dieresezuständen.Pflügers Arch 262:537–550, 1956 [DOI] [PubMed] [Google Scholar]
- 63. Ullrich KJ, Schmidt-Nielsen B, O'Dell R, Pehling G, Gottschalk CW, Lassiter WE, Mylle M. Micropuncture study of composition of proximal and distal tubular fluid in rat kidney.Am J Physiol 204:527–531, 1963 [DOI] [PubMed] [Google Scholar]
- 64. Valtin H. Structural and functional heterogeneity of mammalian nephrons.Am J Physiol Renal Fluid Electrolyte Physiol 233:F491–F501, 1977 [DOI] [PubMed] [Google Scholar]
- 65. Wade JB, Lee AJ, Ecelbarger CA, Mitchell C, Bradford AD, Terris J, Kim GH, Knepper MA. UT-A2: a 55-kDa urea transporter in thin descending limb whose abundance is regulated by vasopressin.Am J Physiol Renal Physiol 278:F52–F62, 2000 [DOI] [PubMed] [Google Scholar]
- 66. Wang X, Thomas SR, Wexler AS. Outer medullary anatomy and the urine concentrating mechanism.Am J Physiol Renal Physiol 274:F413–F424, 1998 [DOI] [PubMed] [Google Scholar]
- 67. Wexler AS, Kalaba RE, Marsh DJ. Three-dimensional anatomy and renal concentrating mechanism. I. Modeling results.Am J Physiol Renal Fluid Electrolyte Physiol 260:F368–F383, 1991 [DOI] [PubMed] [Google Scholar]
- 68. Wexler AS, Kalaba RE, Marsh DJ. Three-dimensional anatomy and renal concentrating mechanism. II. Sensitivity results.Am J Physiol Renal Fluid Electrolyte Physiol 260:F384–F394, 1991 [DOI] [PubMed] [Google Scholar]
- 69. Wilson DR, Sonnenberg H. Urea reabsorption in the medullary collecting duct of protein-depleted young rats before and after urea infusion.Pflügers Arch 393:302–309, 1982 [DOI] [PubMed] [Google Scholar]
- 70. Wirz H, Hargitay B, Kuhn W. Lokalisation des Konzentrierungsprozesses in der Niere durch direkte Kryoskopie.Helv Physiol Pharmacol Acta 9:196–207, 1951 [PubMed] [Google Scholar]