

Abstract
Examining neuronal network activity in freely behaving animals is advantageous for probing the function of the vertebrate central nervous system. Here, we describe a simple, robust technique for monitoring the activity of neural circuits in unfettered, freely behaving zebrafish (Danio rerio). Zebrafish respond to unexpected tactile stimuli with short- or long-latency escape behaviors, which are mediated by distinct neural circuits. Using dipole electrodes immersed in the aquarium, we measured electric field potentials generated in muscle during short- and long-latency escapes. We found that activation of the underlying neural circuits produced unique field potential signatures that are easily recognized and can be repeatedly monitored. In conjunction with behavioral analysis, we used this technique to track changes in the pattern of circuit activation during the first week of development in animals whose trigeminal sensory neurons were unilaterally ablated. One day post-ablation, the frequency of short- and long-latency responses was significantly lower on the ablated side than on the intact side. Three days post-ablation, a significant fraction of escapes evoked by stimuli on the ablated side was improperly executed, with the animal turning towards rather than away from the stimulus. However, the overall response rate remained low. Seven days post-ablation, the frequency of escapes increased dramatically and the percentage of improperly executed escapes declined. Our results demonstrate that trigeminal ablation results in rapid reconfiguration of the escape circuitry, with reinnervation by new sensory neurons and adaptive changes in behavior. This technique is valuable for probing the activity, development, plasticity and regeneration of neural circuits under natural conditions.
Keywords: escape behavior, field potential, Mauthner, neural circuit, trigeminal neuron, zebrafish, startle response
INTRODUCTION
The zebrafish is well established as a vertebrate model system with substantial advantages for studying nervous system development (Hatta and Kimmel, 1993; Blader and Strähle, 2000; Mione et al., 2008; Abraham et al., 2009). It is also emerging as an excellent system for investigating the function of neural circuits and the neural control of behavior (Drapeau et al., 1999; Fetcho and Higashijima, 2004; McDearmid and Drapeau, 2006; Fetcho, 2007). In recent years, electrophysiological, Ca2+-imaging and optogenetic approaches have been developed to record neuronal activity in the zebrafish spinal cord and brain (Fetcho et al., 1997; Fetcho and Higashijima, 2004; Kohashi and Oda, 2008; Yaksi et al., 2009). Expression of light-activated glutamate receptors, channelrhodopsin-2 and halorhodopsin has made it feasible to control the activity of particular neural circuits and determine the behavioral consequences in living animals (Petreanu et al., 2007; Wyart et al., 2009). One outcome has been to identify some of the cellular components of spinal cord circuits that mediate swimming and startle or escape behavior (Fetcho and O'Malley, 1997; Fetcho et al., 1997; Saint-Amant and Drapeau, 1998a; Drapeau et al., 1999; Brustein et al., 2003; Higashijima et al., 2003). Despite this progress, our ability to monitor the activation of these circuits in freely behaving animals remains limited. Here, we describe a method for recording the activity of distinct neural circuits that control fast and slow escape behavior in completely unfettered zebrafish.
Fast escape behavior, also called the startle response, has been well characterized in zebrafish (Eaton et al., 2001). Zebrafish respond to unexpected or potentially threatening stimuli by quickly turning away from the source and rapidly swimming away (Fig. 1A). The initial deep bend is called the C-start after the shape the body assumes at its maximum angle. The C-start response is triggered by activation of the Mauthner cell, one of a pair of large, bilaterally symmetric reticulospinal neurons whose network is distributed from the caudal midbrain to the spinal cord. Mauthner cells receive input from sensory neurons conveying mechanical, chemical, auditory, vibrational or visual information (Peterson, 1984; Grantyn et al., 1992; Zottoli et al., 1995; Tanimoto et al., 2009). Mauthner-mediated escapes have a rapid onset and are highly stereotyped (Kimmel et al., 1974). In addition to the Mauthner cells, two sets of smaller segmental homologs, called MiD2cm and MiD3cm, are thought to fine tune the trajectory of the escape and may be sufficient to initiate rapid escapes in the absence of the Mauthner cell under some circumstances (Zottoli, 1977; Faber et al., 1989; Liu and Fetcho, 1999; Zottoli and Faber, 2000). Many of the individual types of neurons involved in Mauthner-mediated escape behavior have been identified (Faber et al., 1989).
Fig. 1.

Zebrafish escape circuit and experimental setup. (A) A simplified diagram of the Mauthner-mediated escape circuit. Mechanosensory stimuli activate trigeminal sensory neurons (blue) that synapse onto the ipsilateral Mauthner neuron (red). The Mauthner cell axon crosses the midline and activates the axial motor neurons and respective muscles on the contralateral side. (B) The setup for recording electric field potentials generated during escape behavior. Behavior was evoked by applying a jet of water to the head and was recorded by high-speed videography (1000 frames s–1). Simultaneously, electric field potentials (red ovals surrounding behaving animal in chamber) were measured using a differential amplifier. Electric field recordings and videos of behavior (red and blue components on computer display) were digitally synchronized with the onset of the Picospritzer water jet (green component on display). This ensured time-locking of the field potential, escape behavior and water jet pulse. (C) Changes in head trajectory during escape behavior were measured as the angle between the original body axis (–1 ms, just prior to the first detectable movement) and lines drawn through the head at subsequent time points (13, 19, 24 and 26 ms later). In this example, the maximal change in head trajectory occurred 26 ms after the first detectable movement. Angular velocity was calculated by measuring the change in head trajectory as a function of frame number, with each frame corresponding to 1 ms.
When sensory stimuli are insufficient to bring the Mauthner cell to threshold, zebrafish exhibit escape behavior that is slower in onset and execution and more variable in form than the C-start response (Kohashi and Oda, 2008). The circuitry underlying non-Mauthner escapes is not well defined, although some components have been identified (Kohashi and Oda, 2008).
Here we demonstrate the advantages of using electric field potentials generated during escape behavior to monitor the output of the underlying neural circuits (Eaton and Farley, 1975; Eaton et al., 1977b; Prugh et al., 1982). We show that the distinct neural circuits that control fast and slow escape behaviors generate unique electric field signatures. We used this technique in conjunction with behavioral analysis to study the plasticity of the escape network after ablation of the trigeminal sensory neurons. This simple technique makes it feasible to monitor neural circuit activation without compromising the animal's natural behavior.
MATERIALS AND METHODS
Animal maintenance
AB wild-type zebrafish, Danio rerio (Hamilton 1822), embryos were raised at 28.5°C using a 14 h:10 h light:dark cycle. Animal procedures were approved by the Chancellor's Animal Research Committee at UCLA.
Experimental setup
Experiments were conducted at 27°C using larval zebrafish at 2–5 days post-fertilization (d.p.f.). The test chamber measured 2.5×1.0×0.5 cm and was made of Sylgard® (Dow Corning, Midland, MI, USA) (Fig. 1B). Stainless steel insect pins (250 μm diameter) were inserted at either end of the chamber and used as bath electrode leads. Steel electrodes were chosen because they are inexpensive and readily detect the field potential signals generated by behaving zebrafish. The chamber contained double-distilled water with a resistance of ∼15 MΩ. Zebrafish are freshwater animals that can be exposed to high-resistance distilled water for as long as 6 h with no obvious ill effects. No changes in escape behaviors evoked by tactile or visual stimuli were detected in animals maintained in distilled water for up to 6 h. Highly resistive water prevented dissipation of the electric field and enhanced the signal-to-noise ratio. Electric field potentials were measured in 20 animals tested individually. Each animal was tested 20–25 times at intervals of 5 min to prevent habituation. Each animal was transferred to the chamber and acclimated for 15 min. Behavioral responses were evoked by a 3 ms water jet applied using a Picospritzer III (Parker Instrumentation, Cleveland, OH, USA) to the left or right side of the head in random order. Stimuli were delivered using a glass micropipette with a tip diameter of ∼0.2–0.4 mm. Picospritzer pressure was adjusted to ∼103–138 kPa. Under these conditions, the majority of stimuli produced behavioral responses.
Electric field potentials were recorded using an AC Cornerstone differential amplifier (Dagan Corp., Minneapolis, MN, USA), kindly provided by Dr Franklin Krasne (UCLA). Field potential signals were amplified 2000-fold, low-pass filtered at 300 Hz and high-pass filtered at 500 Hz. Filter settings were selected to optimize the signal-to-noise ratio and thereby facilitate detection of an initial, small-amplitude component of the field potential signal (see Fig. 2B). Bath electrode signals, the high-speed camera transistor–transistor logic (TTL) pulse and the Picospritzer pulse were digitized with a Digidata-1322A and acquired using Axoscope software (Molecular Devices, Inc., Sunnyvale, CA, USA). Just prior to the water pulse, the Picospritzer activated the video camera via its digital input, thereby time-locking the water jet to the exact video frame at which the pulse was delivered.
Fig. 2.

Large, phasic electric field potential generated during short-latency escape behavior. (A) Selected frames recorded during a representative fast escape response evoked at 5 d.p.f. are shown. The micropipette tip used to deliver the stimulus can be seen at the left side of each frame. The black square in the second frame indicates the start of the Picospritzer pulse. Time=0 ms (not shown) corresponds to the time the stimulus contacted the animal. (B) Electric field potential recorded during the escape response shown in A (top trace). The field potential delay (horizontal double-headed arrow) was measured as the time between arrival of the stimulus (downward arrow, 0 ms) and the beginning of the phasic component of the signal. The middle trace is the camera's TTL pulse, which is time-locked with the field potential recording. Numbers represent the frame time (ms) corresponding to images shown in A. The bottom trace indicates the time course of the Picospritzer water jet pulse. In this and subsequent figures, the upward arrow indicates the start of the water jet. The downward arrow indicates the time at which the stimulus contacted the animal (t=0 ms). Left inset: enlarged view of a small potential preceding the phasic potential. Right inset: the large, phasic component of the field potential signal. Brackets denote the duration of the phasic component and the maximum field potential amplitude measured from peak to peak. Results are representative of experiments using 20 control animals in which 350 stimuli were applied. Short-latency escape behavior was evoked in 190 trials.
The amplitude of electric field potentials generated during zebrafish behavior depended on the orientation of the animal relative to the bath electrodes. In control and Mauthner cell ablation experiments, trials were excluded from analysis if the animal's body axis deviated by more than ±10 deg relative to a line drawn between the bath electrodes. In the trigeminal neuron ablation experiments, all trials were analyzed regardless of animal orientation because few animals were tested and field potential signals were scored but not analyzed quantitatively. Field potential signals were not produced by water turbulence because agitating the water in the absence of an animal did not generate electric field potentials (data not shown).
Behavioral analysis
Behavioral responses were recorded at 1000 frames s–1 using a Redlake Motion Meter high-speed digital video camera (DEL Imaging Systems, Cheshire, CT, USA). Frames were imported into NIH ImageJ for analysis (http://rsbweb.nih.gov/ij/index.html). The latency of the behavioral response was measured from the arrival of the stimulus to the onset of movement. The time the stimulus reached the animal was readily determined because the water jet was sufficiently strong to push the animal back upon contact. The amplitude of the behavioral response was characterized by measuring the change in head trajectory, which was defined as the angle between the original body axis and an intersecting line drawn through the head at the maximum bending response (θ, Fig. 1C). To calculate the angular velocity of the response, intermediate trajectory angles were measured from each video frame (Fig. 1C). Typically, ∼10 short-latency and approximately six long-latency escapes, corresponding to trials in which the animal was in the optimal orientation, were averaged per animal and an overall mean was calculated across animals. Values provided in the text correspond to the overall means ± s.d.
Analysis of field potentials
Field potential amplitudes were measured as the difference between the maximum and minimum values recorded in the experiment (see Figs 3, 4). The duration of short-latency field potentials was defined as the duration of the large, phasic potential signal (see Fig. 2B). The duration of long-latency potentials was measured from the onset to the end of the signal (see Fig. 4A). For fast escapes, the latency of the electrical signal was defined as the time difference between the arrival of the stimulus and the beginning of the large phasic potential change (see Fig. 2B). For slow escapes, the latency of the electric signal was defined as the time difference between the arrival of the stimulus and the beginning of the field potential change (see Fig. 4B).
Fig. 3.

Large, phasic field potential eliminated by curare. (A) A representative recording of an electric field potential generated during a short-latency escape response evoked at 5 d.p.f. (top). Inset: enlarged view of small, initial field potential signal. (B) A representative recording of the field potential after curare treatment. Inset: enlarged view of the remaining small potential signal. The lower traces in A and B show the time course of the water jet pulse. Results are representative of experiments using five animals. Prior to addition of curare, 69 stimuli resulted in 57 short- and 12 long-latency escapes. After addition of curare, 54 stimuli were applied but no escape behavior was evoked.
Fig. 4.

Small-amplitude, variable electric field potential generated during long-latency escape behavior. (A) Selected frames recorded during a representative slow escape response evoked at 5 d.p.f. (B) Electric field potential recorded during the escape response shown in A (top). The field potential delay (horizontal double-headed arrow) was measured as the time between arrival of the stimulus (downward arrow) and the beginning of the signal. The middle and lower traces are arranged and labeled as described in the legend to Fig. 2. The bracket denotes the duration of the field potential signal. The amplitude of the signal was calculated from the maximum and minimum values recorded (filled circles). Results are representative of experiments using 20 control animals in which 350 stimuli were applied. Long-latency escape behavior was evoked in 90 trials.
d-Tubocurarine application
To facilitate curare access to the musculature, a tiny incision was made at the base of the tail using a glass micropipette. Animals were bathed for 10 min in 10 μM d-tubocurarine chloride hydrate, which was added to the test chamber and then washed out with double-distilled water. Treatment with curare effectively paralyzed the zebrafish, abolishing behavioral responses. Application of water jet stimuli and recordings of field potentials began immediately after curare treatment and continued for 1 h.
Mauthner neuron backfilling
Zebrafish (3 d.p.f.) were anesthetized in 0.02% tricaine methylsulfonate and placed dorsal side up on an agarose-lined Petri dish thinly covered with water. Dextran fluorescein dye (10,000 MW; Invitrogen, Carlsbad, CA, USA) was dissolved in water and pressure-injected into the caudal (postanal) spinal cord using glass microelectrode pipettes (2–10 MΩ) (O'Malley et al., 1996). Picospritzer pressure was adjusted so that the injected dye could be detected visually. Generally, the pressure did not exceed 103 kPa. Animals were returned to the aquarium for 24 h prior to ablation.
Trigeminal and Mauthner neuron ablation
To inhibit pigment formation, fish were kept continuously in 5% 1-phenyl-2-thiourea (PTU) Ringer's solution starting at 24 h post-fertilization (h.p.f.). Animals were anesthetized in 0.02% tricaine 30 min prior to laser ablation and immobilized in 1% low-melt agarose. Transgenic zebrafish that express green fluorescent protein (GFP) in sensory neurons [Tg:(isl2b-GFP)] were used to laser ablate trigeminal neurons, which was performed at 3 d.p.f. (Pittman et al., 2008). The cell bodies of GFP-expressing trigeminal neurons or dye-filled Mauthner cells were ablated on one side of the body using a custom-built scanning two-photon microscope with a Chameleon Ti:Sapphire laser located in the Portera-Cailliau laboratory at UCLA. Cells were imaged using a wavelength of 850 nm and a power of 30 mW at the sample, and ablated using an optical zoom of 20× and power of 180 mW at the sample (40× water immersion Olympus objective, 0.8 numerical aperture). Animals were removed from agarose and put into tricaine- and PTU-free Ringer's solution for 16–24 h prior to testing (O'Brien et al., 2009).
RESULTS
Short-latency escape response is associated with large, phasic electric field potential
To determine whether escape behavior generates detectable electric field potentials, animals were placed in a distilled water chamber with two dipole electrodes immersed at either end. Behavior was evoked by applying an unexpected jet of water to the head and was recorded by high-speed videography (1000 frames s–1) using a digital camera. Concurrently, electric field potentials were measured using a differential amplifier (Fig. 1A,B).
In 54% of trials, a brief water jet pulse evoked rapid escape behavior initiated by a characteristic C-start bend, which turned the animal away from the stimulus (Fig. 1C, Fig. 2A) (Eaton et al., 1977a; Zottoli, 1977). The C-bend was usually followed by a counterbend, after which the animal swam away from the source of the stimulus. Each rapid escape was accompanied by a large, phasic electric field potential that was highly stereotyped in waveform and amplitude (Fig. 2B). The latency between the stimulus and the phasic potential was 7.1±3.7 ms. There was a strong temporal correlation between the large field potential signal and the initial movement of the escape behavior, which lagged the onset of the field potential by 5±1 ms (Fig. 2B). The large phasic signal was consistently preceded by a much smaller potential with a duration of 1.2±0.3 ms (Fig. 2B, inset). The interval between this small signal and the large phasic potential was 1.2±0.4 ms. After the large phasic component of the signal, additional fluctuations of the field potential were detected. These varied in amplitude and duration, and may be associated with the more variable counterbend and swimming phases of the escape response.
To determine whether the field potential signal reflected electrical activity in nerve, muscle or both, animals were treated with curare to block nicotinic acetylcholine receptors at the neuromuscular junction. The resulting paralysis eliminated the behavioral response as well as the large phasic component and the later variable fluctuations of the field potential signal (Fig. 3A). These data indicate that the bulk of the potential signal results from electrical activity in muscle. Therefore, the 5 ms lag between the large phasic potential and the start of the escape response likely reflects the time between the muscle action potential and generation of sufficient tension in the contractile apparatus to produce detectable motion (Eaton et al., 2001).
Although curare abolished the bulk of the electric field potential, the small initial component of the signal persisted in paralyzed animals, suggesting that this portion of the field potential results from electrical activity in neurons (Fig. 3B). Because of its small amplitude, this component was most readily detected when the animal was oriented lengthwise between the bath electrodes.
The amplitude of the initial, neurogenic spike was decreased in the curare experiment by a mean of 36.7% (cf. Fig. 3A with 3B), probably because a small incision was made to optimize drug access to the musculature. The field potentials measured in our experiments are generated by electric currents passing through the least resistive parts of the animal's body, probably between the mouth and the anus or gills. The incision likely provided an alternative, lower resistance pathway, thereby decreasing the size of the potential signal detected by the bath electrodes. To test this interpretation, we measured field potential amplitudes before and after introducing an incision (supplementary material Fig. S1). The amplitudes of the neurogenic and muscle field potentials decreased in parallel by 32 and 37%, respectively. These results are comparable to the decline observed in the curare experiment and support the idea that the incision creates a lower resistance pathway, thereby reducing the amplitudes of field potentials measured in our experiments.
Long-latency behavioral response is associated with variable, low-amplitude electric field potential
In some trials, the water jet stimulus failed to evoke a rapid, C-start escape response. In these cases, the animal typically turned away from the stimulus after a prolonged delay of 26.6±11.8 ms (Fig. 4A). This bend was shallower and slower than the C-start observed during fast escape behavior. This delayed avoidance behavior, which was less stereotyped than the C-start response, may correspond to a long-latency escape or evoked swimming. Similar movements can be voluntarily initiated at this stage of development (Didomenico et al., 1988). This slow escape behavior was accompanied by low-amplitude, long-duration field potentials (Fig. 4B). Like the behavior, these electrical signals were more variable than the stereotyped large-amplitude phasic potentials associated with the C-start escape response (cf. Fig. 4B with Fig. 2B).
Short- and long-latency escape responses generate quantitatively distinct electric field potential signals
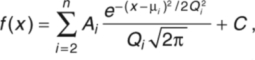
To characterize quantitatively the short- and long-latency behavioral responses and their associated electric field potentials, we binned the measured behavioral latencies and plotted them in histogram form (Fig. 5A). The data were well fitted by the sum of two Gaussian functions. On the basis of the fitted distributions, responses with latencies from 3–16 or 17–40 ms were categorized as short- or long-latency escape behaviors, respectively. As expected from qualitative analysis of the behavioral videos, the change in head trajectory during the initial bend was significantly larger for short-latency than for long-latency responses (Fig. 5B).
Fig. 5.

 |
We analyzed the electric field potentials associated with short- and long-latency behavioral responses by measuring the delay between the stimulus and the start of the potential signal as well as the initial amplitude and duration of the signal (Fig. 6A–C, left panels). Field potentials associated with short-latency escapes occurred with significantly shorter delays and had larger amplitudes and shorter durations than those associated with long-latency escapes (Fig. 6A–C, right panels; Table 1). Thus, the field potential parameters reflect the differences in time of onset, bend angles and duration that are characteristic of the short- and long-latency behaviors (Fig. 6, Table 1).
Fig. 6.

Quantitative differences between field potentials generated by short-(filled) and long-latency (open) behaviors evoked at 3–5 d.p.f. (A) Mean delay values for electric field potential signals (left) and escape behaviors (right). Field potential delays were measured as described in the legends to Fig. 2B and Fig. 4B. Behavioral delays were measured as the interval between arrival of the stimulus and the first detectable movement. (B) Mean durations of electric field potential signals (left) and escape behaviors (right). Field potential durations were measured as described in the legends to Fig. 2B and Fig. 4B. Escape behavior durations were measured from the first detectable movement to full flexion. (C) Mean amplitudes of electric field potential signals (left) and maximum changes in head trajectory (right) during escape behaviors. Field potential amplitudes were measured as described in the legends to Fig. 2B and Fig. 4B. Changes in head trajectory were measured as described in the legend to Fig. 1C. Numerical values for all parameters (±s.d.) are provided in Table 1, N=20. ***, P<0.0005 (two-tailed Wilcoxon matched-pairs test). Escape behavior was elicited in 280 out of 350 trials. Trials that failed to evoke escape behavior are not shown. (D) Relationship between the maximal angular velocities of short- and long-latency escapes and the corresponding field potential signals. Each symbol represents the mean of data collected from an individual animal.
Table 1.
Electrical field potential and behavioral response parameters (N=20 animals) (see Fig. 6)

The amplitudes of the field potential signals are of particular interest because they indicate the strength of muscle contraction, which translates behaviorally to angular velocity. We measured the maximum angular velocities of short- and long-latency escapes, which averaged 20±3.1 and 8.4±4.4 deg ms–1, respectively, and compared the velocity to the amplitude of the field potentials. We found that high velocity escapes consistently produced large field potential amplitudes whereas slower escapes produced smaller field potential amplitudes (N=20) (Fig. 6D).
These results strongly support the conclusion that the field potential signals are generated by the electrical activity underlying the escape behaviors. Furthermore, distinct field potential profiles are associated with short- and long-latency escapes.
Ablation of Mauthner neuron selectively affects short-latency escape response and field potential
The fast C-start escape response is known to be mediated by activation of the Mauthner cell, one of a pair of hindbrain neurons that, in response to sufficient sensory stimulation, fires once to initiate strong, rapid muscle contraction contralateral to the stimulus (Fig. 1A) (Eaton et al., 2001). In contrast, longer-latency escapes do not involve Mauthner cell activation (Didomenico et al., 1988; Eaton et al., 2001).
To test the hypothesis that the large field potentials generated during short-latency escapes require Mauthner cell activation, we unilaterally ablated the Mauthner neuron in nine animals at 4 d.p.f. (Fig. 7A). Behavior and electric field potentials were assessed 24 h after ablation by an experimenter who did not know which side had been ablated. The animals were stimulated on the left and right sides in random order. We found that stimuli applied to the intact side continued to produce fast escape responses that generated large, phasic electric field potentials (Fig. 7B–D). The mean values for latency and amplitude of the behavioral responses and associated field potentials did not differ significantly from those of control (unablated) animals (data not shown). In contrast, stimuli applied to the ablated side were much less likely to generate fast escape responses, whereas the occurrence of longer-latency, slower behavioral responses accompanied by smaller, delayed electric field potentials increased significantly (Fig. 7B–D) (Wilcoxon matched pairs, short-latency escapes intact vs ablated, P=0.0273; long-latency escapes intact vs ablated, P=0.0488). These data support the conclusion that activation of the Mauthner cell is required to generate the phasic electric field potentials associated with fast, C-start escape responses. In addition, the results suggest that the small-amplitude, curare-resistant field potential that precedes the large, phasic signal during C-start responses is generated by the Mauthner cell action potential (see Fig. 3).
Fig. 7.

Unilateral Mauthner ablation impairs fast escape and associated electric field potentials. (A) Confocal images of dye-filled Mauthner cell bodies were obtained before (left) and immediately after (right) laser ablation of the right Mauthner cell performed at 4 d.p.f. Schematic drawing (center) shows approximate Mauthner cell location (arrow). (B) Electric field potentials (top) were recorded in response to stimuli delivered to the intact (left) or ablated (right) sides at 5 d.p.f. The lower trace corresponds to the Picospritzer pulse. (C) Selected frames show behavioral responses evoked by stimuli delivered to the intact (left) or ablated (right) sides. Behavioral responses correspond with the field potentials shown in B. Representative results are shown in B and C. (D) Percentage of short- and long-latency scape responses to stimuli delivered to the intact and ablated sides. Results were obtained from nine animals in which 81 and 94 stimuli were applied to the intact and ablated sides, respectively. Gray bars indicate the percentage of trials that failed to elicit escape behavior. Included in this category are trials in which the animal righted itself after being knocked over by the stimulus jet.
Sensory denervation reduces behavioral responsiveness and generation of electric field potentials
The surface of the head is innervated by mechanosensitive trigeminal neurons that are expected to mediate the sensory component of behaviors evoked by head-directed water jets (Kimmel and Westerfield, 1990; Saint-Amant and Drapeau, 1998b). Trigeminal cell bodies are located behind the eye and extend their peripheral axon arbors into the skin (Sagasti et al., 2005). To determine the effect of sensory denervation on escape behavior and the generation of electric field potentials, the neurons of the trigeminal ganglion were unilaterally ablated in four animals at 3 d.p.f. (Fig. 8A). Ablations were performed using transgenic zebrafish [Tg(isl2b:GFP)] that express GFP in early-arising trigeminal neurons (Pittman et al., 2008). Behavioral responses and electric field potentials were recorded 16–24 h following ablation. One day after ablation, more than 90% of stimuli applied to the intact side evoked behavioral responses, the majority of which were fast escapes accompanied by large, phasic field potential signals (Fig. 8B, left panel; Fig. 9A). In contrast, fewer than 30% of stimuli delivered to the ablated side evoked behavioral responses, the majority of which were short-latency escapes (Fig. 8B, right panel; Fig. 9B). Unlike Mauthner cell ablation, which increased the frequency of long-latency escapes (Fig. 7D), trigeminal ablation significantly reduced the occurrence of both short- and long-latency escape behaviors, consistent with diminished sensory sensitivity (Fig. 9B). As expected, in the absence of escape behavior, electric field potential signals were not detected (Fig. 8B).
Fig. 8.

Unilateral ablation of trigeminal neurons impairs fast and slow escapes and associated electric field potentials. (A) Confocal images of GFP-expressing trigeminal sensory neurons were obtained before (left) and immediately after (right) laser ablation of neurons in the right trigeminal ganglion performed at 3 d.p.f. Unlabelled arrow in right panel points to area previously occupied by trigeminal cell bodies. Schematic drawing (center) shows approximate location of a trigeminal neuron (arrow). (B–D) Results were obtained 1 (B), 3 (C), or 7 (D) days post-ablation (d.p.a.) from four (B,C) or two animals (D). Top: electric field potentials were recorded in response to stimuli delivered to the intact (left) or ablated (right) sides. Insets show the initial, neurogenic component of the signal on an expanded scale. Middle: the Picospritzer pulse. Bottom: selected frames show behavioral responses evoked by stimuli delivered to the intact (left) or ablated (right) sides. In C (3 d.p.a.), the animal turns toward the stimulus rather than away in response to a stimulus delivered to the ablated side. Field potentials and the corresponding behavioral responses were recorded in the same trial. Results are representative of data obtained from four animals at 1 and 3 d.p.a. and from two animals at 7 d.p.a. Day 1: 23 stimuli on intact side, 31 stimuli on ablated side; day 3: 18 stimuli on intact side, 21 stimuli on ablated side; day 7, 15 stimuli on intact side, 19 stimuli on ablated side.
Fig. 9.

Adaptation of escape circuitry after unilateral ablation of trigeminal neurons. (A) Percentage of short- and long-latency behavioral responses elicited by stimuli applied to the intact side 1, 3 or 7 days after trigeminal ablation. Open squares indicate the percentage of trials that failed to elicit escape behavior. Included in this category are trials in which the animal righted itself after being knocked over by the stimulus jet. Four animals were tested on days 1 and 3; two animals were tested on day 7. (B) Percentage of short- and long-latency behavioral responses elicited by stimuli applied to the ablated side 1, 3 or 7 days after trigeminal ablation. Four animals were tested on days 1 and 3; two animals were tested on day 7. (C) Percentage of misdirected short- and long-latency behavioral responses elicited by stimuli applied to the ablated side 1, 3 or 7 days after trigeminal ablation. In these trials, the animal turned toward the stimulus rather than away. Diamonds indicate the percentage of misdirected responses elicited by stimuli applied to the intact side.
Escape behavior and associated field potentials partially recover after sensory ablation
To determine whether there were behavioral and/or physiological adaptations to trigeminal denervation, we tested the animals' sensitivity to sensory stimulation 3 and 7 days post-ablation (d.p.a.). After 3 d.p.a., a significant fraction of escapes evoked by stimuli on the ablated side were improperly executed, with the animal turning towards the stimulus rather than away in 43% of trials (Fig. 8C; Fig. 9C). However, the overall response rate remained low (Fig. 9B). This behavioral abnormality was not observed when stimuli were delivered to the intact side (Fig. 9C). In control (unablated) animals, misdirected escapes were seen in less than 2% of trials (7 out of 436) (data not shown).
Two of the four ablated animals survived 7 d.p.a. In these animals, the effectiveness of stimuli delivered to the ablated side had improved significantly so that all stimuli evoked either short- or long-latency escape responses accompanied by their characteristic field potential signals (Fig. 8D, Fig. 9B). Furthermore, the animals were more likely to turn in the correct direction at 7 d.p.a. than at 3 d.p.a. The percentage of improperly executed escapes declined to 18% (Fig. 9C).
DISCUSSION
Field potential signals monitor activity of distinct neural circuits controlling short- and long-latency escape behavior in freely behaving zebrafish
We have shown that electric field potentials generated by zebrafish during short- and long-latency escapes can be readily detected in high resistance (15 MΩ) water using dipole electrodes immersed in the bath. This approach makes it feasible to monitor activation of the distinct neural circuits that underlie these behaviors in completely unfettered animals (Eaton and Farley, 1975; Eaton et al., 1977a; Prugh et al., 1982). In contrast, animals must be restrained to study circuit activation optically using Ca2+-sensitive dyes or proteins (Fetcho and Higashijima, 2004; Arrenberg et al., 2009; Wyart et al., 2009). We found that short-latency, C-start escapes required activation of the Mauthner cell and were accompanied by stereotyped large, phasic field potentials. In contrast, long-latency escapes were independent of the Mauthner cell and were associated with more variable, smaller amplitude field potentials. The field potential signals measured in our experiments originate primarily from muscle, although an initial, small, curare-resistant component associated with C-start escapes is likely to correspond to the Mauthner cell action potential. We were able to record this small neurogenic spike because the chamber was filled with distilled water, thereby reducing the dissipation of the electric field and enhancing the signal-to-noise ratio.
The field potential signals associated with short- and long-latency behavioral responses are quantitatively distinct and highly reproducible. These signals can be measured repeatedly within a single experimental session or in the same animal at different developmental times (supplementary material Fig. S2). Therefore, this approach is advantageous for studying changes in sensory sensitivity, short-term plasticity, long-term memory and remodeling of the underlying neural circuitry during behavioral adaptation in response to experimental perturbations.
The amplitude and time course of field potential signals associated with short- and long-latency escapes differed significantly. This reflects differences in the neural circuits that control these behaviors. During short-latency escapes, the Mauthner cell directly activates large, contralateral primary motor neurons that innervate fast twitch muscles, which contract rapidly and nearly synchronously (McLean et al., 2008). Field potentials generated by individual muscle fibers sum to generate the large, phasic signal measured in our experiments. In contrast, during Mauthner-independent, long-latency escapes, sensory neurons recruit different classes of premotor excitatory interneurons depending on stimulus strength (McLean et al., 2008). Activation of the multi-synaptic and variable circuits that underlie long-latency escapes results in asynchronous activation of muscle fibers, which generates the heterogeneous field potential signals measured in our experiments.
Previously, phasic field potentials have been recorded from zebrafish embedded in gelatin or confined to a drop of saline too small to accommodate the entire escape response (Eaton and Farley, 1975; Eaton et al., 1977b; Prugh et al., 1982). Although these signals were attributed to Mauthner cell activity, they strongly resemble the large, phasic, myogenic potentials associated with C-start escapes recorded in our experiments. In some cases, a smaller initial potential, similar to the curare-resistant component that we report, was detected [e.g. fig. 2 in Eaton and Farley (Eaton and Farley, 1975)].
The parameter values of the short- and long-latency behavioral responses measured in our experiments are in good agreement with those reported by Burgess and Granato (Burgess and Granato, 2007). Furthermore, Burgess and Granato found that short-latency responses require Mauthner cell activation, a conclusion strongly supported by our results (Fig. 7). In contrast, Liu and Fetcho reported that after Mauthner cell ablation, MiD2cm and MiD3cm, Mauthner cell homologs found in segments 5 and 6, could mediate rapid escape behavior evoked by head-directed stimuli (Liu and Fetcho, 1999). This apparent discrepancy has not been resolved.
Reorganization of escape circuitry restores behavior following trigeminal ablation
Unilateral ablation of trigeminal sensory neurons significantly reduced behavioral responses and electric field potentials evoked by ipsilateral, head-directed stimuli. Residual responsiveness could result from ineffective ablation of some trigeminal neurons or activation of spinal cord Rohon–Beard or dorsal root ganglion sensory neurons with receptive fields that partially overlap those of trigeminal neurons in the caudal region of the head.
Interestingly, sensory responsiveness increased with time after trigeminal ablation with a significantly increased incidence of misdirected escapes by day 3 post-ablation, in which the animal turned toward the stimulus rather than away (Sagasti et al., 2005). These results indicate that the ablated side was partially reinnervated, with at least some contralateral sensory axons inappropriately crossing the midline (Sagasti et al., 2005). Contralateral trigeminal axons are capable of crossing the midline to reinnervate denervated territory, particularly if ablations are performed at 30 h.p.f. (Sagasti et al., 2005; O'Brien et al., 2009). Although the ability of contralateral neurons to cross the midline declines significantly if ablations are performed later in development, some capacity for crossing over remains at 3 d.p.f. (O'Brien et al., 2009). Furthermore, a later-developing population of trigeminal neurons may be able to cross the midline from the intact side to innervate the ablated side after 3 d.p.f. (Caron et al., 2008). In contrast, contralateral neurons cannot account for the increase in sensory sensitivity that underlies escapes in the correct direction at 7 d.p.a. This increase in appropriate, ipsilateral innervation may be due to a later-arising population of trigeminal neurons that do not express the GFP transgene in the transgenic line used in our experiments (Caron et al., 2008). In addition, spinal cord sensory neurons may expand their receptive fields into the denervated territory. Regardless of the identity of the neurons responsible for partial reinnervation, some of the inappropriate synaptic connections from contralateral neurons appear to be pruned between 3 and 7 d.p.a., restoring proper execution of the escape behavior.
Field potential measurements may be useful for assessing neural circuit function during more complicated behaviors and for characterizing behavioral mutants
Our approach for recording electric field potentials in freely behaving zebrafish has great promise for studying the activation patterns of distinct escape circuits during more complicated behaviors that arise later in development such as predator–prey interactions and social communication between conspecifics. Interestingly, evidence has been presented that the Mauthner cell is activated during predator–prey interactions (Canfield, 2007). This predicts that large, phasic field potentials will be generated during predatory behavior. A strong precedent for using field potential measurements to study social behavior is provided by previous work, in which aquarium field potentials were recorded from crayfish during the establishment of a dominance hierarchy between two individuals (Herberholz et al., 2001). Bath electrodes measured the sum of the field potentials produced by the two animals. Concurrently, the behavior was captured by high-speed videography. By comparing the time courses of the field potential signal and the behavior, different components of the potential signal could be attributed to an individual animal. From this, it was possible to determine which of four neural circuits was activated during the behavior.
One significant advantage of zebrafish compared with other vertebrate model systems is the feasibility of genome-wide genetic screening (Gerlai, 2010). Ingenious methods for identifying behavioral mutants in high-throughput screens have been devised (Burgess and Granato, 2007; Wyart et al., 2009). Because field potentials are easy to record and analyze, they could serve as an extremely useful second-pass screening tool for characterizing putative behavioral mutants. For instance, this approach could be used to identify mutations that specifically affect one of the distinct neural circuits that control short- and long-latency escape behaviors.
CONCLUSIONS
Recording electric field potentials generated during escape behavior is a simple and robust technique for monitoring the activation and function of neural circuits in zebrafish. Circuit activity and plasticity can be tracked with minimal impact on natural behavior. Individual animals can be tested repeatedly to address behavioral, developmental and regenerative questions related to the function of the Mauthner and non-Mauthner escape circuits. Future applications of this approach include studies of learning and memory, analysis of neural circuit function during more complicated behaviors and characterization of putative behavioral mutants identified in high-throughput genetic screens.
Supplementary Material
Acknowledgments
We are grateful to members of the Papazian laboratory for their comments on the manuscript. We thank Dr Franklin Krasne (UCLA) for providing the differential amplifier.
Supplementary material available online at http://jeb.biologists.org/cgi/content/full/214/6/1028/DC1
Supported by NIH grant NS058500 to D.M.P. Deposited in PMC for release after 12 months.
REFERENCES
- Abraham E., Palevitch O., Gothilf Y., Zohar Y. (2009). The zebrafish as a model system for forebrain GnRH neuronal development. Gen. Comp. Endocrinol. 164, 151-160 [DOI] [PubMed] [Google Scholar]
- Arrenberg A. B., Del Bene F., Baier H. (2009). Optical control of zebrafish behavior with halorhodopsin. Proc. Natl. Acad. Sci. USA 106, 17968-17973 [DOI] [PMC free article] [PubMed] [Google Scholar]
- Blader P., Strähle U. (2000). Zebrafish developmental genetics and central nervous system development. Hum. Mol. Genet. 9, 954-951 [DOI] [PubMed] [Google Scholar]
- Brustein E., Marandi N., Kovalchuk Y., Drapeau P., Konnerth A. (2003). “In vivo” monitoring of neuronal network activity in zebrafish by two-photon Ca2+ imaging. Pflügers Arch. 446, 766-773 [DOI] [PubMed] [Google Scholar]
- Burgess H. A., Granato M. (2007). Sensorimotor gating in larval zebrafish. J. Neurosci. 27, 4984-4994 [DOI] [PMC free article] [PubMed] [Google Scholar]
- Canfield J. (2007). Some voluntary C-bends may be Mauthner neuron initiated. J. Comp. Physiol. 193, 1055-1064 [DOI] [PubMed] [Google Scholar]
- Caron S. J., Prober D., Choy M., Schier A. F. (2008). In vivo birthdating by BAPTISM reveals that trigeminal sensory neuron diversity depends on early neurogenesis. Development 135, 3259-3269 [DOI] [PMC free article] [PubMed] [Google Scholar]
- Didomenico R., Nissanov J., Eaton R. C. (1988). Lateralization and adaptation of a continuously variable behavior following lesions of a reticulospinal command neuron. Brain Res. 473, 15-28 [DOI] [PubMed] [Google Scholar]
- Drapeau P., Ali D. W., Buss R. R., Saint-Amant L. (1999). In vivo recording from identifiable neurons of the locomotor network in the developing zebrafish. J. Neurosci. Methods 88, 1-13 [DOI] [PubMed] [Google Scholar]
- Eaton R. C., Farley R. D. (1975). Mauthner neuron field potential in newly hatched larvae of the zebra fish. J. Neurophysiol. 38, 502-512 [DOI] [PubMed] [Google Scholar]
- Eaton R. C., Bombardieri R. A., Meyer D. L. (1977a). Mauthner-initiated startle response in teleost fish. J. Exp. Biol. 66, 65-81 [DOI] [PubMed] [Google Scholar]
- Eaton R. C., Farley R. D., Kimmel C. B., Schabtach E. (1977b). Functional development in Mauthner cell system of embryos and larvae of zebra fish. J. Neurobiol. 8, 151-172 [DOI] [PubMed] [Google Scholar]
- Eaton R. C., Lee R. K. K., Foreman M. B. (2001). The Mauthner cell and other identified neurons of the brainstem escape network of fish. Prog. Neurobiol. 63, 467-485 [DOI] [PubMed] [Google Scholar]
- Faber D. S., Fetcho J. R., Korn H. (1989). Neuronal networks underlying the escape response in goldfish-general implications for motor control. Ann. N. Y. Acad. Sci. 563, 11-33 [DOI] [PubMed] [Google Scholar]
- Fetcho J. R. (2007). The utility of zebrafish for studies of the comparative biology of motor systems. J. Exp. Zool. B Mol. Dev. Evol. 308, 550-562 [DOI] [PubMed] [Google Scholar]
- Fetcho J. R., Higashijima S. (2004). Optical and genetic approaches toward understanding neuronal circuits in zebrafish. Integr. Comp. Biol. 44, 57-70 [DOI] [PubMed] [Google Scholar]
- Fetcho J. R., O’Malley D. M. (1997). Imaging neuronal networks in behaving animals. Curr. Opin. Neurobiol. 7, 832-838 [DOI] [PubMed] [Google Scholar]
- Fetcho J. R., Cox K. J. A., O’Malley D. M. (1997). Imaging neural activity with single cell resolution in an intact, behaving vertebrate. Biol. Bull. 192, 150-153 [DOI] [PubMed] [Google Scholar]
- Gerlai R. (2010). High-throughput behavioral screens: the first step towards finding genes involved in vertebrate brain function using zebrafish. Molecules 15, 2609-2622 [DOI] [PMC free article] [PubMed] [Google Scholar]
- Grantyn A., Hardy O., Gourdon A. (1992). Relationships between task-related discharge patterns and axonal morphology of brainstem projection neurons involved in orienting eye and head movements. In Vestibular and Brain Stem Control of Eye, Head and Body Movements (ed. Shimazu H., Shinoda Y.), pp. 255-273 Tokyo: Karger; [Google Scholar]
- Hatta K., Kimmel C. B. (1993). Midline structures and central nervous system coordinates in zebrafish. Perspect. Dev. Neurobiol. 1, 257-268 [PubMed] [Google Scholar]
- Herberholz J., Issa F. A., Edwards D. H. (2001). Patterns of neural circuit activation and behavior during dominance hierarchy formation in freely behaving crayfish. J. Neurosci. 21, 2759-2767 [DOI] [PMC free article] [PubMed] [Google Scholar]
- Higashijima S., Masino M. A., Mandel G., Fetcho J. R. (2003). Imaging neuronal activity during zebrafish behavior with a genetically encoded calcium indicator. J. Neurophysiol. 90, 3986-3997 [DOI] [PubMed] [Google Scholar]
- Kimmel C. B., Westerfield M. (1990). Primary neurons of the zebrafish. In Signals and Senses (ed. Wiederhold M.), pp. 561-588 New York: Wiley Liss; [Google Scholar]
- Kimmel C. B., Patterson J., Kimmel R. O. (1974). The development and behavioral characteristics of the startle response in the zebra fish. Dev. Psychobiol. 7, 47-60 [DOI] [PubMed] [Google Scholar]
- Kohashi T., Oda Y. (2008). Initiation of Mauthner- or non-Mauthner-mediated fast escape evoked by different modes of sensory input. J. Neurosci. 28, 10641-10653 [DOI] [PMC free article] [PubMed] [Google Scholar]
- Liu K. S., Fetcho J. R. (1999). Laser ablations reveal functional relationships of segmental hindbrain neurons in zebrafish. Neuron 23, 325-335 [DOI] [PubMed] [Google Scholar]
- McDearmid J. R., Drapeau P. (2006). Rhythmic motor activity evoked by NMDA in the spinal zebrafish larva. J. Neurophysiol. 95, 401-417 [DOI] [PubMed] [Google Scholar]
- McLean D. L., Masino M. A., Koh I. Y. Y., Lindquist W. B., Fetcho J. F. (2008). Continuous shifts in the active set of spinal interneurons during changes in locomotor speed. Nat. Neurosci. 11, 1419-1429 [DOI] [PMC free article] [PubMed] [Google Scholar]
- Mione M., Baldessari D., Deflorian G., Nappo G., Santoriello C. (2008). How neuronal migration contributes to the morphogenesis of the CNS: insights from the zebrafish. Dev. Neurosci. 30, 65-81 [DOI] [PubMed] [Google Scholar]
- O’Brien G. S., Rieger S., Martin S. M., Cavanaugh A. M., Portera-Cailliau C., Sagasti A. (2009). Two-photon axotomy and time-lapse confocal imaging in live zebrafish embryos. J. Vis. Exp. 24, 1129 [DOI] [PMC free article] [PubMed] [Google Scholar]
- O’Malley D. M., Kao Y.-H., Fetcho J. F. (1996). Imaging the functional organization of zebrafish hindbrain segments during escape behaviors. Neuron 17, 1145-1155 [DOI] [PubMed] [Google Scholar]
- Peterson B. W. (1984). The reticulospinal system and its role in the control of movement. In Brain Stem Control of Spinal Cord Function (ed. Barnes C. D.), pp. 27-86 New York: Academic Press; [Google Scholar]
- Petreanu L., Huber D., Sobczyk A., Svoboda K. (2007). Channelrhodopsin-2-assisted circuit mapping of long-range callosal projections. Nat. Neurosci. 10, 663-668 [DOI] [PubMed] [Google Scholar]
- Pittman A. J., Law M. Y., Chien C. B. (2008). Pathfinding in a large vertebrate axon tract: Isotypic interactions guide retinotectal axons at multiple choice points. Development 135, 2865-2871 [DOI] [PMC free article] [PubMed] [Google Scholar]
- Prugh J. I., Kimmel C. B., Metcalfe W. K. (1982). Noninvasive recording of the Mauthner neurone action potential in larval zebrafish. J. Exp. Biol. 101, 83-92 [DOI] [PubMed] [Google Scholar]
- Sagasti A., Guido M. R., Raible D. W., Schier A. F. (2005). Repulsive interactions shape the morphologies and functional arrangement of zebrafish peripheral sensory arbors. Curr. Biol. 15, 804-814 [DOI] [PubMed] [Google Scholar]
- Saint-Amant L., Drapeau P. (1998a). Motoneuron activity patterns during spontaneous locomotor behavior of the zebrafish embryo. Soc. Neurosci. Abstr. 24, 1667 [DOI] [PMC free article] [PubMed] [Google Scholar]
- Saint-Amant L., Drapeau P. (1998b). Time course of the development of motor behaviors in the zebrafish embryo. J. Neurobiol. 37, 622-632 [DOI] [PubMed] [Google Scholar]
- Tanimoto M., Ota Y., Horikawa K., Oda Y. (2009). Auditory input to CNS is acquired coincidentally with development of inner ear after formation of functional afferent pathway in zebrafish. J. Neurosci. 29, 2762-2767 [DOI] [PMC free article] [PubMed] [Google Scholar]
- Wyart C., Del Bene F., Warp E., Scott E. K., Trauner D., Baier H., Isacoff E. Y. (2009). Optogenetic dissection of a behavioural module in the vertebrate spinal cord. Nature 461, 407-410 [DOI] [PMC free article] [PubMed] [Google Scholar]
- Yaksi E., von Saint Paul F., Niessing J., Bundschuh S. T., Friedrich R. W. (2009). Transformation of odor representations in target areas of the olfactory bulb. Nat. Neurosci. 12, 474-482 [DOI] [PubMed] [Google Scholar]
- Zottoli S. J. (1977). Correlation of startle reflex and Mauthner cell auditory responses in unrestrained goldfish. J. Exp. Biol. 66, 243-254 [DOI] [PubMed] [Google Scholar]
- Zottoli S. J., Faber D. S. (2000). The Mauthner cell: what has it taught us? Neuroscientist 6, 26-38 [Google Scholar]
- Zottoli S. J., Bentley A. P., Prendergast B. J., Rieff H. I. (1995). Comparative studies on the Mauthner cell of teleost fish in relation to sensory input. Brain Behav. Evol. 46, 151-164 [DOI] [PubMed] [Google Scholar]
Associated Data
This section collects any data citations, data availability statements, or supplementary materials included in this article.