Abstract
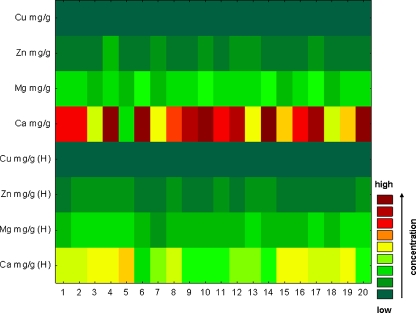
The study was aimed to evaluate the influence of the vascular disease, atherosclerotic obliterans (AO), on the location and concentration of elements in the arterial wall and serum. Use of a modern method for studying element’s concentration and distribution in samples of clinical material, i.e. laser ablation inductively coupled plasma mass spectrometry, is presented. Elements are not equally distributed between the inner (intima) and the outer (media + adventitia) layer of the arterial wall. Among the studied elements, calcium was found to have an unquestionable role in the calcification of the wall. Increased concentration of calcium found in the inner part of the atherosclerotic arterial wall and in the plaque, as compared to the control arterial wall samples, demonstrates the unquestionable role of this element in the calcification of the wall observed in AO. Applied chemometric methods were useful for demonstrating the differences in the element’s concentration in blood serum and the arterial wall samples between AO and the control group.
Figure.
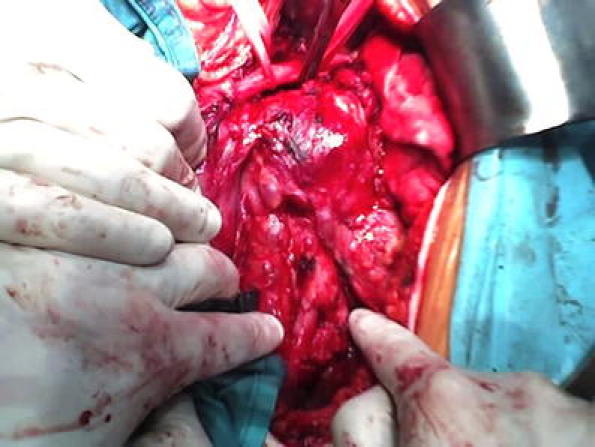
Image of the ruptured atherosclerotic plaque done while surgery
Keywords: Trace element detection, ICP-OES, LA-ICP-MS, Chemometric methods, Clinical samples, Atherosclerosis obliterans (AO)
Introduction
Elements are fundamental components of living and non-living matter, and a lot of them are essential for the functioning of the human body. From the physiological point of view, we can distinguish two groups: elements essential for metabolic and life processes, such as Ca, Cr, Cu, Mn, Mg and Zn, and the second group comprising non-essential elements which are toxic and harmful to humans, for example Al, As, Cd, Pb and Tl.
Among essential trace elements, Cu and Zn play a particular role in biological systems. Disturbances of the trace elements balance in the human body creates possible risks of cardiovascular diseases [1, 2]. Ions of copper and zinc bound to the active site of some metaloenzymes enable their catalytic function in the reactions of oxidation, reduction and hydroxylation of substrate and stabilise the structure of enzymatic protein. The relationship between Cu and Zn concentrations as well as metalloproteins responsible for their metabolism and transport in blood is well recognised. However, in tissues, and the arterial wall especially, it remains still under consideration. In vascular diseases accompanied by inflammation, a disorder in some element concentration was observed in blood serum and the vascular wall. Increased concentration of Cu was observed in serum and the arterial wall of patients with critical ischaemia of lower limbs due to atherosclerosis, mainly because of an increase in oxidase activity and concentration of ceruloplasmin, the main Cu-binding metalloprotein in blood plasma [3]. Zinc ions are bound to the active site of all matrix metalloproteinases, and their level in the vascular wall, both arterial and venous, may be affected by the pathological processes activated by that group of enzymes. Macroelements Ca and Mg are of particular importance for the functioning of the human body as they are essential for the activity of a number of enzymes and metabolic processes that occur both in tissues and blood. Calcification of atherosclerotic plaque follows an increase in Ca salt contents in the arterial wall and is accompanied by an increase in other metal accumulation as a result of ion exchange.
The progress of science as well as the rapid development of analytical techniques allow for a comprehensive, precise and accurate analysis of biological materials of the element content. Depending on the goal of research, different analytical techniques for direct imaging of metals in biological samples such as tissues might be used. Among them, a few need to be mentioned: X-ray spectroscopic techniques for biological tissues [4], scanning electron microscopy with energy-dispersive X-ray analysis [5], X-ray photoelectron spectroscopy, proton-induced X-ray emission [6], X-ray fluorescence analysis using the Synchrotron Radiation Facility [7], laser ablation inductively coupled mass spectrometry (LA-ICP-MS) [8–10], matrix-assisted laser desorption/ionization mass spectrometry [11] and secondary ion MS (SIMS) [12, 13]. Depending on the analytical task, each imaging technique may offer different advantages and drawbacks. The main advantage of all mass spectrometric imaging techniques is that they give isotopic information. A comparison of analytical techniques for elemental imaging of biological sample was presented by Becker and Sabler [14]. SIMS and LA-ICP-MS are found to be the most common sensitive mass spectrometric techniques for imaging of metals on biological samples or on tissue sections. LA-ICP-MS allows for a direct analysis of solid samples using only a small amount of material, which is very important when it comes to biological research. LA-ICP-MS is suitable for the imaging of metals in the cross-section of soft and hard biological tissues [15]. The advantages of this technique are high sensitivity, accuracy and precision of the analytical data. However, the quantification of analytical data using LA-ICP-MS is difficult because adequate standard reference materials are not available. For LA-ICP-MS calibration, matrix-matched laboratory standards were prepared. In the last years, LA-ICP-MS has been established as a suitable technique for quantitative imaging of metals in biological tissues [16].
The aim of this research was to investigate the changes associated with atherosclerosis obliterans (AO) on the concentration, localization and place of accumulation of mineral components as well as trace elements in the arterial wall and blood serum using spectroscopic techniques and to estimate the relationship between elements using chemometric methods.
Experimental
Material and sample preparation
The arterial wall and blood samples were collected from patients with AO, subjects during autopsy (the arterial wall control group) and blood donors (blood control group). The AO group consisted of patients with lower limb ischemia due to atherosclerosis, aged 42–72 years, and admitted for vascular reconstruction to the Department of General and Vascular Surgery at the University of Medical Sciences in Poznań, Poland. All patients underwent arteriography of the lower limbs and ultrasound measurement of ankle pressure before surgery. Samples of the atherosclerotic aortic wall (200–800 mg) in the AO group were obtained during surgery (implantation of aorto-bifemoral prosthesis). Samples of the arterial wall from abdominal aorta without athermanous changes (200–1,000 mg) were taken from subjects aged 20–40 years whilst autopsy and treated as a control wall material. Blood samples were collected from the brachial vein in the AO group before surgery and in the group of blood donors in the fasting state. The blood control group consisted of healthy male volunteers, aged 20–40 years. All of them underwent routine medical examination before blood collection, and subjects with lipid disorders were excluded from the study. The total number of the arterial wall samples amount to 40, and the studied group consisted of 20 patients with AO and 20 control subjects. In the case of blood serum, the total number of samples amount to 116; this group consisted of 52 patients (AO group) and 64 healthy people (the control group). The Ethics Committee of the University of Medical Sciences in Poznań approved the present study. Serum samples for element determination were obtained after blood coagulation and centrifugation at 1,000×g for 3 min and stored in −20 °C until assay. Shortly before element determination, serum samples were diluted with redistilled water. The arterial wall samples were divided immediately after vascular surgery into two parts, one for element determination and the second one for laser ablation analysis. In some of the arterial wall samples, it was possible to separate the atherosclerotic plaque from the remaining tissue and the inner layer (intima) from the outer (media + adventitia). Both the arterial wall and atherosclerotic plaque samples were rinsed with redistilled water and frozen −20 °C until assay. Frozen samples of arterial wall and atherosclerotic plaque were analysed by LA-ICP-MS. This technique was used for the analysis of 20 samples of arterial wall (AO) and 12 samples of atherosclerotic plaque. Slices of the part of arterial wall were placed on glass slides. The size of each sample was about 5 × 5 mm. Each sample was analysed using the single-line scan method, every time in three different places on its surface. For element determination, defrosted samples were digested using a microwave-assisted method in closed Teflon vessels (Teflon Bola Sheets, Bohlender, Germany). Samples were decomposed according to the following procedure: 200–1,000 mg of wet samples was dried about 6 h in temperature equal to 50 °C until reaching constant weight. Dried material was accurately weighed and decomposed in the closed Teflon vessels with 2.0 mL of 60% (v/v) HNO3 (Suprapur, Merck, Germany). The heating programme was performed in operating the oven in two steps: the first at 20% of its power (140 W) for 1 min and second step followed by cooling which was run at 80% (560 W) for about 3 min. Blanks for control of the digestion process were prepared in a similar manner. After decomposition, the microwave vessel was cooled, the digest was transferred into a 10-mL volumetric flask and adjusted with Milli-Q water to the proper volume. Prepared samples were analysed by the ICP optical emission spectrometery (ICP-OES) technique. The limits of detection for elements determined by the ICP-OES method were the following: Ca 0.03 μg kg−1; Cu 1.2 μg kg−1; Mg 0.06 μg kg−1; Pb 1.5 μg kg−1; and Zn 0.4 μg kg−1.
Certified reference material trace elements serum–whole blood (Seronorm) was used for quality control.
Chemometric approach
Selected elements were determined in blood serum and the arterial wall samples by ICP-OES and ICP-MS. The obtained results were submitted to chemometric analysis. All data were introduced to the Statistica software (version 8.0) where they were processed statistically. To test the differences in an element’s concentration between the AO and healthy groups, both for blood serum samples and arterial wall samples, the following chemometric methods were used: principal component analysis (PCA) and discrete raw data plot. Missing data were observed only in few cases, and before the multidimensional analysis, they were substituted for the average value of the whole variable.
Apparatus and conditions
Quantitative analysis of blood serum samples as well as mineralised samples of the arterial wall and atherosclerotic plaque were carried out using a simultaneous spectrometer ICP-OES, model Vista-MPX, CCD Simultaneous (Varian Ltd., Australia). The sample introduction system consisted of quartz nebuliser, liberty axial model (Varian) and cyclonic spray chamber. The operating parameters and selected analytical lines are listed in Table 1. Calibrations curves were established using aqueous standards. The multi-element standards (Ca, Cu, Mg, Pb and Zn) were prepared from 1,000 mg L−1 (Merck) aqueous standards (0.1, 0.5, 1.0, 3.0, 5.0 mg L−1). All solutions were prepared in deionised water, distilled and passed through a Milli-Q water purification system from Millipore (USA). The blank and standards were prepared containing the same amount of dispersant. Both types of samples came from patients with atherosclerosis obliterans. At the same time, same type control samples were analysed.
Table 1.
Operating conditions for ICP-OES and LA-ICP-MS systems
| ICP-OES | |
| Instrument | Spectrometer, Varian ICP-OES, model Vista-MPX, CCD Simultaneous |
| RF power (W) | 1,050 |
| Plasma gas flow (L/min) | 15 |
| Auxiliary gas flow (L/min) | 1.5 |
| Nebuliser gas flow (L/min) | 0.9 |
| Nebuliser pump (rps) | 0.10 |
| Wavelength (nm) | 396.84 (Ca); 279.55 (Mg); 237.39 (Cu); 220.35 (Pb); 213.86 (Zn) |
| Laser ablation | |
| Laser ablation system | CETAC LSX-500, Nd:YAG |
| Wavelength (nm) | 266 |
| Pulse duration (ns) | 5 |
| Ablation frequency (Hz) | 10 |
| Spot size (μm) | 50 |
| Laser energy (mJ) | 4.8 |
| Scan rate (μm/s) | 25 |
| Scan method | Single-line scan |
| Samples | Arterial wall, atherosclerotic plaque |
| ICP-MS | |
| Instrument | PE Sciex ELAN 6100 DRC II |
| Nebuliser gas flow (L/min) | 0.8–0.9 |
| Auxiliary gas flow (L/min) | 0.8 |
| Plasma gas flow (L/min) | 15 |
| RF power (W) | 1,250 |
| Lens setting | Autolens calibrated |
| Detector mode | Dual (pulse counting and analogue mode) |
| Dwell time (ms) | 10 |
| Scan mode | Scanning |
| Measured mass | 13C, 42Ca, 26Mg, 68Zn, 208Pb |
| Internal standard | 13C |
The second part of experiments was carried out using a ICP-MS spectrometer model Elan DRC II, (Perkin-Elmer Sciex, Canada) equipped with an Nd:YAG laser ablation system (LSX-500, CETAC Technologies, Omaha, NE, USA) operating at a wavelength of 266 nm. Whilst tuning the ICP-MS, compromise conditions for maximum signal intensity of the analyte (24Mg+, 115In+, 238U+) and minimum ratio of oxide (140Ce16O+/140Ce < 3%) and doubly charged ions (128Ba2+/128Ba+ < 3%) were found. The optimization of the LA-ICP-MS conditions was performed by ablating a standard reference glass material (NIST SRM 610) to the obtained maximum signal intensity for 7Li+, 115In+ and 238U+ whilst keeping 232Th16O+/232Th+ < 0.2% and the ratio of 42Ca2+/42Ca+ < 0.5%. The operating conditions of ICP-OES and LA-ICP-MS are summarised in Table 1.
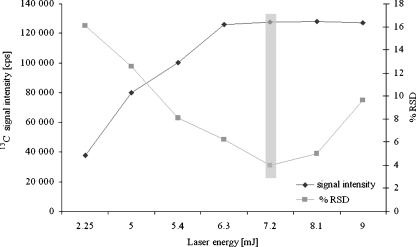
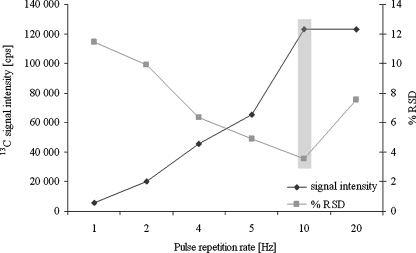
The sample behaviour under the influence of laser beam differs depending on the type of material which is being exposed to laser ablation. Therefore, a very important step is the selection of laser ablation certain parameters such as scanning method, scanning rate, laser energy level, repetition rate and spot diameter [17, 18]. The optimization of the laser parameters was carried out using a single variable method. The energy of laser performance was investigated in the range of 2.25–9 mJ, at the same time registering the intensity of the analytical signal of 13C as an internal standard (Fig. 1). Measurements were carried out for the spot sizes of 25, 50 and 100 μm. Laser ablation of the sample using 7.2 mJ proved to be the most optimal, and the precision of measurement calculated as %RSD was 4%. The pulse frequency was compared in the range of 1–20 Hz; the results of the dependence of the intensity of the analytical signal of carbon isotope on the chosen pulse frequency were shown in Fig. 2. The precision of measurement was also compared, indicated as %RSD, depending on the pulse frequency used. After evaluation, the single-line scan method was used. Additionally, the effect of the scan rate on ion signals was studied. The sample size limited to a scan rate of 25 μm s−1 was selected in this study.
Fig. 1.
Laser energy level dependence on the 13C ion signal. Spot size was set to 50 μm. Values are the mean of five measurements ± standard deviations
Fig. 2.
Pulse frequency level dependence on the 13C ion signal. Values are the mean of five measurements ± standard deviations
Results and discussion
Measurement of ICP-OES
The results of determinations of trace elements in blood serum and the arterial wall (Table 2) revealed differences between studied groups. The mean concentrations of Zn and Cu in serum are found higher in the AO than in the control group, whereas the concentration of Ca was lower in the AO than in the control group. Serum concentration of Mg in the AO group was not significantly different from the control group. Pb was detected in the blood serum and in the atherosclerotic plaque; however, its presence in the arterial wall and control samples was not registered. Similarly to blood serum, the results of determinations of trace elements in the arterial wall indicate differences in concentration between the AO and the control groups. Higher concentrations of Ca, Zn and Cu in the arterial wall of the AO patients were determined in comparison with the control sample. In some of the arterial wall samples in the AO group, it was possible to separate atherosclerotic plaques from the surrounding tissue. The mean concentration of the analysed elements was found significantly higher in the atherosclerotic plaque than in the surrounding tissue. The highest differences were found in the case of calcium and magnesium whose concentrations in the atherosclerotic plaque exceeded significantly their concentrations in the whole arterial wall samples.
Table 2.
Element’s concentration measured in the arterial wall, atherosclerotic plaque and blood serum of patients with AO and the control samples
| Samples | n | Concentration of elements (c ± U) | |||||
|---|---|---|---|---|---|---|---|
| Ca | Mg | Zn | Cu | Pb | |||
| Patients with AO | Arterial wall (mg/g) | 20 | 32.7 ± 1.1a,b | 0.840 ± 0.025a | 0.103 ± 0.003a,b | 0.00595 ± 0.00011a | n.d. |
| Atherosclerosis plaque (mg/g) | 12 | 151.1 ± 4.5 | 1.910 ± 0.057 | 0.162 ± 0.005 | 0.00811 ± 0.00021 | 0.0051 ± 0.0011 | |
| Blood serum (mg/L) | 52 | 84.6 ± 2.5c | 19.39 ± 0.58 | 1.201 ± 0.042c | 1.421 ± 0.042c | 0.0032 ± 0.0013 | |
| Control samples | Control samples of arterial wall (mg/g) | 20 | 6.1 ± 3.8 | 0.810 ± 0.024 | 0.081 ± 0.002 | 0.00379 ± 0.00112 | n.d. |
| Control samples of blood serum (mg/L) | 64 | 99.9 ± 3.1 | 21.09 ± 0.63 | 0.812 ± 0.023 | 1.023 ± 0.031 | n.d. | |
c ± U concentration ± uncertainty of measurement, n.d. not detected
aSignificant difference between AO wall and atherosclerosis plaque (p < 0.0001)
bSignificant difference between AO wall and control samples of arterial wall (p < 0.0001)
cSignificant difference between AO blood serum and control samples of blood serum (p < 0.0001)
Measurement of LA-ICP-MS
In order to compensate the signal fluctuation caused by the variation of the ablated sample mass, 13C was used as a natural internal standard. Carbon is the most abundant element in tissue samples and may be the most appropriate internal standard. Usage of the normalised signal improved the reproducibility, which caused the RSD to decrease from 13% to 5%. Many workers have utilised 13C in the analysis of tree rings, rice, livers and kidneys [19–21]. Such a method of compensation of the background is widely used in the method of LA-ICP-MS; in the undertaken analysis, the standard used most frequently is the natural internal standard [21, 22]. However, since the ionization of elements is strongly dependent on the matrix and rather difficult to calibrate, LA-ICP-MS was applied only as a qualitative method in the present study.
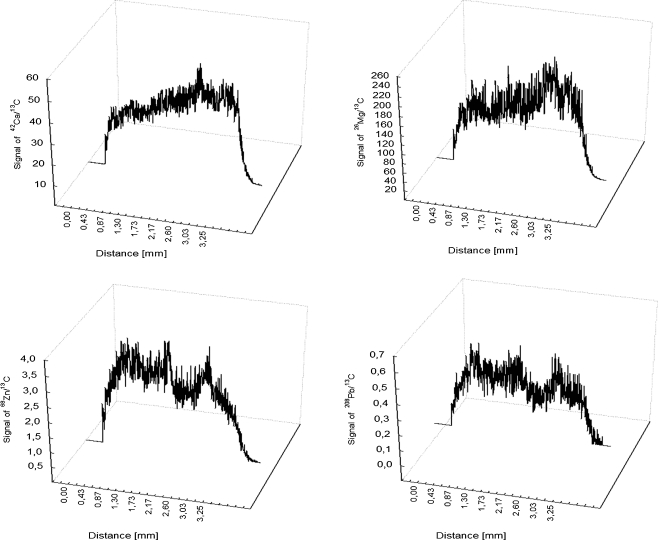
In order to find element distribution within the arterial wall of patient with atherosclerosis obliterans, a scan line on the surface by laser ablation technique was carried. The analysis was conducted on the surface of the inner layer (changed due to atherosclerosis) and the outer layer (without atherosclerotic changes) of the arterial wall. The imagined results of the analyses, which were representative of all analysed samples, were presented in Figs. 3 and 4. Figure 3 shows the distribution of chosen elements on the outer and inner sides of the abdominal arterial wall. Arteriosclerosis develops in the internal membrane, which is why the external side of arteries was analysed for comparison. In the arterial wall on the outer side, much lower intensities of calcium were registered in comparison with the inner side. Ca, which plays a significant role in pathogenesis of atherosclerosis, was registered about three times higher on the inner side than the outer side. For the other elements, also presented in Fig. 3, a different situation is observed. There are no significant differences in intensity on the outer and the inner sides of the arterial wall for both magnesium and zinc. This location of elements confirms their deposition in the arterial wall. Ca and Mg are deposited as non-organic salts. Calcified matters can be deposited in the human arterial wall mainly and comprise calcium phosphates salts, including calcium hydroxyapatite and magnesium carbonate [23–25].
Fig. 3.
LA-ICP-MS spectra showing Ca, Mg and Zn localizations in the arterial wall
Fig. 4.
LA-ICP-MS spectra showing Ca, Mg, Pb and Zn localizations in the atherosclerotic plaque
Trace elements were also determined in the atherosclerosis plaque separated from the arterial wall (Fig. 4). Also, here, the intensity of the signal, for Ca as well as for Mg, was about eight times higher than on the inner side of the arterial wall. In the process of biomineralization of the arterial wall and the atherosclerosis plaque, some trace elements also take part. Higher concentrations of Cu found in the atherosclerotic plaque in comparison with the arterial wall can be explained by the adsorption of Cu-containing proteins on the surface of phosphates. What can prevent the movement of Cu to the arterial wall? It was not at all possible to register the analytical signal of copper in the wall samples, probably because of the lower detection limits. Interestingly, a signal coming from Pb was registered in the atherosclerosis plaque sample. It can be assumed that in the deposits, i.e. atherosclerosis plaque, accumulation of elements not fulfilling any essential function, but toxic in the human body, is observed.
The study of the localization and accumulation of the essential macro- and microelements in tissues focuses attention on metal-related phenomenon taking place in the arterial wall, especially in atherosclerosis. There is a number of reactions taking place in the vascular wall and leading to pathological changes, for example peroxidation of lipids, accumulation of the products of this process in the arterial wall followed by lipid infiltration, formation of foam cells, atherosclerotic plaque, fibrosis and calcification. The formation of lipid deposits in the arterial wall is subject to calcification in the process of formation of sparingly soluble calcium and magnesium salts, mainly carbonaceous and oxalates. Ion exchange may result in the accumulation of other cations, among them cations of heavy metals which reach the vascular wall with blood, in calcified deposits in the atherosclerotic arterial wall.
Comparison of the concentration of trace elements of blood serum and arterial wall in the studied groups as well as in different parts of the arterial wall in the AO groups indicates the dislocation of those elements from serum to the wall and accumulation in its inner layer (intima) and atherosclerosis plaque in case of it forming [26].
Chemometric methods - Principal component analysis
PCA was used to explain information hidden in the investigated dataset. PCA enables specifying relations for variables as well as for cases. In our research, we focused on both variants, trying to group variables corresponding to elements and cases, which correspond to particular patients. Before the construction of two-dimensional plots, usefulness of the PCA was checked applying the Bartlett’s test of sphericity. Results of Bartlett’s test (levels of significance obtained for all elements in both blood serum and arterial wall samples significantly <0.05) proved the correctness of PCA usage.
Blood serum
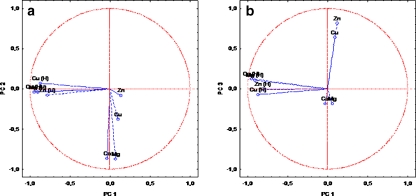
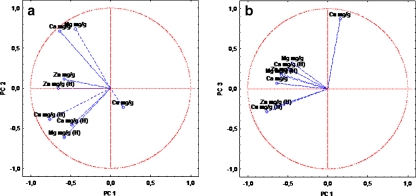
Analysis performed for variables distinguished three principal components with eigenvalues above unity (Table 3). All these three PCs explain 75.58% of total variance, which was enough to describe the investigated structure. The first principal component disclosed high loadings (above 0.7) for all elements in the group of healthy people; this PC explains almost 40% of the structure variability. This grouping suggests that results of element’s concentration in blood serum obtained for the control group are different from the group of AO patients (Fig. 5). The next PC explains 21.09% of the structure variability and contains calcium and magnesium determined in the AO group; however, the rest of the elements from the same group (zinc and copper) is explained in PC 3 (14.73% of total variance).
Table 3.
Results of PCA constructed for blood serum samples—factor loadings for three extracted factors (Ca: variable which includes data obtained from patients with AO; Ca (H): variable which includes data obtained from control group)
| Variable | Principal component | ||
|---|---|---|---|
| 1 | 2 | 3 | |
| Ca (mg/L) | −0.03 | −0.87 | −0.19 |
| Mg (mg/L) | 0.06 | −0.88 | −0.19 |
| Zn (mg/L) | 0.12 | −0.08 | 0.82 |
| Cu (mg/L) | 0.09 | −0.38 | 0.72 |
| Ca (H) (mg/L) | −0.95 | −0.04 | 0.13 |
| Mg (H) (mg/L) | −0.91 | −0.04 | 0.11 |
| Zn (H) (mg/L) | −0.81 | −0.07 | −0.01 |
| Cu (H) (mg/L) | −0.87 | 0.06 | −0.07 |
| Eigenvalues | 3.18 | 1.69 | 1.18 |
| % Total variance | 39.76 | 21.09 | 14.73 |
| % Cumulative variance | 39.76 | 60.85 | 75.58 |
Fig. 5.
Two-dimensional scatter plot constructed for blood serum’s data: PC1 vs. PC2 (a) and PC1 vs. PC3 (b)
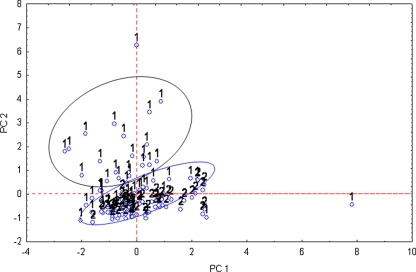
In the second variant, cases were grouped. PCA distinguished two principal components with cumulative variance amounting to 77.07%. These two PCs (PC1 = 44.38%, PC2 = 32.69%) are presented in Fig. 6. As can be observed in the biplot, two separate groups, differentiating groups of AO and healthy patients, were created. Particular patients, which belong to control group (number 2 in the biplot), create a quite tight (compact) group. It means that the concentrations of the given elements are rather comparable; however, in the case of the AO group, the results are divergent. That is why we observe a few digressed points (corresponding to the particular patient). Results obtained for the AO and healthy groups of patients are partly intermixed. Concentrations of the determined elements for AO patients in some cases are comparable with those obtained from healthy people. It may be concluded that in the case of some patients, analysis of only blood serum is not sufficient for recognition or exclusion of arteriosclerosis.
Fig. 6.
Biplot of elements in P1/P2 dimension constructed for blood serum data: 1 the AO group, 2 control group
Arterial wall
Principal component analysis executed for elements determined in arterial wall samples (variables) distinguished three principal components with significant statistical meaning. All of them had eigenvalues over unity and altogether accounted for almost 71% of the variability of the structure (Table 4). Two-dimensional scatter plots of three principal components are presented in Fig. 7. This percentage concerns only four from among eight variables. The first PC explains 31.34 of the total variance and contains only one variable, which is copper determined in the control group samples. However, the following two PCs provide information enclosed in the next 39.29% (the second PC contains calcium and magnesium and the third PC contains only copper, all elements determined in the AO group of patients).
Table 4.
Results of PCA constructed for arterial wall samples—factor loadings for three extracted factors (Ca: variable which includes data obtained from patients with AO; Ca (H): variable which includes data obtained from control group)
| Variable | Principal component | ||
|---|---|---|---|
| 1 | 2 | 3 | |
| Ca (mg/g) | −0.63 | 0.71 | 0.07 |
| Mg (mg/g) | −0.44 | 0.74 | 0.32 |
| Zn (mg/g) | −0.58 | 0.11 | 0.18 |
| Cu (mg/g) | 0.16 | −0.24 | 0.87 |
| Ca (H) (mg/g) | −0.48 | −0.46 | 0.24 |
| Mg (H) (mg/g) | −0.58 | −0.61 | 0.17 |
| Zn (H) (mg/g) | −0.65 | −0.00 | −0.23 |
| Cu (H) (mg/g) | −0.76 | −0.39 | −0.29 |
| Eigenvalues | 2.53 | 1.86 | 1.12 |
| % Total variance | 31.64 | 24.30 | 14.99 |
| % Cumulative variance | 31.64 | 55.94 | 70.93 |
Fig. 7.
Two-dimensional scatter plot constructed for artery wall’s data: PC1 vs. PC2 (a) and PC1 vs. PC3 (b)
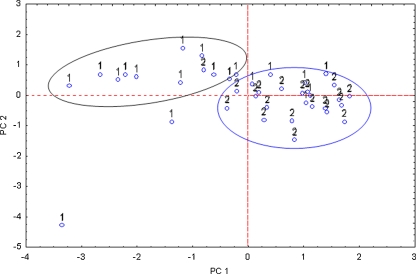
PCA analysis constructed for cases (Fig. 8) identifies two groups, likewise for blood serum samples, which in the majority contain either AO patients or healthy patients. Also, the arrangement of the points is similar compared to blood serum samples. In the case of AO patients (marked as 1), there exist more detached points than in the group of healthy people (marked as 2). Additionally, also two PCs are sufficient (above 72%) for the structure variability explanation. The first PC explained 50.62%, while the second one explained 21.77% of the data variation.
Fig. 8.
Biplot of elements in P1/P2 dimension constructed for arterial wall data: 1 the AO group, 2 group of healthy people
In conclusion, both for blood serum and the arterial wall samples, it was possible to distinguish two groups: one which consists of healthy subjects and is more compact than the other one, the AO group. It suggests similarity in elements’ concentrations among subjects in the control group. However, in the case of AO patients, the points are located in larger distances towards each other, which suggests differences in the concentration of the determined elements, probably caused by differences in atherosclerosis advancement among patients with AO.
Chemometric methods - Discrete raw data plot
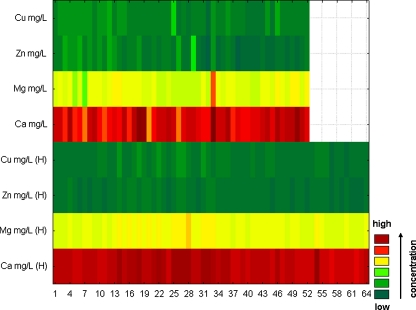
This sequential plot can be considered to be a two-dimensional projection of the three-dimensional Ribbons plot. Each data point in this plot is represented as a rectangular region, with different colours and/or patterns corresponding to the values. Values within each series are presented along the X-axis, with each series plotted along the Y-axis [27]. In our study, discrete raw data plots were used to visualise differences in elements’ concentrations between the control and AO groups, both for blood serum and arterial wall samples.
In order to display differences between healthy and AO group of patients with regard to elements’ concentrations, two discrete raw data plots (separately for blood serum samples and arterial wall samples) were constructed. Differences were additionally confirmed by executing an analysis of variance test (ANOVA). Application of ANOVA demonstrated a statistically significant difference in the concentration of zinc between control and AO group of patients (Table 5), whereas correlation matrix performed for blood serum samples indicates no statistically significant correlations (p < 0.05). In contrast, highly significant correlations were detected between zinc and calcium in this paper [28]. On the other hand, authors of the next article [29] claim that it is unclear whether calcium accumulation occurs concurrently with zinc, but the strength of the observed correlations supports this conclusion. It is not possible to ascertain whether calcium and zinc accumulation occurs independently of iron and copper or whether all of these metal ions accumulate concurrently. Little is known about the requirements and functions of zinc in maintaining the integrity of the vasculature and the vascular endothelium [29]. In the case of arterial wall samples, the authors obtained significant differences between the concentration of Ca in the control group and its concentration in AO, and also between the concentration of Ca in the control group and Mg in the AO group. The obtained levels of significance were 0.011 and 0.021, respectively. In the case of blood serum samples (Fig. 9), only the application of ANOVA demonstrated a statistically significant difference in the concentration of zinc between controls and AO group of patients. These results were contradicted by Alissa et al. [30]. In this research, zinc concentration in serum or plasma in people with established atherosclerosis obliterans indicates that low zinc levels are associated with increased disease [30]. Generally, it seems that the chosen elements are in the comparable concentration for both groups; so on the basis of blood serum sample analysis, it could be stated that these elements do not participate in atherosclerosis development. However, looking at the results of element concentrations in arterial wall samples (Fig. 10), significant differences between calcium may be noticed. Definitely, they differ about few levels of magnitude. It may be concluded that calcium is a significant element participating in the atherosclerosis development and that it cumulates in the intima where it can create lodgments and calcify the plaques, which may lead to clogging of the arteries. It was also demonstrated that analysing elements only in blood serum samples does not give precise information on the progress of calcification of the atherosclerotic wall and other element accumulation.
Table 5.
Analysis of variance for blood serum and arterial wall samples indicating differences with regard to concentration of elements
| Variate | Analysis of variance (p < 0.05) | ||
|---|---|---|---|
| F | p | ||
| Blood serum | Ca | 1.90 | 0.17 |
| Mg | 0.23 | 0.63 | |
| Zn | 13.37 | 0.00 | |
| Cu | 0.33 | 0.57 | |
| Arterial wall | Ca | 86.50 | 0.00 |
| Mg | 0.29 | 0.59 | |
| Zn | 1.06 | 0.31 | |
| Cu | 2.66 | 0.11 | |
Fig. 9.
Discrete raw data plot presenting concentration of elements determined in blood serum samples of patients with AO and control group. H variable which includes data obtained from the control group
Fig. 10.
Discrete raw data plot presenting concentration of elements determined in arterial wall samples of patients with AO and control group. H variable which includes data obtained from the control group
Conclusion and outlook
Atherosclerosis obliterans is a prolonged pathological process affects and probably is also related to changes in the concentrations of trace elements in blood serum and the arterial wall of lower limbs. Comparison of element’s concentrations in the arterial wall and serum between AO and the control group indicates differences in level and location of elements caused by disease or the tendency of changes in the location of elements. It may be concluded that elements are not homogeneously distributed in the arterial wall. Increased concentrations of calcium found in the inner part of the atherosclerotic arterial wall and in the plaque as compared to the control arterial wall samples demonstrate the unquestionable role of this element in the calcification of the wall, which leads to its hardening and loss of the elasticity observed in atherosclerosis obliterans. Therefore, mapping techniques such as LA-ICP-MS can be applied to identify the element’s distribution with high precision. Applied chemometric methods were found useful for demonstrating differences in element’s concentration in serum and the arterial wall.
Acknowledgments
Open Access
This article is distributed under the terms of the Creative Commons Attribution Noncommercial License which permits any noncommercial use, distribution, and reproduction in any medium, provided the original author(s) and source are credited.
Footnotes
Published in the special issue Focus on Analytical Science in Poland (VIIIth Polish Conference on Analytical Chemistry) with Guest Editor Pawel Koscielniak.
References
- 1.Report of World Health Organization (1972) Trace elements and cardiovascular disease, pp 51–59
- 2.Aalbers TG, Houtman JP. Sci Total Environ. 1985;43:255–283. doi: 10.1016/0048-9697(85)90133-0. [DOI] [PubMed] [Google Scholar]
- 3.Majewski W, Iskra M, Stanišić M, Łaciak M, Mackiewicz A, Staniszewski R. Int Angiol. 2007;26:341–345. [PubMed] [Google Scholar]
- 4.Bellis DJ, Li D, Chen Z, Gibson WM, Parsons PJ. J Anal At Spectrom. 2009;24:622. doi: 10.1039/b820067j. [DOI] [PMC free article] [PubMed] [Google Scholar]
- 5.Isaure MP, Fayard B, Saffet G, Pairis S, Bourguignon J. Spectrochim Acta B. 2006;61:1242. doi: 10.1016/j.sab.2006.10.009. [DOI] [Google Scholar]
- 6.Rajendran R, Minqin R, YNsa MD, Casadesus G, Smith MA, Perry G, Halliwell B, Watt F. Biochem Biophys Res Commun. 2009;382:91–95. doi: 10.1016/j.bbrc.2009.02.136. [DOI] [PubMed] [Google Scholar]
- 7.Isaure MP, Fraysse A, Deves G. Biochimie. 2006;88:1583. doi: 10.1016/j.biochi.2006.08.006. [DOI] [PubMed] [Google Scholar]
- 8.Günther D, Hattendorf B. TrAC Trends Anal Chem. 2005;24:255–265. doi: 10.1016/j.trac.2004.11.017. [DOI] [Google Scholar]
- 9.Becker JS, Zority M, Dressler VL, Wu B, Becker JS. Pure Appl Chem. 2008;80:2643–2655. doi: 10.1351/pac200880122643. [DOI] [Google Scholar]
- 10.Wu B, Chen Y, Becker JS. Anal Chim Acta. 2009;633:165–172. doi: 10.1016/j.aca.2008.11.052. [DOI] [PubMed] [Google Scholar]
- 11.Cornett DS, Frappier SL, Caprioli RM. Anal Chem. 2008;80:5648–5653. doi: 10.1021/ac800617s. [DOI] [PMC free article] [PubMed] [Google Scholar]
- 12.Lee TG, Parka JW, Shona HK, Moon DW, Choib WW, Lib K, Chung JH. Appl Surf Sci. 2008;255:1241. doi: 10.1016/j.apsusc.2008.05.156. [DOI] [Google Scholar]
- 13.Touboul D, Halgand F, Brunelle A, Kersting A, Tallarek E, Hagenhoff B, Laprevote O. Anal Chem. 2004;76:1550. doi: 10.1021/ac035243z. [DOI] [PubMed] [Google Scholar]
- 14.Becker JS, Salber D. Trends Anal Chem. 2010;29:966–979. doi: 10.1016/j.trac.2010.06.009. [DOI] [Google Scholar]
- 15.Becker JS, Matusch A, Palm C, Salber D, Morton KA, Becker JS. Metallomics. 2010;2:104–111. doi: 10.1039/b916722f. [DOI] [PubMed] [Google Scholar]
- 16.Dresslera VL, Pozebonb D, Meskoc MF, Matuschd A, Kumtabtime U, Wue B, Becker JS. Talanta. 2010;82:1770–1777. doi: 10.1016/j.talanta.2010.07.065. [DOI] [PubMed] [Google Scholar]
- 17.Niemax K. Fresenius J Anal Chem. 2001;370:332–340. doi: 10.1007/s002160100796. [DOI] [PubMed] [Google Scholar]
- 18.Hanć A, Barałkiewicz D, Piechalak A, Tomaszewska B, Wagner B, Bulska E. Intern J Environ Anal Chem. 2009;89:651–659. doi: 10.1080/03067310802559366. [DOI] [Google Scholar]
- 19.Watmough SA, Hutchison TC, Evans RD. J Environ Qual. 1998;27:1087–1094. doi: 10.2134/jeq1998.00472425002700050014x. [DOI] [Google Scholar]
- 20.Feldmann J, Kindness A, Ek P. J Anal At Spectrom. 2002;17:813–818. doi: 10.1039/b201960d. [DOI] [Google Scholar]
- 21.Baba K, Watanabae YE, Eun H, Ishizaka M. J Anal At Spectrom. 2003;18:1485–1488. doi: 10.1039/b310827a. [DOI] [Google Scholar]
- 22.Sekaran CN. Curr Sci. 2006;90:221–225. [Google Scholar]
- 23.Rokita E, Cichocki T, Heck D, Jarczyk L, Kunz J, Strzalkowski A. Trace Elem Med. 1989;6:158–164. [Google Scholar]
- 24.Tomazic BB, Brown WE, Scoen FJ. J Biomed Mater Res. 1994;28:35–47. doi: 10.1002/jbm.820280106. [DOI] [PubMed] [Google Scholar]
- 25.Higgins CL, Marvel SA, Morrisett JD. Arterioscler Thromb Vasc Biol. 2005;25:1567–1576. doi: 10.1161/01.ATV.0000172017.79441.73. [DOI] [PubMed] [Google Scholar]
- 26.Iskra M, Patelski J, Majewski W. J Trace Elem Med Biol. 1997;11:248–252. doi: 10.1016/S0946-672X(97)80020-X. [DOI] [PubMed] [Google Scholar]
- 27.Electronic Statistics Textbook (2010) Statsoft. http://www.statsoft.com/textbook/statistics-glossary/c/button/3/#Contour-Discrete%20Raw%20Data%20Plot
- 28.Cotton FA, Wilkinson G. Advanced inorganic chemistry. New York: Interscience; 1972. [Google Scholar]
- 29.Stadler N, Stanley N, Heeneman S, Vacata V, Daemen MJ, Bannon PG, Waltenberger J, Davies MJ. Arterioscler Thromb Vasc Biol. 2008;28:1024–1030. doi: 10.1161/ATVBAHA.108.162735. [DOI] [PubMed] [Google Scholar]
- 30.Alissa EM, Bahjri SM, Ahmed WH, Al-Ama N, Ferns GA. J Trace Elem Med Biol. 2006;20:105–114. doi: 10.1016/j.jtemb.2005.10.004. [DOI] [PubMed] [Google Scholar]


