Abstract
The murine γ-herpesvirus-68 (γHV68) establishes viral latency in dendritic cells (DCs). In the present study, we examined the specific consequences of DC infection by γHV68, both in vivo and in vitro. Ex vivo analysis of infected mice showed that the virus colonizes respiratory DCs very early after infection and that all subsets of splenic DCs analyzed are viral targets. We have developed and characterized an in vitro model of γHV68 infection of DCs. Using this model, we demonstrated that viral infection neither induces full DC maturation nor interferes with exogenous activation, which is assessed by cell surface phenotypic changes. However, whereas γHV68 infection alone failed to elicit cytokine secretion, IL-10 secretion of exogenously activated DCs was enhanced. Furthermore, γHV68-infected DCs efficiently stimulated virus-specific T cell hybridomas but failed to induce alloreactive stimulation of normal T cells. These data indicate that viral infection doesn’t interfere with Ag processing and presentation but does interfere with the ability of DCs to activate T cells. The inhibition of T cell activation was partially reversed by blocking IL-10. Analysis of infected mice shows elevated levels of IL-10 expression in DCs and that lack of endogenous IL-10 is associated with decreased γHV68 long-term latency. Taken together, these observations indicate that γ2-herpesvirus infection of DCs is a mechanism of viral immune evasion, partially mediated by IL-10.
Dendritic cells (DCs)3 play a central role in initiating and modulating immune responses to pathogens (1–6). Thus, many viruses have developed strategies for disrupting DC function (7, 8). This interference is possible at several levels of the DC induction of immunity: 1) maturation, viability, and migration of DCs; 2) Ag presentation; and 3) T cell activation and priming. A key question is whether interference with the initiation of immunity as a consequence of infection of DCs by chronic viruses constitutes a viral immune evasion mechanism.
γ-Herpesviruses are oncogenic viruses associated with numerous malignancies and have significant health implications, especially in immunocompromised individuals (e.g., posttransplant or AIDS patients). More than 90% of the Western population carries EBV and between 1 and 8% is infected with Kaposi’s sarcoma-associated herpesvirus (KSHV). However, both viruses are endemic in several African regions, where KSHV seroprevalence exceeds 60% (9). Kaposi’s sarcoma is the most common reported neoplasm in many African counties, partially due to the AIDS epidemic, and represents a largely unseen and unchallenged public health problem (9).
γ-Herpesvirus infections are characterized by the establishment of lifelong latency in the immunocompetent host. After an acute and generally asymptomatic infection, the infectious virus is cleared, and the virus persists in a latent state. Whereas the major reservoir of latent EBV, a γ1-herpesvirus, is the memory B cell, KSHV, a γ2-herpesvirus, targets a variety of cell types, including DCs (10–12). It has been reported that DCs derived from patients with Kaposi’s sarcoma are functionally impaired (13), but nothing is known about the specific consequences of DC infection by γ2-herpesviruses.
Characterization of a murine γ2-herpesvirus, MHV-68 or γHV68, has provided an important in vivo experimental model in which both the virus and the host can be manipulated. There are substantial genetic and biological similarities between γHV68 and KSHV (14–16). As with KSHV, γHV68 establishes latency in a broad range of cell types, including B cells, macrophages, epithelial cells, and, importantly, DCs (17–20). For example, we have shown that DCs are a major target of γHV68 latency in the spleen (17, 21) and that they are a long-term reservoir of persistent virus in a variety of anatomical sites (18). These data are consistent with the possibility that the virus exploits its ability to infect DCs as a mechanism for usurping DC function. In this report, we have characterized the in vivo viral reservoirs in splenic and lung DCs during acute infection and early latency and have developed an in vitro model of γHV68 infection of DCs to determine the impact of infection on DC function. Both the in vivo and in vitro data support the hypothesis that γ2-herpesvirus infection of DCs results in immune evasion.
Materials and Methods
Animal procedures and virus infection
γHV68, clone WUMS, was propagated and titered on monolayers of NIH-3T3 fibroblasts. C57BL/6J mice were purchased from Taconic Farms and housed under specific pathogen-free conditions in BL3 containment. IL-10-deficient mice (B6.129P2-IL-10tm1Cgn/J) and control mice (C57BL/6) were purchased from The Jackson Laboratory. The Institutional Animal Care and Use Committees at Trudeau Institute and at Columbus Children’s Research Institute approved all studies described here. Mice were anesthetized with 2,2,2-tribromoethanol and intranasally inoculated with 4 × 10² PFU of virus in PBS.
Viral assays
Plaque assay
To determine the titer of infectious virus, lungs obtained at various times after infection were stored frozen and mechanically homogenized. The cells were broken by three quick successive cycles of freeze-thawing. The lytic virus concentration of the lung homogenates or of DC culture supernatants was determined in a standard plaque assay on NIH-3T3 fibroblasts. The next day, the monolayers were overlaid with carboxy-methyl cellulose (Sigma-Aldrich). After 6 days of culture, plaques were quantitated after methanol fixation and Giemsa staining.
Infective center assay
Single-cell suspensions were obtained as described above. Duplicates of the cell sample were mechanically disrupted by a cycle of freeze-thaw. The intact (total infected cells) and disrupted (lytically infected cells) cell samples from each organ were plated in triplicate onto monolayers of NIH-3T3 cells in serial 10-fold dilutions in 12-well plates. The monolayers were overlaid, and the plaques were quantitated as described above. The number of latently infected cells was calculated as the difference between total and lytically infected cells.
Limiting dilution-nested PCR
The number of cells containing the γHV68 genome was determined by a combination of limiting dilution analysis (LDA) and nested PCR (18). The purified cells were serially diluted in uninfected NIH-3T3 fibroblasts in 96-well plates, lysed, and DNA amplified by nested PCR as previously described (18, 22) using primers specific for γHV68 ORF50. This procedure was able to consistently detect a single copy of the target sequence. Twelve replicates were assessed for each cell dilution, and linear regression analysis was performed to determine the reciprocal frequency (95% degree of confidence) of cells positive for γHV68 DNA. As controls of nested PCR, 104 NIH-3T3 cells/well with and without plasmid DNA containing the γHV68 ORF50 gene were included in each 96-well plate.
Cell purification and FACS analysis
Dendritic cells from spleen and lung were purified on a FACS Vantage SE/DIVA sorter (BD Biosciences) as described previously (18). Briefly, the cells were isolated after collagenase D (5 mg/ml; Roche) treatment for 45 min. Cells were next incubated with 5 mM PBS/EDTA for 10 min at room temperature to disrupt multicellular complexes. If needed, B and T cells were depleted using a mixture of anti-CD19 and anti-Thy-1.2 cell culture supernatants and magnetic beads (Dynal Biotech). The cells were Fc-blocked and stained with fluorochrome-conjugated Abs specific for CD11c, B220, CD8α, and CD4 or for CD11c, CD11b, CD5, and CD19.
FACS staining was performed on ~105 cells/sample with combinations of the following Abs: CD11c, CD80, CD86, F4/80, Kb, Db, CD54, I-Ab, and CD40. Samples were washed and resuspended in 1% paraformaldehyde diluted in PBS before analysis. Apoptosis analysis was performed using annexin V and propidium iodide. Flow cytometry data were acquired on a FACScan or FACSCalibur and analyzed using CellQuest (BD Pharmingen) and FlowJo (Tree Star).
Gardella gel electrophoresis
The resolution of episomal and linear γHV68 genomes in lung DCs purified as described above was done by Gardella gel analysis (23–25). The lysis and separating gels were prepared as described previously (24). Purified DCs were resuspended in loading buffer containing 20% Ficoll (Sigma-Aldrich) and 0.01% bromophenol blue and then loaded onto the gels. The sample was overlaid with lysis buffer containing 5% Ficoll, 1% SDS, and 1 mg/ml self-digested pronase (Calbiochem). The gels were run at 4°C at 40 V for 3 h and then at 160 V for 16 h. The gels were then sliced at 0.5-cm intervals, the agarose was digested, and the DNA was extracted using γ-agarase (Promega) and ethanol precipitation, following the manufacturer’s instructions. The presence of γHV68 DNA in the samples was determined by PCR in a 25-μl reaction containing primers (6.25 μM each) specific for γHV68 (5′-GATGGAAACAGAAAACGAGCCC-3′ and 5′-TCGCTTGTTTCTGGGGAGGTTT-3′; product 425 bp), 1 U of TaKaRa Ex Taq (Takara Biomedicals), 2.5 μl of 10× Ex Taq buffer (Takara Biomedicals), and 3 μl of dNTP mixture (Takara Biomedicals). Amplification was for 45 cycles (94°C, 60 s; 67°C, 60 s; 72°C, 30 s), followed by a 7-min extension at 72°C. The γHV68-containing B cell line S11, which has been shown to harbor both episomal and linear γHV68 DNA (19), and lytically infected NIH-3T3 fibroblasts were used as controls for the Gardella gel analysis.
Gene expression analysis
The γHV68 gene expression analysis on cultured DCs was performed as described previously (21). The size of the transcripts detected corresponded to the sizes previously determined for S11 cells, a γHV68-containing B cell line that has been shown to harbor both lytic and latent γHV68 DNA (19).
DC cultures
DCs were generated from bone marrow cultures in complete tumor medium supplemented with 20 ng/ml GM-CSF (PeproTech). On day 10, non-adherent cells were harvested, and DC purity was analyzed by FACS staining (CD11c+I-Ab+, >95%). Next, DCs were infected for 3 h with γHV68 multiplicity of infection (MOI) 1–10 at 37°C and cultured in complete tumor medium supplemented with 10 ng/ml GM-CSF.
Ag-processing assays
The T cell hybridoma Ag presentation assays were done as described previously (26). Control (noninfected and peptide-loaded) and infected DC cultures were used as APCs. Two-fold serial dilutions of the cells were prepared in 96-well flat-bottom plates, starting at 106 cells/well. Hybridoma cells (105/well) were then added to each well, and the plates were incubated for 20 h. The relative response of each hybridoma was measured with a standard IL-2 assay.
The T cell proliferation assays were done using a standard MLR. Briefly, 4 × 10⁵ irradiated DCs were mixed with 2 × 10⁵ allogeneic BALB/c T lymphocytes after enrichment by panning with rat anti-mouse IgG. All the reactions were conducted in triplicate in 96-well plates. After 72 h of incubation at 37°C, cultures were pulsed with 0.02 μCi/ml [3H]thymidine for 18 h, and incorporation into cellular DNA was subsequently determined. In some experiments, allogenic T cells were labeled with CFSE, and T cell proliferation was assessed on day 3 by CFSE dilution. Functional grade purified anti-mouse IL-10 Ab (clone JES5-2A5; eBioscience) was added at 10 μg/ml.
Detection of cytokines
For determination of cytokines, the supernatant of stimulated and control DC cultures was collected. Cytokine release (TNF-α, IL-1α, IL1β, IL-6, IL-12, and IL-10) was assayed using the Beadlyte Multiplex Cytokine Detection System (Upstate Biotechnology) as described by the manufacturer.
For real-time PCR analysis of IL-10, total RNA from FACS-purified DCs from spleens and lungs of infected (5 and 14 days postinfection (dpi)) and uninfected mice was isolated using RNAqueous-4PCR (Ambion), according to the manufacturer’s instructions. cDNA was synthesized using Cloned AMV RT kit (Invitrogen Life Technologies), and gene expression was measured using the 5′ nuclease TaqMan assay and ABI Prism 7700 sequence detection system (Applied Biosystems). Fold increase in signal relative to that of sorted-uninfected DCs was determined using the ΔΔCt calculations recommended by the ABI Prism 7700 manufacturer. The endogenous control used to normalize the sample specific message levels was GAPDH, for which levels of expression do not vary in response to infection and time points (data not shown). The primers and probe sequences for murine IL-10 were modified from Oberbergh et al. (27) and validated by Trudeau Institute Molecular Biology Facility, and the sequences are as follows: IL-10 forward primer, 5′-GAAGACCCTCAGGATGCGG-3′, reverse primer, 5′-ACCTGCTCCACTGCCTTGCT-3′, and IL-10 probe, 5′-TGAGGCGCTGTCATCGATTTCTCCC-3′.
Results
Viral latency is maintained in every subset of splenic DCs
Previous studies of γ2-herpesvirus latency have shown that a broad range of cell types become infected. KSHV has been shown to establish latency in vivo in B cells, monocytes/macrophages, DCs, and endothelial cells (10–12) and in vitro in cell lines of epithelial, endothelial, and mesenchymal origin (28). γHV68 latency has been reported in B cells, macrophages, DCs, and epithelial cells in the host (17–20). We have shown previously that respiratory and splenic DCs are an important reservoir of γHV68 during the establishment of the latency phase and that splenic DCs harbor virus during long-term latency (18). However, it is not known which specific DC subsets contribute to viral persistence.
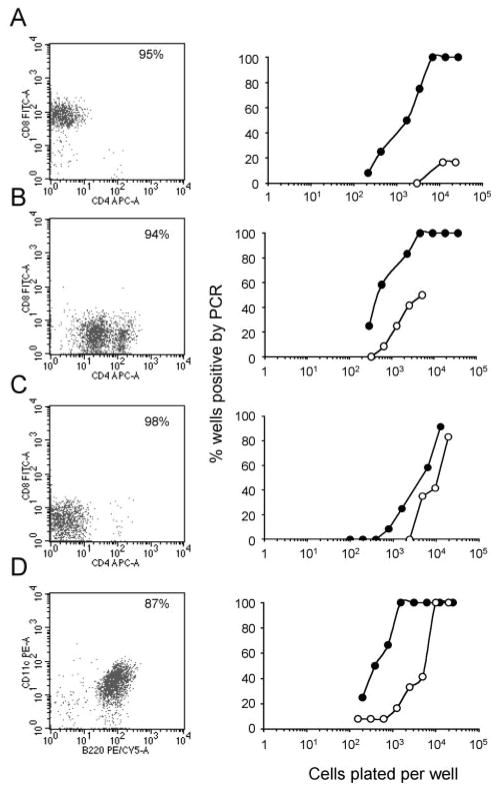
To identify which subsets of DCs harbor virus, splenic DCs were flow cytometrically sorted on the basis of surface expression of CD11c, CD8, CD4, and B220 (Fig. 1, left column) at the peak of latency establishment (14 days postinfection) and during long-term infection (3 mo postinfection). Four major DC subsets were analyzed, including 1) CD11c+CD8+CD4−, 2) CD11c+CD8−CD4+, 3) CD11c+CD8−CD4−, and 4) CD11c+B220+ cells. All subsets contained virally infected cells, and the frequency of infected cells consistently decreased from early to long-term latency (Fig. 1, right column). The data in Table I present a detailed analysis of the frequencies of infection and the total number of infected cells in each different DC subpopulation. The results show similar frequencies of infection at 14 days and more marked differences at 3 mo after infection. However, because of the low number of infected DCs during long-term latency, these differences probably lack functional significance. Taken together, these data indicate that the major subsets of DCs are latently and stably infected.
FIGURE 1.
γHV68 latency in different subsets of splenic DCs. The frequency of γHV68 genome-positive cells was determined by LDA-PCR assay in FACS-purified splenic DC subsets during the establishment of the latency phase of infection (14 days postinfection, ●) and long-term latency (3 mo postinfection, ○). CD11c+CD8+CD4− (A), CD11c+CD8−CD4+ (B), CD11c+ CD8−CD4− (C), and CD11c+B220+(D).
Table I.
γHV68 frequencies within splenic DC (CD11c+) subsets during the establishment and maintenance phases of latent infection
| Cells | Reciprocal Frequency of Genome-Positive Cellsa | % of Total Spleenb | Total No. of Cellsc | Latently Infected Cellsd | Ratioe |
|---|---|---|---|---|---|
| 14 days postinfection | |||||
| B220+ | 3,102 | 1.07 | 2.14 × 10⁶ | 690 | 0.117 |
| CD8+CD4− | 2,963 | 2.31 | 4.62 × 10⁶ | 1559 | 0.264 |
| CD8−CD4− | 4,769 | 4.7 | 9.4 × 10⁶ | 1971 | 0.334 |
| CD8−CD4+ | 1,212 | 1.01 | 2.02 × 10⁶ | 1667 | 0.283 |
| 3 mo postinfection | |||||
| B220+ | 7,328 | 0.48 | 2.88 × 10⁵ | 39 | 0.419 |
| CD8+CD4− | 74,336 | 1.23 | 7.38 × 10⁵ | 10 | 0.107 |
| CD8−CD4− | 21,037 | 1.11 | 6.66 × 10⁵ | 32 | 0.334 |
| CD8−CD4+ | 13,432 | 0.26 | 1.56 × 10⁵ | 12 | 0.129 |
Frequencies with 95% confidence limits were determined by linear regression analysis of LDA-PCR data. Data are the mean of three independent experiments, each analyzing pooled spleens from five to seven mice.
Percentage of each subset of total spleen DC was determined by FACS analysis.
Total number of each DC subset per spleen based on estimate of 2 × 10⁸ total cells/spleen at 14 days postinfection and 6 × 10⁷ cells/spleen at 3 mo postinfection.
Number of latently infected cells based on the frequency of viral genome-positive cells within each cell type and the estimated total number per spleen.
The subset:total ratio was determined by dividing the absolute number of infected cells in each DC subset by the total number of infected DC in the spleen at each given time point.
γHV68 infects respiratory DCs early after intranasal infection
Our recent observation that lung B cells are latently infected soon after intranasal inoculation (25) prompted us to ask how early lung DCs were infected during the acute respiratory infection. DCs were sorted on days 3, 7, and 11 after intranasal infection and subjected to LDA-PCR analysis to determine the frequency of cells harboring virus. As shown in Fig. 2A, the frequency of lung DCs harboring viral genome increased dramatically during the first week of infection, from a frequency of ~1 to 1100 on day 3 to ~1 to 14 on day 7. By day 11, the frequency had declined to 1 to 126. These data show that DCs are early targets of γHV68 during the acute phase of infection in the respiratory tract, which may have an impact on the initiation of the immune response in the host.
FIGURE 2.
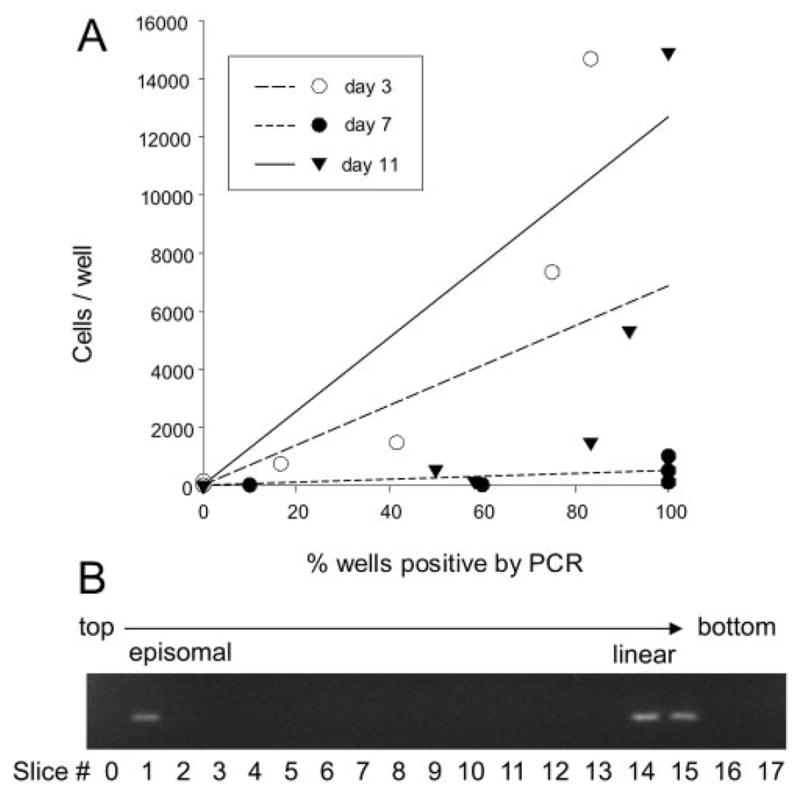
γHV68 establishes latency in lung DCs very early following respiratory infection. A, Representative graph of data obtained from LDA-PCR analysis of FACS-purified lung DCs (CD11c+CD11b+/− CD19−) harboring viral genome at the indicated times after infection. The proportion of wells positive by PCR is plotted against the number of cells per well. B, Lung DCs contain both latent (episomal) and lytic (linear) virus at day 3 after infection. Gardella gel analysis of DNA from FACS-sorted DCs from lungs 3 days after γHV68 infection. The gel picture shows PCR for viral DNA of sequential individual gel slices, starting from the top of the gel (left to right). The slower migrating episomal DNA indicates latent viral genome and the faster migrating linear DNA represents lytic viral genome, as confirmed by analysis of viral DNA isolated from S11 cells, a γHV68 latently infected B cell tumor line, which has been shown to contain both episomal and linear genomes (19, 25).
To determine whether the initial infection of lung DCs is lytic or latent, we assessed the conformational state of γHV68 DNA. It has been shown that latent γ-herpesvirus genomes are episomal (covalently closed circular), whereas replicating viral genomes are in linear conformation (23). Gardella gel analysis, which involves DNA electrophoresis after in situ lysis of cells, is able to distinguish linear DNA (lytic virus) from circular DNA (latent, episomal virus). To increase the sensitivity of the assay, the presence of viral DNA was determined by PCR. Thus, after electrophoresis, individual lines of the gel were sliced, and each was analyzed for the presence of viral DNA by PCR of the ORF50 gene. The data in Fig. 2B show the presence of DNA with migration properties of episomal DNA in lung DCs as early as day 3 after infection, which is consistent with early latent infection.
An in vitro model of γHV68 infection of DCs
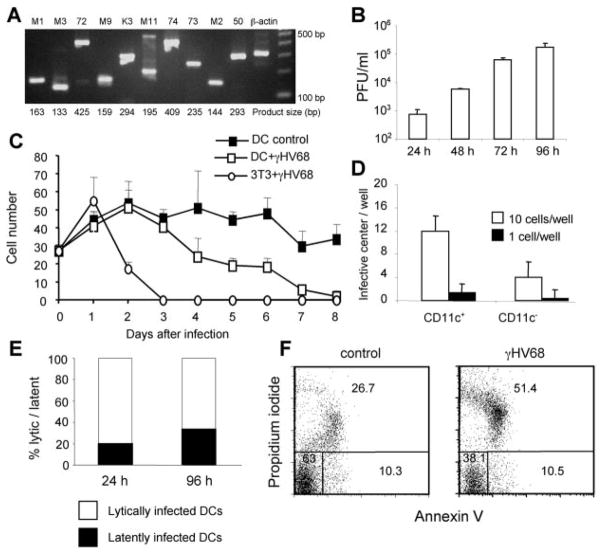
To further investigate the consequences of γHV68 infection of DCs, we established an in vitro infection model. Bone marrow-derived DCs were grown with murine rGM-CSF and infected with γHV68 on day 10. Analysis of viral gene expression in infected cultures using RT-PCR revealed that both viral lytic cycle and latency candidate genes were expressed 24 h after infection (Fig. 3A). To determine whether the infection was productive, we measured the amount of free virus in the DC culture supernatant at different times after infection using a standard plaque assay. The data show a progressive increase of free virus in the culture medium with time after infection, which is consistent with a productive infection (Fig. 3B). Analysis of the viability of the γHV68-infected DCs and 3T3 fibroblasts (Fig. 3C) showed that, in contrast to infected fibroblasts, which are rapidly killed, the infected DC cultures maintain viability up to 3 days after infection. To eliminate the possibility that the infectious virus measured in Fig. 3B was being produced by a minor non-DC population contaminating the cultures and that the DCs themselves were not infected, we directly measured viral infection of purified DCs. Cultured DCs were FACS sorted into CD11c+ and CD11c− cells 24 h after infection, and the frequency of infection of the purified cells was determined by an infective center assay. As shown in Fig. 3D, 100% of the DCs (CD11c+, 95% of the culture) were infected by γHV68, whereas only 50% of the non-DCs (CD11c−, 5% of the culture) scored positive for virus.
FIGURE 3.
Characterization of γHV68 infection of bone marrow-derived DC cultures. A, Analysis of viral gene expression 24 h after infection (MOI:2) by RT-PCR shows gene expression of γHV68-lytic and -latent cycle transcripts. B, Analysis of the production of progeny infectious virus in the supernatants of DC cultures at different times after infection. γHV68 titers were determined by plaque assay. C, Cell culture viability. Cell numbers were obtained by trypan blue exclusion at different times after infection. Virally infected 3T3 fibro-blasts are included for comparison. D, Analysis of the efficiency of DC infection. Dendritic (CD11c+) and nondendritic (CD11c−) cells were FACS purified after 24 h of infection, and serial 10-fold dilutions of the cells were plated in 12-well plates in an infective center assay. The figure shows the number of PFU obtained in the wells receiving 10 or 1 purified cells. E, Analysis of the contribution of lytically and latently infected cells to the total number of infected cells in culture at 24 and 96 h after infection. The number of infected cells was determined using an infective center assay. F, Analysis of cell death in DC cultures 96 h after infection using annexin V/propidium iodide. The cells were gated previously as CD11c+ DCs. The numbers show the percentage of viable (lower left quadrant), apoptotic (lower right quadrant), and necrotic (upper quadrant) DCs.
Next, we analyzed the contribution of lytic and latent γHV68 infection in the cultures using the standard infective center analysis. As shown in Fig. 3E, between 20 and 35% of the cultured cells are latently infected. We also studied the mechanism of cell death in the infected DC cultures (Fig. 3F). The data indicate that DC death occurs by necrotic lysis, which correlates with the percentage of lytically infected cells in culture. Taken together, our results confirm that this in vitro infection model with γHV68 offers an excellent tool to study the interaction between a γ2-herpesvirus and DCs.
γHV68 infection does not induce DC maturation
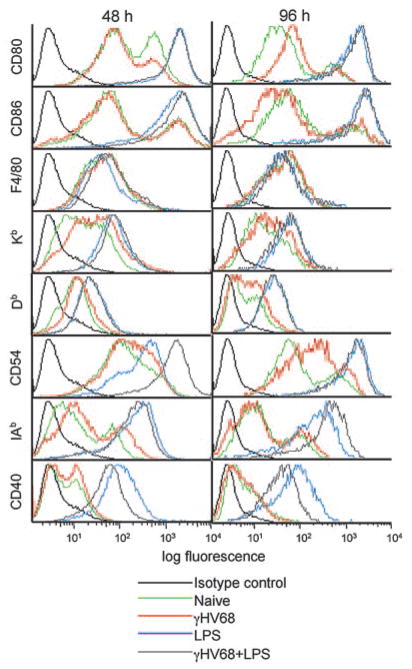
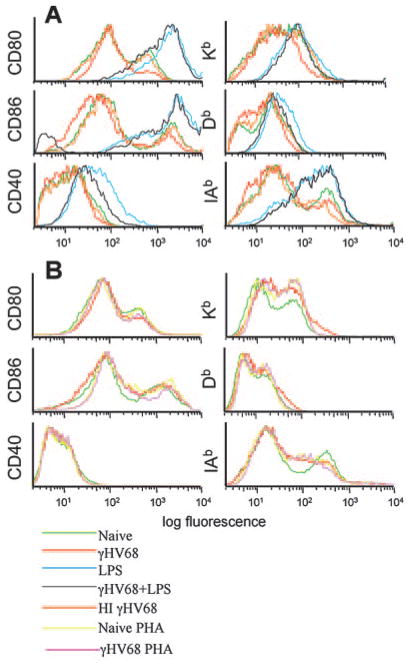
We next analyzed the phenotypic changes induced by γHV68 infection of DCs by FACS analysis 48 and 96 h after viral infection. γHV68 infection did not induce modulation of the surface expression of CD80, CD86, F4/80, Kb, Db, IAb, or CD40 (Fig. 4, green and red lines). The only phenotypic change observed was the up-regulation of CD54 (ICAM-1) by 96 h. CD54 is a ligand for the integrin αL chain, and it is involved in a variety of intercellular adhesions. Similar results were obtained with MOI from 1 to 10 at time points between 24 and 96 h after infection (data not shown). Thus, viral infection of DCs did not induce global cellular maturation or activation. To determine whether the failure of viral infection to induce cellular maturation or activation reflected a virus-induced impairment in the ability of the DCs to mature in response to other exogenous stimuli, we used two approaches. First, we analyzed phenotypic changes after LPS stimulation of infected and uninfected DCs. As shown in Fig. 4 (blue and gray lines), LPS induced the activation of the infected DCs to the same level as the uninfected cells. Second, to formally test the possibility that the lack of cell surface activation was due to shut off of the cellular machinery induced by ongoing viral replication and to determine whether this effect required viral gene expression, we repeated the phenotypic analysis using heat-inactivated virus or phosphonoacetic acid, an inhibitor of the viral polymerase (29). Similar to the results obtained with infectious virus, the addition of heat-inactivated γHV68 to DCs did not induce up-regulation of any of the markers analyzed (Fig. 5A, red and orange compared with green lines). Similarly, the addition of phosphonoacetic acid to the culture medium did not have any impact on the levels of expression of the cell surface molecules analyzed (Fig. 5, red and pink compared with green lines). This result indicated that the lack of DC activation was not mediated by the shut off of the cellular machinery due to viral replication and that viral structural proteins do not induce DC activation by themselves. Taken together, our results indicate that γHV68 infection does not fully activate DCs and that γHV68 infection does not impair the capacity of the infected cells to become activated by an exogenous signal.
FIGURE 4.
γHV68 infection does not up-regulate expression of DC markers. Bone marrow-derived DCs were surface stained with CD11c and the indicated markers at 48 and 96 h after infection (MOI:2). The histogram populations were gated previously as CD11c+.
FIGURE 5.
Heat inactivation or inhibition of viral replication do not modify the failure of γHV68 infection to induce or up-regulate expression of DC surface molecules. A, Infection of DC cultures with heat-inactivated γHV68 does not induce up-regulation of cell surface markers (MOI:10). B, Addition of phosphonoacetic acid, an inhibitor of the viral polymerase, to the cell culture medium does not induce up-regulation of DC markers. The histogram populations were gated previously as CD11c+ DCs.
γHV68 infection induces IL-10 production in activated DCs
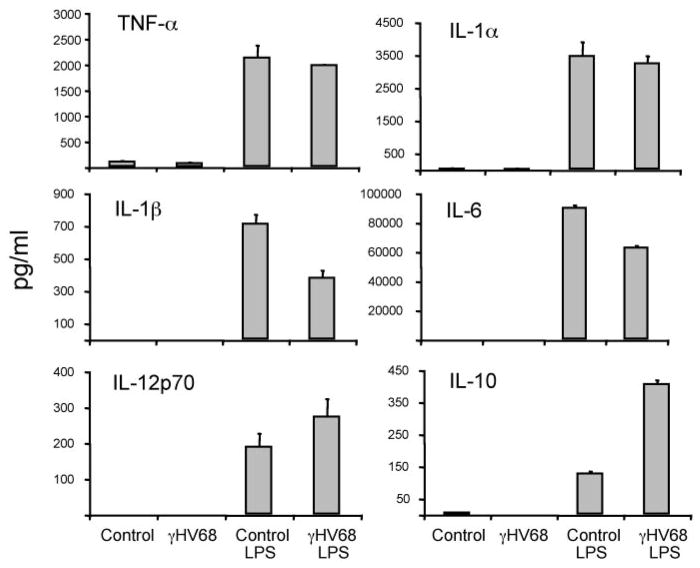
We have shown that γHV68 infection of DCs does not induce surface expression of most cell surface markers associated with activation. As only fully mature DCs (IL-12 producers) are potent inducers of immunity (30), we next examined whether viral infection impacts cytokine production associated with DC maturation by analyzing cytokine levels in the supernatants of infected DC cultures (Fig. 6). The results show that γHV68 infection in the absence of other activation signals does not induce secretion of proinflammatory cytokines, including IL-1α, IL-1β, IL-6, IL-12p70, and TNF-α. In addition, γHV68 infection did not block LPS-induced secretion of proinflammatory cytokines, although there were modest changes in the secretion of IL-1β, IL-6, and IL-12.
FIGURE 6.
Analysis of cytokine production in DC culture supernatants 96 h after γHV68 infection (MOI:2). The data presented are the mean and SD of triplicate wells from one of three representative experiments.
DCs control T cell polarization, and some viruses try to affect the normal development of a Th1 immune response by inducing DCs to produce immunosuppressive or Th2-type factors (31). Thus, we also analyzed the secretion of IL-10 in the supernatants of infected DC cultures (Fig. 6). The data show that γHV68 infection in the absence of other activation signals did not induce IL-10 production. However, γHV68 infection greatly enhanced the ability of LPS-stimulated DCs to produce IL-10. IL-10 was first recognized for its ability to inhibit activation and effector function of T cells, monocytes, and macrophages (32). Thus, γHV68-enhanced secretion of an immunosuppressive cytokine by DCs may provide an infectious advantage to the virus.
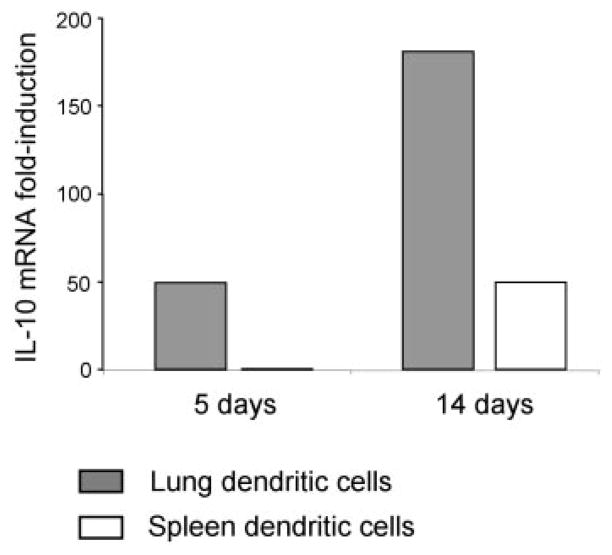
Viral induction of IL-10 is a strategy used by another γ-herpes-virus, EBV, which encodes an IL-10 homologue (BCRF-1) (33). Endogenous levels of IL-10 have also been shown to increase after γHV68 infection of mice (34). To corroborate whether the induction of IL-10 observed in DC cultures could have biological significance, we determined whether DCs isolated from infected mice expressed IL-10. We sorted DCs from the lung and spleen of mice at days 5 and 14 after infection and analyzed IL-10 expression by real-time PCR (Fig. 7). The data show a marked increase in IL-10 mRNA expression in DCs isolated from infected mice, especially in lung (5 and 14 dpi) and spleen (14 dpi). Therefore, γHV68 infection induces IL-10 production by dendritic cells both in culture and during the course of an in vivo infection.
FIGURE 7.
IL-10 expression in DCs isolated from lung and spleen at days 5 and 14 after γHV68 infection was determined by real-time PCR, as indicated in the Materials and Methods. FACS-sorted DC populations were >95% pure.
γHV68 infection of dendritic cells inhibits the proliferation of T cells
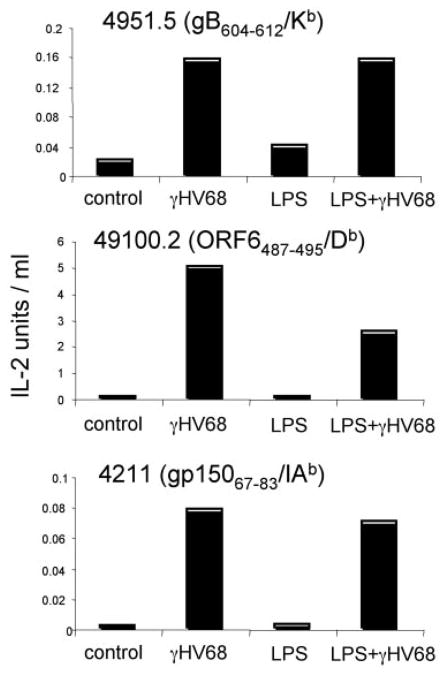
It has been reported that γHV68 interferes with Ag presentation by inducing MHC class I down-regulation (29, 35). However, our analysis of infected DCs in vitro showed no evidence for MHC down-regulation (Fig. 4). To explore the impact of γHV68 infection on functional Ag presentation, we determined the capacity of infected DCs, with or without LPS stimulation, to process and express virus-specific Ags, as assessed by induction of IL-2 secretion by a panel of γHV68-specific T cell hybridomas (26, 36). T cell hybridoma stimulation is much less stringent than that of naive T cells because it is independent of costimulation. Therefore, this experimental approach allows us to determine exclusively the capacity of the infected cells to process and express viral Ags. As shown in Fig. 8, the ability of infected DCs to stimulate T cell hybridomas confirmed expression of γHV68-specific Ags on their cell surface. The data also indicate that LPS-induced stimulation did not alter the stimulatory capacity of the infected DCs. This result was unexpected in light of the different levels of surface expression of MHC molecules detected in infected DCs with and without LPS-induced activation (Fig. 4).
FIGURE 8.
γHV68-infected DCs process and express viral epitope-MHC complexes on the cell surface. The figure shows the relative response of three virus-specific T cell hybridomas (Kb-, Db-, and IAb-restricted) after stimulation with γHV68-infected DCs. Positive controls (peptide-loaded DCs) and negative controls (naive DCs) were routinely included.
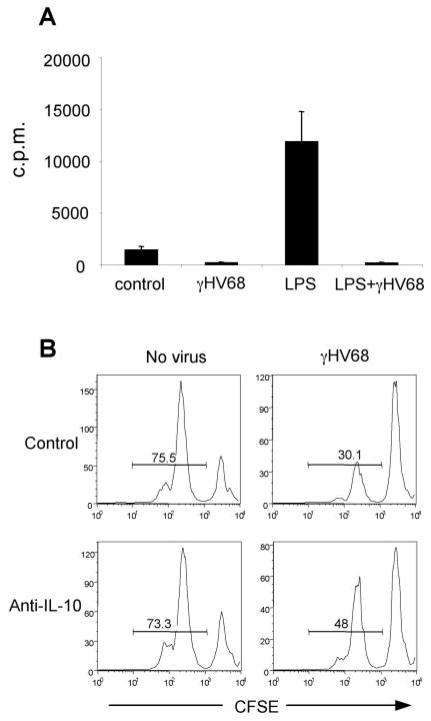
Next, we determined the capacity of infected DCs to stimulate normal T cells in an allogeneic mixed lymphocyte response, a standard functional readout for pathogen-infected DCs (37–40). As shown in Fig. 9A, γHV68 infection of cultured DCs interfered with the LPS induced-activation of allogeneic T cells. Because the T cell hybridoma experiments indicate that the virus does not interfere with the cell surface expression of functional virus-specific peptide/MHC complexes, the data suggest that γHV68 interferes with T cell stimulation per se, either because of inadequate co-stimulation or due to the enhanced production of the immunosuppressive cytokine, IL-10. Next, we cocultured DCs with and without γHV68 in the presence of allogenic T cells and anti-IL-10 blocking Abs. The data show that blocking Ab reduced the suppressive activity in the infected samples (Fig. 9B). Thus, our results indicate γHV68-infected DCs can generate IL-10-dependent suppression upon culture with allogenic T cells.
FIGURE 9.
γHV68 infection of DCs inhibits T cell proliferation in a MLR. A, DCs were infected or not with γHV68 and then added to allogenic T cells. T cell proliferation was assessed by incorporation of [3H]thymidine. B, Neutralizing anti-IL-10 Ab was added at 10 μg/ml to LPS-activated DCs, and T cell proliferation was assessed by CFSE dilution. The data are from one of two experiments with similar results.
Lack of IL-10 decreases γHV68 latency without modulating acute viral infection
To further study the role of IL-10 during γ-herpesvirus infection, we analyzed the consequences of the lack of IL-10 on the viral load in γHV68-infected mice. IL-10−/− mice were intranasally infected, and the titers of infectious and latent virus were determined in lung and spleen, respectively. The data show no significant differences in levels of infectious virus in IL-10 −/− and control mice, as determined by plaque assay of day 7 lung tissue homogenates (Fig. 10A). Consistent with previous reports, determination of the numbers of latently infected cells in the spleen analyzed by an infective center assay at day 14 show statistically significant lower levels of latently infected cells in mice lacking IL-10 (Fig. 10B). In addition, this reduction in viral latency was maintained during long-term infection (3 mo), as assessed by LDA-PCR (Fig. 10C). Thus, the absence of IL-10 decreases the establishment and maintenance of γHV68 latency in the spleen without affecting acute viral replication in the lung.
FIGURE 10.
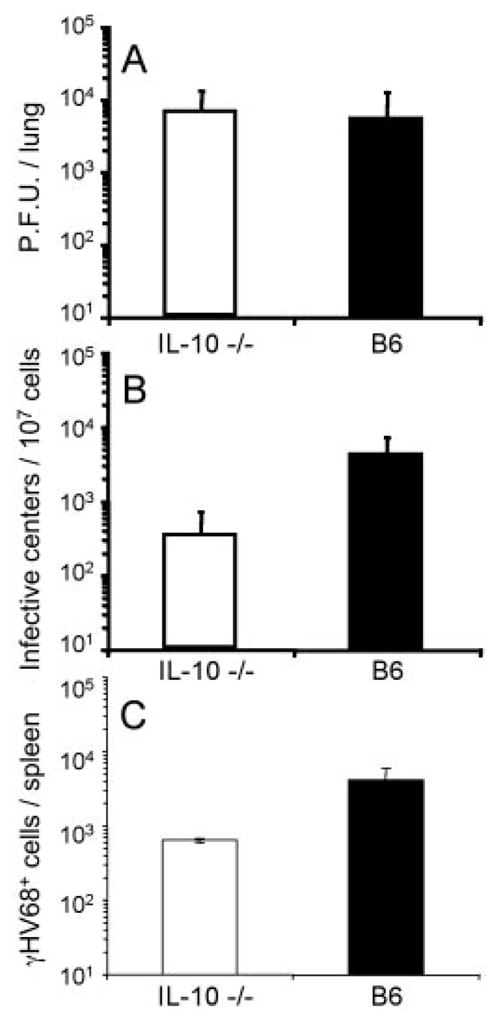
Analysis of γHV68 infection in the absence of host IL-10. C56BL/6 (B6) wild-type mice and IL-10 −/− mice were intranasally infected with γHV68. A, Infectious virus titers in the lung at day 7 were determined by plaque assay. B, The numbers of latently infected cells in the spleen at day 14 were determined by an infective center assay. The statistical significance of the difference in latent virus was determined by Student’s t test (p = 0.007). C, The numbers of latently infected cells in the spleen at day 90 after infection was determined by LDA-PCR (p = 0.01).
Discussion
Our current findings, that DCs are an early target and long-term reservoir for γHV68 latency and that viral infection of DCs impairs their function, support the possibility that infection of DCs may confer a selective advantage for the γ2-herpesviruses, as has been postulated for other chronic viruses such as HIV (41), human herpes virus-6 (38), HSV-1 (42), murine cytomegalovirus (39), and lymphocytic choriomeningitis virus (43). First, using an in vivo mouse model, we have shown that respiratory DCs at the mucosal site of infection are latently infected at high frequencies very early during acute primary infection and that all the subsets of splenic dendritic cells analyzed contribute to the viral reservoir during the establishment and long-term latency phase of infection. Second, we developed an in vitro model in which γHV68 productively infects bone marrow-derived DC cultures without immediate induction of cytopathic effect to determine the consequences of γ-herpesvirus interaction with the host cell and to examine the functional impact of viral infection on DC function. The data show that γHV68 infection did not induce cellular activation or modulation of relevant cell surface costimulatory and MHC molecules. However, the infected DCs could be activated by addition of LPS to the culture. Thus, γHV68 infection neither induces DC maturation, nor does it prevent the activation of infected DCs by other stimuli. The data also show that although infected DCs stimulated IL-2 production by T cell hybridomas, they were unable to stimulate normal T cells in an allogeneic T cell stimulation assay. This T cell regulation was partially dependent on IL-10. Third, we also show that DCs from infected mice expressed high levels of IL-10 and that absence of IL-10 contributed to decrease the amount of virus during the latent phase of infection.
Primary mouse B cells are inefficiently infected with γHV68, although the virus induces cellular phenotypic changes (44, 45). The failure of γHV68 to circularize after virus internalization in primary lymphocytes is thought to underlie the inability of the virus to transform or replicate in these cultures (46). In contrast with B cell infection, we found that γHV68 infection of DCs failed to induce an activated surface phenotype. DCs also did not secrete type 1 cytokines in response to γHV68 infection unless they were exogenously stimulated. In addition, γHV68-activated DCs secreted large amounts of IL-10, which suggests that viral infection and cellular activation have a synergistic effect on IL-10 production. IL-10 exhibits potent immunosuppressive activity during both type 1 and type 2 immune responses (32), and pulmonary DCs producing IL-10 mediate tolerance (47). Production of IL-10 partially contributes to the failure of infected, exogenously activated DCs to stimulate normal T cells in an allogeneic response.
Modulation of early DC function appears to be a common underlying theme for the γ-herpesviruses but appears to be accomplished in different ways for the γ1- and γ2-herpesviruses. EBV, the prototypic γ1-herpesvirus, does not infect DCs (48) but inhibits their development by promoting apoptosis of their precursors (49). KSHV and γHV68, both γ2-herpesviruses, have similar mechanisms in that they directly infect and establish reservoirs in DCs. KSHV has been detected in monocytes and DCs (11), and there is evidence for functional impairment of DCs isolated from patients with Kaposi’s sarcoma (13). Understanding the mechanism of this impairment has been hampered, until now, by the lack of relevant in vitro models of infection. The initial characterization of an in vitro model of γHV68 infection reported here will allow a detailed analysis of the consequences of γ2-herpesvirus infection on DC function. Many viruses are capable of infecting DCs and interfering with their function in vitro (50). However, due to the different conditions of infection in culture and to the unclear relationship between cultured and tissue DCs, these results have to be carefully extrapolated to the host. The early and broad spectrum of γHV68 infection of DCs in vivo and the fact that DCs express increased amounts of IL-10 during in vivo infection supports its relevance as a possible immune evasion strategy.
IL-10 induction appears to be a common immune evasion strategy for the establishment of a variety of chronic viral infections, including the γ-herpesviruses. For example, HIV-1-infected DCs elicit IL-10 production and T cell regulation (41). In addition, IL-10 production is associated both with KSHV and EBV infections. Primary effusion lymphoma cells, a type of lymphoma associated with KSHV infection, release IL-10 (51). EBV expresses a vIL-10 homologue (31) and also induces transformed cells to produce IL-10 (52). The role of IL-10 in EBV-related diseases is remarkable to the extent that IL-10 levels in serum are correlated with EBV load and serve as an early diagnostic assay for non-Hodgkin’s lymphoma (53) and posttransplant lymphoproliferative disorders (54). Our observation that γHV68 infection of bone marrow-derived DCs promotes the secretion of IL-10, a cytokine that has an inhibitory effect on immune responses (32) and that γHV68 infection can generate IL-10 dependent suppression of allogenic T cell responses, is consistent with data from several other viral infections (55–60). In addition, we showed that DCs isolated from infected mice produce large amounts of IL-10 in vivo. Consistent with an important role for IL-10 in γHV68 infection, previous analysis of γHV68-infected IL-10 −/− mice showed an increase in virus-induced splenomegaly and leukocytosis and reduced viral latency (34). We also demonstrated decreased γHV68 latency in the spleens of IL-10 −/− mice, both at the peak of latency (day 14 postinfection) and after the establishment of stable, long-term latency (day 90 postinfection). Importantly, there was no modulation of infectious virus titers during acute viral infection in the lung. These findings suggest that viral induction of host IL-10 production contributes to increase the number of latently infected cells independent of the acute infection.
Our phenotypic analysis showed no evidence for down-modulation of MHC class I molecules, and analysis of functional Ag presentation, detected by the ability to stimulate virus-specific T cell hybridomas, showed no evidence for virus-induced impairment. This observation contrasts with other studies indicating that γHV68 induces MHC class I surface down-regulation, as a consequence of ubiquitination of class I molecules and TAP degradation by the virally encoded K3 gene product (29, 61). Analysis following infection with K3-deficient γHV68 showed no effect on clearance of lytic virus but demonstrated an impact on the establishment of latency (35). As our gene expression analysis shows that infected DCs express K3, our failure to observe class I down-modulation after infection of DCs is unexpected. Down-regulation of MHC class I has been reported for infected fibroblasts and transfected cell lines (29, 61), raising the intriguing possibility that the Ag presentation machinery of DCs is efficient to overcome the effects of K3. Cell type-specific differences in MHC class I down-regulation have also been described for HSV-1, where ICP47-TAP interactions vary between cell types (62–64).
Early γHV68 infection of DCs is consistent with two possible immune evasion strategies. First, early lytic infection of DCs would result in their death and the release of progeny virus. However, γHV68-infected cultured DCs do not undergo immediate cytopathic effect. Second, early latent infection of DCs might result in functional modulation. Our data support this latter possibility that γHV68 establishes a latent infection in DCs and impairs DC function. The detection of episomal and linear γHV68 DNA in lung DCs and the establishment of long-term latency in spleen DCs is consistent with latent infection of DCs. In addition, the demonstration that γHV68 infection induces increased IL-10 secretion by LPS-stimulated DCs suggests a possible mechanism of functional modulation.
Despite the impact of infection on DC function demonstrated in this study, a vigorous immune response is mounted against γHV68. However, the early response to γHV68, as with EBV, is largely directed against lytic epitopes (65, 66). The lytic infection may serve as a decoy to “distract” the immune response and allow latent virus to sneak through. In support of this, T cells responding to the single latent epitope characterized are not detectable in the lung, mesenteric lymph node, or spleen until 19 days postinfection (67). We propose that early infection of DCs results in functional modulation, biasing the initiation of the immune response toward lytic instead of latent epitopes. The vigorous T cell response to epitopes of lytic cycle proteins, which are produced in larger amounts than latent cycle proteins in dying cells where the virus replicates, is likely driven by cross-presentation and cross-priming by non-γHV68-infected DCs. Thus, we propose that despite strong antiviral immunity, the relative reduction in response to latent vs lytic Ags may help latent virus to establish a foothold in the host.
Acknowledgments
We thank Simon Monard, Brandon Sells, and the Trudeau Institute Flow Cytometry Facility for assistance with the FACS sorting; Scottie Adams, Jessica Hoffman, and the Trudeau Institute Molecular Biology Facility for the real-time PCR analysis of IL-10; and John Moore for technical assistance.
Footnotes
This work was supported by National Institutes of Health Grants AI42927 (to M.A.B.), AI51602 (to M.A.B.), and AI59603 (to E.F.), the Trudeau Institute, and the Columbus Children’s Research Institute.
Abbreviations used in this paper: DC, dendritic cell; KSHV, Kaposi’s sarcoma-associated herpesvirus; MOI, multiplicity of infection; LDA, limiting dilution analysis; dpi, days postinfection.
Disclosures
The authors have no financial conflict of interest.
References
- 1.Mellman I, Steinman RM. Dendritic cells: specialized and regulated antigen processing machines. Cell. 2001;106:255–258. doi: 10.1016/s0092-8674(01)00449-4. [DOI] [PubMed] [Google Scholar]
- 2.Lanzavecchia A, Sallusto F. Regulation of T cell immunity by dendritic cells. Cell. 2001;106:263–266. doi: 10.1016/s0092-8674(01)00455-x. [DOI] [PubMed] [Google Scholar]
- 3.Banchereau J, Steinman RM. Dendritic cells and the control of immunity. Nature. 1998;392:245–252. doi: 10.1038/32588. [DOI] [PubMed] [Google Scholar]
- 4.Bell D, Young JW, Banchereau J. Dendritic cells. Adv Immunol. 1999;72:255–324. doi: 10.1016/s0065-2776(08)60023-1. [DOI] [PubMed] [Google Scholar]
- 5.Banchereau J, Briere F, Caux C, Davoust J, Lebecque S, Liu YJ, Pulendran B, Palucka K. Immunobiology of dendritic cells. Annu Rev Immunol. 2000;18:767–811. doi: 10.1146/annurev.immunol.18.1.767. [DOI] [PubMed] [Google Scholar]
- 6.Liu YJ. Dendritic cell subsets and lineages, and their functions in innate and adaptive immunity. Cell. 2001;106:259–262. doi: 10.1016/s0092-8674(01)00456-1. [DOI] [PubMed] [Google Scholar]
- 7.Rescigno M, Borrow P. The host-pathogen interaction: new themes from dendritic cell biology. Cell. 2001;106:267–270. doi: 10.1016/s0092-8674(01)00454-8. [DOI] [PubMed] [Google Scholar]
- 8.Palucka K, Banchereau J. How dendritic cells and microbes interact to elicit or subvert protective immune responses. Curr Opin Immunol. 2002;14:420–431. doi: 10.1016/s0952-7915(02)00365-5. [DOI] [PubMed] [Google Scholar]
- 9.Moore PS, Chang Y. Kaposi’s sarcoma-associated herpesvirus immunoevasion and tumorigenesis: two sides of the same coin? Annu Rev Microbiol. 2003;57:609–639. doi: 10.1146/annurev.micro.57.030502.090824. [DOI] [PMC free article] [PubMed] [Google Scholar]
- 10.Offermann MK. Consideration of host-viral interactions in the pathogenesis of Kaposi’s sarcoma. J Acquir Immune Defic Syndr. 1999;21(Suppl 1):S58–S65. [PubMed] [Google Scholar]
- 11.Rettig MB, Ma HJ, Vescio RA, Pold M, Schiller G, Belson D, Savage A, Nishikubo C, Wu C, Fraser J, Said JW, Berenson JR. Kaposi’s sarcoma-associated herpesvirus infection of bone marrow dendritic cells from multiple myeloma patients. Science. 1997;276:1851–1854. doi: 10.1126/science.276.5320.1851. [DOI] [PubMed] [Google Scholar]
- 12.Schulz TF. Kaposi’s sarcoma-associated herpesvirus (human herpesvi-rus-8) J Gen Virol. 1998;79(Pt. 7):1573–1591. doi: 10.1099/0022-1317-79-7-1573. [DOI] [PubMed] [Google Scholar]
- 13.Stebbing J, Gazzard B, Portsmouth S, Gotch F, Kim L, Bower M, Mandalia S, Binder R, Srivastava P, Patterson S. Disease-associated dendritic cells respond to disease-specific antigens through the common heat shock protein receptor. Blood. 2003;102:1806–1814. doi: 10.1182/blood-2003-03-0891. [DOI] [PubMed] [Google Scholar]
- 14.Virgin HW, Latreille P, Wamsley P, Hallsworth K, Weck KE, Dal Canto AJ, Speck SH. Complete sequence and genomic analysis of murine gammaherpesvirus 68. J Virol. 1997;71:5894–5904. doi: 10.1128/jvi.71.8.5894-5904.1997. [DOI] [PMC free article] [PubMed] [Google Scholar]
- 15.Virgin HW, Speck SH. Unraveling immunity to γ-herpesviruses: a new model for understanding the role of immunity in chronic virus infection. Curr Opin Immunol. 1999;11:371–379. doi: 10.1016/s0952-7915(99)80063-6. [DOI] [PubMed] [Google Scholar]
- 16.Doherty PC, Christensen JP, Belz GT, Stevenson PG, Sangster MY. Dissecting the host response to a γ-herpesvirus. Philos Trans R Soc Lond B Biol Sci. 2001;356:581–593. doi: 10.1098/rstb.2000.0786. [DOI] [PMC free article] [PubMed] [Google Scholar]
- 17.Flaño E, Husain SM, Sample JT, Woodland DL, Blackman MA. Latent murine γ-herpesvirus infection is established in activated B cells, dendritic cells, and macrophages. J Immunol. 2000;165:1074–1081. doi: 10.4049/jimmunol.165.2.1074. [DOI] [PubMed] [Google Scholar]
- 18.Flaño E, I, Kim J, Moore J, Woodland DL, Blackman MA. Differential γ-herpesvirus distribution in distinct anatomical locations and cell subsets during persistent infection in mice. J Immunol. 2003;170:3828–3834. doi: 10.4049/jimmunol.170.7.3828. [DOI] [PubMed] [Google Scholar]
- 19.Stewart JP, Usherwood EJ, Ross A, Dyson H, Nash T. Lung epithelial cells are a major site of murine gammaherpesvirus persistence. J Exp Med. 1998;187:1941–1951. doi: 10.1084/jem.187.12.1941. [DOI] [PMC free article] [PubMed] [Google Scholar]
- 20.Weck KE, Kim SS, Virgin HW, Speck SH. Macrophages are the major reservoir of latent murine gammaherpesvirus 68 in peritoneal cells. J Virol. 1999;73:3273–3283. doi: 10.1128/jvi.73.4.3273-3283.1999. [DOI] [PMC free article] [PubMed] [Google Scholar]
- 21.Flaño E, I, Kim J, Woodland DL, Blackman MA. γ-Herpesvirus latency is preferentially maintained in splenic germinal center and memory B cells. J Exp Med. 2002;196:1363–1372. doi: 10.1084/jem.20020890. [DOI] [PMC free article] [PubMed] [Google Scholar]
- 22.Virgin HW, Presti RM, Li XY, Liu C, Speck SH. Three distinct regions of the murine gammaherpesvirus 68 genome are transcriptionally active in latently infected mice. J Virol. 1999;73:2321–2332. doi: 10.1128/jvi.73.3.2321-2332.1999. [DOI] [PMC free article] [PubMed] [Google Scholar]
- 23.Gardella T, Medveczky P, Sairenji T, Mulder C. Detection of circular and linear herpesvirus DNA molecules in mammalian cells by gel electrophoresis. J Virol. 1984;50:248–254. doi: 10.1128/jvi.50.1.248-254.1984. [DOI] [PMC free article] [PubMed] [Google Scholar]
- 24.Decker LL, Babcock GJ, Thorley-Lawson DA. Detection and discrimination of latent and replicative herpesvirus infection at the single cell level in vivo. Methods Mol Biol. 2001;174:111–116. doi: 10.1385/1-59259-227-9:111. [DOI] [PubMed] [Google Scholar]
- 25.Flaño E, Jia Q, Moore J, Woodland DL, Sun R, Blackman MA. Early establishment of γ-herpesvirus latency: implications for immune control. J Immunol. 2005;174:4972–4978. doi: 10.4049/jimmunol.174.8.4972. [DOI] [PMC free article] [PubMed] [Google Scholar]
- 26.Liu L, Flaño E, Usherwood EJ, Surman S, Blackman MA, Woodland DL. Lytic cycle T cell epitopes are expressed in two distinct phases during MHV-68 infection. J Immunol. 1999;163:868–874. [PubMed] [Google Scholar]
- 27.Overbergh L, Valckx D, Waer M, Mathieu C. Quantification of murine cytokine mRNAs using real time quantitative reverse transcriptase PCR. Cytokine. 1999;11:305–312. doi: 10.1006/cyto.1998.0426. [DOI] [PubMed] [Google Scholar]
- 28.Bechtel JT, Liang Y, Hvidding J, Ganem D. Host range of Kaposi’s sarcoma-associated herpesvirus in cultured cells. J Virol. 2003;77:6474–6481. doi: 10.1128/JVI.77.11.6474-6481.2003. [DOI] [PMC free article] [PubMed] [Google Scholar]
- 29.Stevenson PG, Efstathiou S, Doherty PC, Lehner PJ. Inhibition of MHC class I-restricted antigen presentation by γ2-herpesviruses. Proc Natl Acad Sci USA. 2000;97:8455–8460. doi: 10.1073/pnas.150240097. [DOI] [PMC free article] [PubMed] [Google Scholar]
- 30.Lutz MB, Schuler G. Immature, semi-mature and fully mature dendritic cells: which signals induce tolerance or immunity? Trends Immunol. 2002;23:445–449. doi: 10.1016/s1471-4906(02)02281-0. [DOI] [PubMed] [Google Scholar]
- 31.Alcami A, Koszinowski UH. Viral mechanisms of immune evasion. Immunol Today. 2000;21:447–455. doi: 10.1016/S0167-5699(00)01699-6. [DOI] [PMC free article] [PubMed] [Google Scholar]
- 32.Moore KW, de Waal Malefyt R, Coffman RL, O’Garra A. Interleukin-10 and the interleukin-10 receptor. Annu Rev Immunol. 2001;19:683–765. doi: 10.1146/annurev.immunol.19.1.683. [DOI] [PubMed] [Google Scholar]
- 33.Rickinson AB, Kieff E. Epstein-Barr virus. In: Knipe DM, Fields BN, Howley PM, editors. Fields Virology. Lippincott-Raven Publishers; Philadelphia: 1996. pp. 2397–2446. [Google Scholar]
- 34.Peacock JW, Bost KL. Murine gammaherpesvirus-68-induced interleukin-10 increases viral burden, but limits virus-induced splenomegaly and leukocytosis. Immunology. 2001;104:109–117. doi: 10.1046/j.0019-2805.2001.01286.x. [DOI] [PMC free article] [PubMed] [Google Scholar]
- 35.Stevenson PG, May JS, Smith XG, Marques S, Adler H, Koszinowski UH, Simas JP, Efstathiou S. K3-mediated evasion of CD8+ T cells aids amplification of a latent gammaherpesvirus. Nat Immunol. 2002;3:733–740. doi: 10.1038/ni818. [DOI] [PubMed] [Google Scholar]
- 36.Flaño E, Woodland DL, Blackman MA, Doherty PC. Analysis of virus-specific CD4+ T cells during long-term gammaherpesvirus infection. J Virol. 2001;75:7744–7748. doi: 10.1128/JVI.75.16.7744-7748.2001. [DOI] [PMC free article] [PubMed] [Google Scholar]
- 37.Mahanty S, Hutchinson K, Agarwal S, McRae M, Rollin PE, Pulendran B. Cutting edge: impairment of dendritic cells and adaptive immunity by Ebola and Lassa viruses. J Immunol. 2003;170:2797–2801. doi: 10.4049/jimmunol.170.6.2797. [DOI] [PubMed] [Google Scholar]
- 38.Kakimoto M, Hasegawa A, Fujita S, Yasukawa M. Phenotypic and functional alterations of dendritic cells induced by human herpesvirus 6 infection. J Virol. 2002;76:10338–10345. doi: 10.1128/JVI.76.20.10338-10345.2002. [DOI] [PMC free article] [PubMed] [Google Scholar]
- 39.Andrews DM, Andoniou CE, Granucci F, Ricciardi-Castagnoli P, Degli-Esposti MA. Infection of dendritic cells by murine cytomegalovirus induces functional paralysis. Nat Immunol. 2001;2:1077–1084. doi: 10.1038/ni724. [DOI] [PubMed] [Google Scholar]
- 40.Engelmayer J, Larsson M, Subklewe M, Chahroudi A, Cox WI, Steinman RM, Bhardwaj N. Vaccinia virus inhibits the maturation of human dendritic cells: a novel mechanism of immune evasion. J Immunol. 1999;163:6762–6768. [PubMed] [Google Scholar]
- 41.Granelli-Piperno A, Golebiowska A, Trumpfheller C, Siegal FP, Steinman RM. HIV-1-infected monocyte-derived dendritic cells do not undergo maturation but can elicit IL-10 production and T cell regulation. Proc Natl Acad Sci USA. 2004;101:7669–7674. doi: 10.1073/pnas.0402431101. [DOI] [PMC free article] [PubMed] [Google Scholar]
- 42.Salio M, Cella M, Suter M, Lanzavecchia A. Inhibition of dendritic cell maturation by herpes simplex virus. Eur J Immunol. 1999;29:3245–3253. doi: 10.1002/(SICI)1521-4141(199910)29:10<3245::AID-IMMU3245>3.0.CO;2-X. [DOI] [PubMed] [Google Scholar]
- 43.Sevilla N, Kunz S, Holz A, Lewicki H, Homann D, Yamada H, Campbell KP, de La Torre JC, Oldstone MB. Immunosuppression and resultant viral persistence by specific viral targeting of dendritic cells. J Exp Med. 2000;192:1249–1260. doi: 10.1084/jem.192.9.1249. [DOI] [PMC free article] [PubMed] [Google Scholar]
- 44.Dutia BM, Stewart JP, Clayton RA, Dyson H, Nash AA. Kinetic and phenotypic changes in murine lymphocytes infected with murine gammaherpesvirus-68 in vitro. J Gen Virol. 1999;80(Pt. 10):2729–2736. doi: 10.1099/0022-1317-80-10-2729. [DOI] [PubMed] [Google Scholar]
- 45.Stevenson PG, Doherty PC. Non-antigen-specific B-cell activation following murine gammaherpesvirus infection is CD4 independent in vitro but CD4 dependent in vivo. J Virol. 1999;73:1075–1079. doi: 10.1128/jvi.73.2.1075-1079.1999. [DOI] [PMC free article] [PubMed] [Google Scholar]
- 46.Nash AA, Dutia BM, Stewart JP, Davison AJ. Natural history of murine gammaherpesvirus infection. Philos Trans R Soc Lond B Biol Sci. 2001;356:569–579. doi: 10.1098/rstb.2000.0779. [DOI] [PMC free article] [PubMed] [Google Scholar]
- 47.Akbari O, DeKruyff RH, Umetsu DT. Pulmonary dendritic cells producing IL-10 mediate tolerance induced by respiratory exposure to antigen. Nat Immunol. 2001;2:725–731. doi: 10.1038/90667. [DOI] [PubMed] [Google Scholar]
- 48.Bickham K, Goodman K, Paludan C, Nikiforow S, Tsang ML, Steinman RM, Munz C. Dendritic cells initiate immune control of Epstein-Barr virus transformation of B lymphocytes in vitro. J Exp Med. 2003;198:1653–1663. doi: 10.1084/jem.20030646. [DOI] [PMC free article] [PubMed] [Google Scholar]
- 49.Li L, Liu D, Hutt-Fletcher L, Morgan A, Masucci MG, Levitsky V. Epstein-Barr virus inhibits the development of dendritic cells by promoting apoptosis of their monocyte precursors in the presence of granulocyte macrophage-colony-stimulating factor and interleukin-4. Blood. 2002;99:3725–3734. doi: 10.1182/blood.v99.10.3725. [DOI] [PubMed] [Google Scholar]
- 50.Yewdell JW, Hill AB. Viral interference with antigen presentation. Nat Immunol. 2002;3:1019–1025. doi: 10.1038/ni1102-1019. [DOI] [PubMed] [Google Scholar]
- 51.Jones KD, Aoki Y, Chang Y, Moore PS, Yarchoan R, Tosato G. Involvement of interleukin-10 (IL-10) and viral IL-6 in the spontaneous growth of Kaposi’s sarcoma herpesvirus-associated infected primary effusion lymphoma cells. Blood. 1999;94:2871–2879. [PubMed] [Google Scholar]
- 52.Burdin N, Peronne C, Banchereau J, Rousset F. Epstein-Barr virus transformation induces B lymphocytes to produce human interleukin 10. J Exp Med. 1993;177:295–304. doi: 10.1084/jem.177.2.295. [DOI] [PMC free article] [PubMed] [Google Scholar]
- 53.Blay JY, Burdin N, Rousset F, Lenoir G, Biron P, Philip T, Banchereau J, Favrot MC. Serum interleukin-10 in non-Hodgkin’s lymphoma: a prognostic factor. Blood. 1993;82:2169–2174. [PubMed] [Google Scholar]
- 54.Muti G, Klersy C, Baldanti F, Granata S, Oreste P, Pezzetti L, Gatti M, Gargantini L, Caramella M, Mancini V, Gerna G, Morra E. Epstein-Barr virus (EBV) load and interleukin-10 in EBV-positive and EBV-negative post-transplant lymphoproliferative disorders. Br J Haematol. 2003;122:927–933. doi: 10.1046/j.1365-2141.2003.04540.x. [DOI] [PubMed] [Google Scholar]
- 55.Arena A, Liberto MC, Iannello D, Capozza AB, Foca A. Altered cytokine production after human herpes virus type 6 infection. New Microbiol. 1999;22:293–300. [PubMed] [Google Scholar]
- 56.van Den Broek M, Bachmann MF, Kohler G, Barner M, Escher R, Zinkernagel R, Kopf M. IL-4 and IL-10 antagonize IL-12-mediated protection against acute vaccinia virus infection with a limited role of IFN-γ and nitric oxide synthetase 2. J Immunol. 2000;164:371–378. doi: 10.4049/jimmunol.164.1.371. [DOI] [PubMed] [Google Scholar]
- 57.Stockl J, Vetr H, Majdic O, Zlabinger G, Kuechler E, Knapp W. Human major group rhinoviruses down-modulate the accessory function of monocytes by inducing IL-10. J Clin Invest. 1999;104:957–965. doi: 10.1172/JCI7255. [DOI] [PMC free article] [PubMed] [Google Scholar]
- 58.Redpath S, Angulo A, Gascoigne NR, Ghazal P. Murine cytomegalovirus infection down-regulates MHC class II expression on macrophages by induction of IL-10. J Immunol. 1999;162:6701–6707. [PubMed] [Google Scholar]
- 59.Lin MT, Hinton DR, Parra B, Stohlman SA, van der Veen RC. The role of IL-10 in mouse hepatitis virus-induced demyelinating encephalomyelitis. Virology. 1998;245:270–280. doi: 10.1006/viro.1998.9170. [DOI] [PubMed] [Google Scholar]
- 60.Rowell JF, Griffin DE. The inflammatory response to nonfatal Sindbis virus infection of the nervous system is more severe in SJL than in BALB/c mice and is associated with low levels of IL-4 mRNA and high levels of IL-10-producing CD4+ T cells. J Immunol. 1999;162:1624–1632. [PubMed] [Google Scholar]
- 61.Boname JM, Stevenson PG. MHC class I ubiquitination by a viral PHD/LAP finger protein. Immunity. 2001;15:627–636. doi: 10.1016/s1074-7613(01)00213-8. [DOI] [PubMed] [Google Scholar]
- 62.Jugovic P, Hill AM, Tomazin R, Ploegh H, Johnson DC. Inhibition of major histocompatibility complex class I antigen presentation in pig and primate cells by herpes simplex virus type 1 and 2 ICP47. J Virol. 1998;72:5076–5084. doi: 10.1128/jvi.72.6.5076-5084.1998. [DOI] [PMC free article] [PubMed] [Google Scholar]
- 63.Raftery MJ, Behrens CK, Muller A, Krammer PH, Walczak H, Schonrich G. Herpes simplex virus type 1 infection of activated cytotoxic T cells: induction of fratricide as a mechanism of viral immune evasion. J Exp Med. 1999;190:1103–1114. doi: 10.1084/jem.190.8.1103. [DOI] [PMC free article] [PubMed] [Google Scholar]
- 64.Mikloska Z, Bosnjak L, Cunningham AL. Immature monocyte-derived dendritic cells are productively infected with herpes simplex virus type 1. J Virol. 2001;75:5958–5964. doi: 10.1128/JVI.75.13.5958-5964.2001. [DOI] [PMC free article] [PubMed] [Google Scholar]
- 65.Hislop AD, Annels NE, Gudgeon NH, Leese AM, Rickinson AB. Epitope-specific evolution of human CD8+ T cell responses from primary to persistent phases of Epstein-Barr virus infection. J Exp Med. 2002;195:893–905. doi: 10.1084/jem.20011692. [DOI] [PMC free article] [PubMed] [Google Scholar]
- 66.Stevenson PG, Belz GT, Altman JD, Doherty PC. Changing patterns of dominance in the CD8+ T cell response during acute and persistent murine γ-herpesvirus infection. Eur J Immunol. 1999;29:1059–1067. doi: 10.1002/(SICI)1521-4141(199904)29:04<1059::AID-IMMU1059>3.0.CO;2-L. [DOI] [PubMed] [Google Scholar]
- 67.Obar JJ, Crist SG, Gondek DC, Usherwood EJ. Different functional capacities of latent and lytic antigen-specific CD8 T cells in murine gammaherpesvirus infection. J Immunol. 2004;172:1213–1219. doi: 10.4049/jimmunol.172.2.1213. [DOI] [PMC free article] [PubMed] [Google Scholar]


