Abstract
We describe a computational solvation model called semi-explicit assembly (SEA). SEA water captures much of the physics of explicit-solvent models but with computational speeds approaching those of implicit-solvent models. We use an explicit-water model to precompute properties of water solvation shells around simple spheres, then assemble a solute’s solvation shell by combining the shells of these spheres. SEA improves upon implicit-solvent models of solvation free energies by accounting for local solute curvature, accounting for near-neighbor nonadditivities, and treating water’s dipole as being asymmetrical with respect to positive or negative solute charges. SEA does not involve parameter fitting, because parameters come from the given underlying explicit-solvation model. SEA is about as accurate as explicit simulations as shown by comparisons against four different homologous alkyl series, a set of 504 varied solutes, solutes taken retrospectively from two solvation-prediction events, and a hypothetical polar-solute series, and SEA is about 100-fold faster than Poisson–Boltzmann calculations.
Keywords: free energy, implicit solvent, transfer
We describe here an approach for computing the free energies of solvation of solutes in water. Aqueous solvation has been modeled at different levels, ranging from detailed quantum mechanics simulations of few-molecule clusters (1, 2), to faster classical simulations using up to tens of thousands of explicit molecules (3–10), to very fast models in which water is treated implicitly as a simple uniform continuous medium (11–17). For large computations, such as those in typical biomolecule simulations, explicit-water modeling can be slow and expensive, so it is common to use implicit water instead. However, implicit models often require trade-offs in the physics that can limit their accuracies. For example, water is typically treated as a continuum rather than individual particles, and this neglects discrete microscopic effects; nonpolar solvation effects are often assumed to depend only on surface area A (expressed as γA), and not on detailed dispersive interactions and collective consequences of solute shape (18–20).
It would be useful to have a computational model of water that is both fast—approaching the speeds of the fastest implicit-solvent models—and that captures the physics and the transferability of explicit-solvent models. Toward this goal, various improvements of implicit models have been introduced (21, 22), explicit solvents have been coarse-grained (23, 24), and hybrid explicit-implicit models have been developed (25–29). Here, we take a different approach. We precompute solvation properties of water in explicit-solvent simulations of simple spheres, which we then apply in summations over assemblies about arbitrary solutes. As the details of the solvation response come entirely from the physics of an explicit solvent, this model lacks free parameters from statistical fits to solute molecular transfer free energies, resulting in a wide transferability. We call this approach semi-explicit assembly, or SEA water.
Theory
In the SEA approach, we assume that the free energy of interaction, ΔG, of a solute molecule with its solvating water molecules, is a sum of three terms,
| [1] |
ΔGnp is the free energy of forming the cavity the solute occupies in water and includes the dispersion interactions between the solute and the waters. For purely nonpolar solutes, such as simple hydrocarbons, ΔGnp is the only substantial contribution to ΔG. For solute molecules that are polar or charged, the total solvation free energy also has two additional terms (see Eq. 1): ΔGpol,surf describes the electrostatic interactions of the solute with the immediate-neighbor first-shell water molecules that surround it, and ΔGpol,bulk describes the electrostatic interactions of the solute with the water molecules that are more distant than the first solvation shell.
For the nonpolar component ΔGnp, the SEA approach is described in detail elsewhere (20). In the present paper, we describe the SEA treatment of the surface and bulk polar terms. We compute these polar components using two steps: (i) a slow series of presimulations for a given solvent and (ii) a fast summation of component free energies for a given solute.
SEA Step 1: Precalculations on Solute Spheres in Explicit Water.
SEA treats a solute molecule as a collection of “atomic” spheres of different types and sizes (i.e., different Lennard–Jones parameters and different partial charges). The first step in SEA modeling is to precalculate the positions and orientations of explicit-water molecules around those component building-block spheres. SEA can use any explicit-solvent model. Here, to illustrate the principle, we use the TIP3P water model (30).
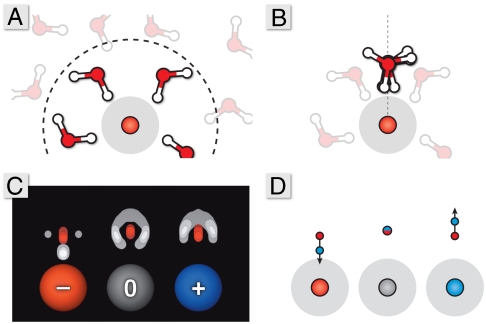
We first solvate a series of individual spheres in baths of explicit water. Spheres span a range of different sizes and Lennard–Jones parameters (6ϵ values and 6 σ values) and a range of 11 different partial charges. In total, we do precomputations on 396 different types of spheres in TIP3P water. Each sphere is simulated for 10 ns at 1 atm and 300 K. From each such simulation, we harvest the statistical properties of water distances and orientations around the sphere. For each type of sphere, we calculate the average distance between the solute and the water (the peak of the solute to water radial distribution function; see Table S1). Calculating radial distribution functions for water around these spheres, we found that the width of the first hydration shell extends out 1 to 3 Å from the van der Waals surface of the spheres, depending on the solute charge. We use a 2-Å cutoff distance from the surface of each solute to define the “first shell” (Fig. 1A) in order to exclude second hydration shell water population, which begins to grow beyond this distance around the more highly charged solutes. Within this region, we calculate the average number of water molecules and generate nearest-neighbor distribution functions. These distribution functions tell us the average distance between first-shell waters about a given solute sphere (see SI Text, Fig. S1, and Table S2).
Fig. 1.
The precomputation step. (A) Simulate the waters around sphere. (B) Superimpose all the first-shell waters onto a common axis relative to the solute–sphere center. (C) Create solvent atomic density maps. (D) Convert the density maps into dipole representations.
Around charged solute spheres, water in the first solvation shell will adopt a distribution of orientations and distances with respect to the solute sphere centers. To determine an average representation of a surface water, we align all of the first-shell water molecules onto a common axis normal to the surface of the solute sphere (Fig. 1B). The solvent atom locations are binned about this axis to form density maps of the surface water charges (Fig. 1C). From these maps, we extract dipole moments that capture the first-shell polar response of these local water molecules (Fig. 1D). In addition to a dipolar representation, an alternative quadrupole moment can be extracted (see SI Text and Fig. S2). Not unexpectedly, these water dipoles orient most strongly around spheres having the strongest electrostatic potentials, i.e., around spheres having the largest absolute charges.
The average first-shell water dipole moment has a simple functional relationship vs. the strength of the electrostatic field from the solute sphere (see SI Text and Figs. S3–S5). This observed relationship allows us to replace a simulation lookup with a sigmoidal function,
 |
[2] |
where the coefficients c0, c1, and c2 come from curve fits of the simulations. Although any saturating function, like the Langevin equation (22), would likely suffice in this fit to the explicit-solvent response, Eq. 2 is flexible, allowing it to retain subtle microscopic effects like biased water orientations around neutral solutes (31). Water’s dipole is asymmetric; hence there is an asymmetry in the resulting function, with separate fits needed for the positive and negative field cases (32–35). Around positive spheres, the limit of the sigmoidal curve coincides with the dipole moment of the TIP3P water model because water’s average dipole points away from the solute surface along the normal vector. Around negative spheres, water points one hydrogen toward the solute center (Fig. 1C) and only a partial projection of a water molecule’s dipole is along this normal vector.
SEA Step 2: Assembling the Solvation Response about an Arbitrary Molecule.
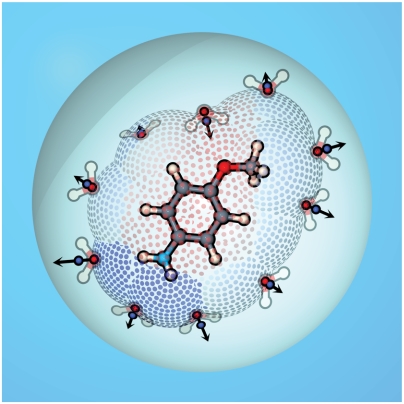
Once the precomputations have been performed, the SEA model can rapidly calculate the hydration free energy of a given solute. The nonpolar component is accumulated using our previously described approach (20), whereas the polar component is the sum of surface and bulk terms. To determine the surface polarization term, ΔGpol,surf, surface waters must be placed in physically representative locations and orientations. We generate a solvent-accessible dot surface about the solute of interest (Fig. 2). Rather than rolling a hard sphere of some fixed size over the molecule to generate a Lee–Richards or Connolly surface (36, 37), we use instead our precomputed average separations between a water molecule and the sphere center (20). This strategy captures various physical aspects of solvation, such as the fact that water molecules are held more tightly to solutes having stronger solute–solvent interactions.
Fig. 2.
An illustration of SEA sampling process around p-methoxyaniline. Semi-explicit dipoles are placed along the solvent-accessible dot surface according to the local electric field within a continuum dielectric cavity.
We select a solvation site at random on this surface and compute the electric field at this point due to all (N) small-molecule solute atoms using
 |
[3] |
where qi is the charge on solute atom i and rij is the distance between site j and solute atom i. Using the electric field association functions (Eq. 2), the appropriate dipole (or quadrupole) is placed at this site along the electric field line. After placement, surface water sites that are closer than the distance to the peak of this dipole’s nearest-neighbor distribution are eliminated. The random placement procedure then continues until all possible solvation sites are occupied or eliminated.
After generating a solvent configuration around a solute, the surface interactions are accumulated into ΔGpol,surf using
| [4] |
where sol refers to solute particles and solv refers to solvent particles. For the small-molecule solutes investigated here, ΔGsol-solv is accumulated from a pairwise Coulombic sum between all solute atoms and all water site partial charges, whereas ΔGsolv-solv is a pairwise Coulombic sum between all partial charges of differing water sites. Because positional and orientational distributions of surface water molecules are factored into the dipole representations, this pairwise sum approximates a free energy rather than simple potential energy. It should be noted that although these simple charge–dipole and dipole–dipole sums approximate the enthalpic enhancement and entropic loss from solvent electrostriction, a more detailed accounting of the solvation specifics could lead to future improvements in the technique.
To estimate the total polar component of solvation, we need the first-shell/surface component described above and the bulk component of the electrostatic free energy of solvation. We estimate this quantity using the Onsager reaction field (38),
 |
[5] |
where μ is the dipole vector of the spherical solute cavity of radius rc and ε is the dielectric constant of the external continuum. Here, rc extends from the geometric center of the solute out to the outer boundary of the farthest semi-explicit shell (see the spherical cavity in Fig. 2), and the cavity dipole is accumulated from a simple sum over all point charges within rc, which includes both the solute and the semi-explicit partial charge sites. This type of reaction field works well for neutral polar molecules, which are our primary focus here, but for solutes having a formal net charge, an additional component will be needed to account for Born effects (25, 39, 40).
To get proper averages, we repeat the random placement of the first solvation shell a set number of times to estimate the variance of the ΔGpol as a function of water placement. This variance tells us how many additional sampling iterations are needed to converge an averaged ΔG to a desired standard error. We then Boltzmann-weight these solvation-shell snapshots and calculate the probability, pi, of shell configuration i using (41)
 |
[6] |
where N is the total number of solvation configuration samples. The average solvation free energy is the weighted sum over the different shell configurations,
 |
[7] |
This Boltzmann-weighted sum enhances contribution from more probable, and correspondingly deemphasizes less probable, solvation configurations.
Results and Discussion
We now compare the SEA water model to experiments, to explicit-solvent simulations, and to Poisson–Boltzmann (PB) and generalized Born (GB) models of solvation.
Testing SEA on Homologous Series of Alkyl Chains Terminated by Different Functional Groups.
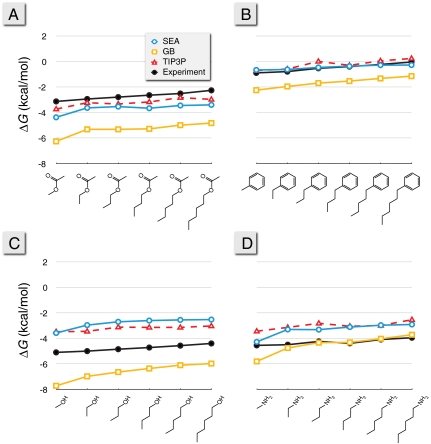
Fig. 3 shows calculated solvation free energies, ΔG, for four series of alkyl chains terminated by different organic functional groups. We compare SEA to experiments, to TIP3P simulations, and to GB. First, SEA gives good agreement with the TIP3P results, within 1 kcal/mol in all cases. Because the parameters used in SEA water modeling are identical to those of TIP3P, this shows that SEA’s sampling and regional additivity approximation are not degrading the quality of predictions relative to the much more expensive explicit-solvent simulations.
Fig. 3.
Functional group comparisons for the linear alkyl series of (A) acetates, (B) phenyls, (C) alcohols, and (D) amines. Experimental results come from ref. 55 and the TIP3P results from ref. 10. The GB results are from Amber 10 using iGB5 and γA with γ = 5 cal mol-1 Å-2 (13).
Second, although TIP3P and SEA both give good estimates of experimental ΔG values for acetates and phenyl groups, both methods predict solvation free energies for the alcohols and amines that are too positive. This indicates that the combination of General Amber Force Field (GAFF) and the AM1-BCC partial charges used in the underlying explicit-solvation model needs improvement for these functional groups. Such errors have been noted before in the explicit-solvent models (4, 6, 10).
Third, we find that GB gives free energies of solvation that are too negative in all cases except for the amines, where it matches experiments quite accurately. The errors in GB can be partly corrected by using the nonpolar SEA term in place of the standard γA term, resulting in a general 0.2–0.4 kcal/mol improvement for these molecules.
Testing SEA on a Diverse Set of 504 Small Molecules.
Next, we explore a diverse solute set, containing 504 different small molecules (10, 17, 42). It is useful because of the availability of both experimental data and of extensive TIP3P explicit-solvent simulations (10).
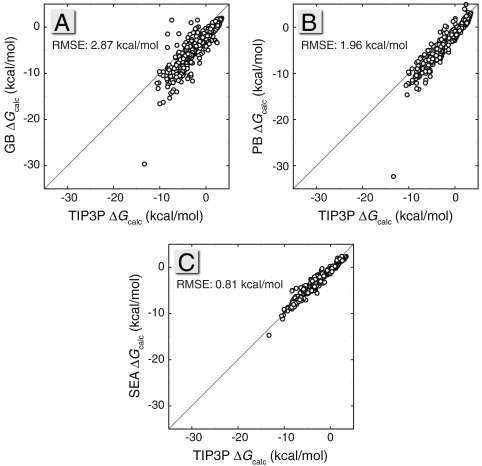
Fig. 4 compares GB, PB, and SEA with the TIP3P simulation results. Taking TIP3P as the “gold standard” for this test, Fig. 4 shows systematic improvement from GB to PB to SEA. SEA is within 1 kcal/mol root mean square error (RMSE) relative to TIP3P. Thus, although there is a large gain in computational efficiency from TIP3P explicit-solvent simulations to SEA, there is little loss in predictive accuracy for computing solvation free energies.
Fig. 4.
Scatter plots of (A) GB (13), (B) PB (53), and (C) SEA air–water ΔG transfer values against TIP3P calculations (10). If the single largest outlier (triacetylglycerol) in the GB and PB calculations is removed, the RMSEs decrease to 2.78 and 1.77 kcal/mol, respectively.
The PB and GB implicit-solvent models tend to solvate many of these molecules more favorably than SEA or explicit solvent. There are some exceptions where GB returns significantly less favorable solvation free energies than TIP3P, and these are nearly all molecules with buried amines, like piperazine and triethylamine. The balance of Born radii about amines has been recognized as a reason behind overly strong salt bridges in protein simulations using GB, and suggested corrections have included resizing the radii of atoms attached to these nitrogens to fit to explicit-solvent energetics (43). Both PB and SEA appear to avoid suffering from this issue.
Speed vs. Accuracy of SEA.
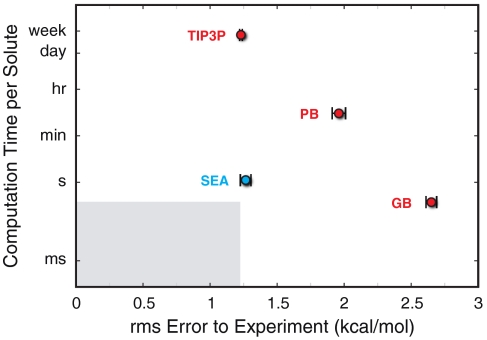
Fig. 5 compares the performance (computational speed per ligand vs. the RMSE free-energy accuracy to experiment) of the various computational methods applied to the test set of 504 small molecules described above. Although there are many different implicit-solvent implementations available, our test here is intended only as a general sketch, not an exhaustive and detailed comparison. Here is the range: TIP3P is about 108-fold slower than GB (the fastest method) in calculating solvation free energies. And, RMSE errors are about 2.8 kcal/mol in GB or 1.2 kcal/mol in TIP3P. SEA provides a good compromise. In SEA, RMSE errors are about 1.3 kcal/mol, but it is only 10-fold slower than GB*.
Fig. 5.
The average execution time per solute vs. the RMSE to experiment for calculations on the 504 small-molecule solute set. The vertical axis is a logarithmic scale. The light-gray region indicates the region of performance faster than GB and more accurate than TIP3P, a target realm for future solvent models.
Retrospective Analysis of Statistical Assessment of the Modeling of Proteins and Ligands (SAMPL) Blind-Test Solvation Predictions.
Recently, a community-wide blind prediction event for small-molecule solvation free energies, called SAMPL, has been run by OpenEye Software (44). The SEA method that we describe in this paper has not yet been tested in that event. (We tested an incomplete version without water dipoles or solute conformational sampling in SAMPL2.) Here, as a second-best alternative to a blind test, we retrospectively test the present SEA approach predictions on the solute molecules from both prior SAMPL events.
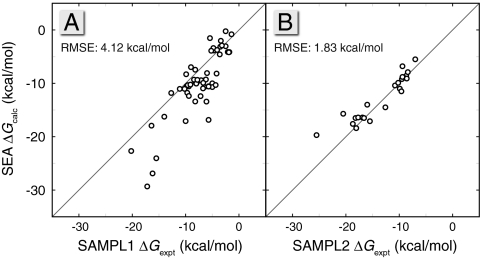
As we found in the other two comparisons above, the SEA model performs at about the same level of accuracy as the TIP3P model on which our model is based. Fig. 6A shows the calculated ΔG vs. experiment for the 56 SAMPL1 molecules. The resulting scatter is similar to that observed from explicit-solvent simulations (45). The RMSE of SEA vs. experiments is 4.1 kcal/mol, compared to 3.8 kcal/mol for TIP3P. Both SEA and explicit solvent have the same problems: They do not handle well molecules containing sulfur or phosphorus, a difficulty that is likely due to the GAFF force field parameters for these atom types (45).
Fig. 6.
The calculated ΔG from SEA vs. experimental values for the (A) 56 blind prediction molecules of the SAMPL1 event and the (B) 23 blind prediction molecules in the SAMPL2 event.
Fig. 6B shows 23 SAMPL2 molecules, and the RMSE for this small set is under 2 kcal/mol. The two largest outliers are d xylose and d glucose. For these sugars, SEA predicts solvation free energies that are 4 and 5 kcal/mol less favorable than experiments. Taken together with the alcohol comparisons in Fig. 3D, it suggests a problem in the chosen force field parameters for hydroxyl groups. Although it would be unfair to compare our current retrospective results with the prospective tests made by other groups in SAMPL, nevertheless the present tests indicate that SEA is comparable to the best current prediction methods. Because the SEA method does not involve the fitting of free parameters, it is reasonable to expect that SEA should perform with about the same RMSE accuracy as TIP3P simulations in such future tests.
SEA Fixes Some Physical Flaws in Implicit-Solvent Models.
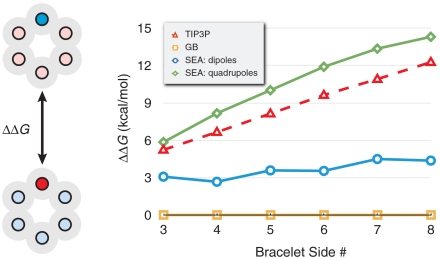
Because water’s dipole is asymmetric, it means that positively charged atoms of a given radius solvate less favorably than negatively charged atoms of the same radius (32–35, 46). Such asymmetries in the physics are not directly captured in implicit-solvent models. In implicit-solvent models, this asymmetry is handled instead by empirical readjustment of solvation radii. To understand this asymmetry more quantitatively, Mobley et al. created a series of polar molecules that they solvated in explicit solvent (35). Their fictitious benzene-like “bracelet” molecules were created to have either positive heads or negative heads and were otherwise net neutral. The difference in free energy of solvation of the positive-head bracelet and negative-head bracelet was found to be about 10 kcal/mol. Zero difference in free energy would have been expected from implicit-solvent models. This is a useful test set of molecules for exploring whether SEA water modeling is able to capture the asymmetry in solvation with solute charge.
Fig. 7 shows the results for bracelets of different size. Although SEA does capture the physics of the asymmetry, it underestimates the free-energy difference of the asymmetry. We find, however, that if we go beyond just using dipolar representation of water in SEA modeling and use a quadrupolar representation instead, the agreement with TIP3P simulations is improved. A quadrupole gives a better fit to the water response map around atoms having a formal negative charge, like the head atom on the negative bracelets. Interestingly, using the quadrupolar representation in SEA water on the 504 small-molecule set leads to no collective decrease in rms error with the experimental or the TIP3P results. This indicates that although the quadrupolar representation improves the calculation accuracy in select cases, the simpler and more computationally efficient dipolar representation captures much of the physics necessary for general applications.
Fig. 7.
The solvation asymmetry (ΔΔG) upon partial charge inversion for model polygons studied in ref. 35. In this case, one atom of each polygon has a formal charge, whereas the neutralizing counter charge is distributed evenly among the remaining atoms, as shown in the six-sided bracelet illustration on the left.
Conclusions
We have described a method, called SEA, for computing the free energies of solvation of solutes in water. SEA uses precomputations with some chosen explicit-solvation model and then assembles solvation shells of water in order to compute solvation free energies of arbitrary solutes. Here, we performed these precomputations using TIP3P water, though more complex models, such as polarizable water models, or nonaqueous solvents would also be practical. SEA aims to correct some of the physical deficits of traditional implicit-solvent models, such as water’s asymmetrical dipole, the lack of particulate water in the first solvation shell, and shape and microscopic interaction effects in nonpolar cavity formation. We have shown that SEA water predicts the solvation free energies for a range of nonpolar and polar small molecules at approximately the same accuracy as in TIP3P computer simulations, but it runs much faster than explicit simulations, much closer to the speeds of implicit-solvent models.
Computational Methods
Explicit Simulations.
The simulations of model spheres were performed using GROMACS 4.0.4 (47, 48). In these calculations, statistics for four spheres were accumulated simultaneously by bonding them in a tetrahedral geometry with 20-Å edge lengths between each particle. Partial charge values of these sites ranged from -1 to +1 in increments of 0.2, and they were assigned to each tetrahedron in a manner that kept the explicit simulation net neutral. Separate simulations were performed for different sets of Lennard–Jones parameters. Model sphere diameters included σ = 1.4, 2.2, 3.0, 3.8, 4.6, and 5.4 Å, whereas well depths included ϵ = 0.015625, 0.03125, 0.0625, 0.125, 0.25, and 0.5 kcal/mol. Each of the resulting 108 tetrahedral arrangements was solvated in a cubic box of TIP3P water with a 12-Å buffer of water between any solute particle and face of the simulation cell.
Each solvated tetrahedron was simulated under periodic boundary conditions in the isothermal-isobaric ensemble at 300 K and 1 atm using the Nose–Hoover thermostat and Parrinello–Rahman barostat with time constants of 1 and 10 ps, respectively. The dynamics were propagated with the leapfrog integrator with a timestep of 2 fs. The Lennard–Jones interactions were switched off between 8 and 9 Å, with long-ranged energy and pressure terms included. Smooth particle mesh Ewald (49) was used for electrostatics with a real-space cutoff of 10 Å, spline order of 4, Fourier spacing of 1.2 Å, and relative energy tolerance of 10-5. Trajectory snapshots were saved at 1-ps intervals for the postprocessing described in the main text.
To investigate the possible effects of the tetrahedral setup geometry, we tested cubic, linear, and even net-charged single point arrangements and found no statistically significant difference in the resulting solvent quantities.
Details of the Implementation.
Solvent-accessible surfaces for SEA calculations were constructed as described in our previous work (20). The surface detail was set to approximately 80 surface points per solute atom. The dielectric constant of the bulk surroundings was set to 78 for the reaction field term. A minimum of five semi-explicit configurations were sampled, and this iteration process was continued until the accumulated ΔGpol converged with an error of ∼0.05 kcal/mol.
Force Fields And Conformation Sampling.
The GAFF (50) was used to assign Lennard–Jones parameters for all of the small molecules. AM1-BCC partial charges (51) were assigned to initial minimized structures using the ANTECHAMBER program in AMBER (52). As these structures may not be the ideal representative structures of the molecules in solution, we generated short conformation ensembles for each from 500 ps of MD in explicit solvent using GROMACS 4.0 (47, 48). The results were clustered to obtain an average representation of the small molecule, and the partial charges were reassigned using this averaged conformation.
In the cases where conformation plays a role in the calculated transfer free energies, an ensemble of conformations is necessary to obtain an accurate estimation. We generated solute conformation ensembles from 5-ns explicit-solvent MD simulations with 2-, 20-, and 200-ps snapshot intervals for all small molecules investigated in this study. The various conformation sets all gave results that overlapped within error, so we used the ensembles generated from the MD simulations with 200-ps snapshot intervals (25 conformations) for maximum efficiency. The free energies reported for each solute from SEA and the implicit-solvent models come from averages over these 25 conformations.
Implicit-Solvent Calculations.
Implicit-solvent results were obtained for the PB and GB methods using the adaptive Poisson-Boltzmann solver (APBS) v 1.0 (53) and the Onufriev–Bashford–Case implementation of GB in AMBER 10 (13, 54) (igb = 5), respectively. As with the SEA and TIP3P calculations, atom Lennard–Jones parameters were assigned using GAFF with AM1-BCC partial charges. For the PB calculations, the nonpolar term was computed using the APBS dispersion incorporation method (18). The polar term was computed using the van der Waals surface as the dielectric boundary, and the PB equation was solved on a 65 × 65 × 65 grid with 0.25-Å spacing. In the GB calculations, γA was used for the nonpolar term with a γ of 5 cal mol-1 Å-2. Both the PB and GB calculations used a continuum dielectric of 78.
Supplementary Material
Acknowledgments.
The authors thank David Mobley (University of New Orleans) and Jordi Villà i Frexia (Parc de Recerca Biomèdica de Barcelona) for helpful discussions. The authors also appreciate the financial support provided by NIH Grant GM63592.
Footnotes
The authors declare no conflict of interest.
This article contains supporting information online at www.pnas.org/lookup/suppl/doi:10.1073/pnas.1017130108/-/DCSupplemental.
*Note, however, for speed comparisons that explicit simulations can automatically include multiple solute conformers, whereas other methods’ speed evaluations are per set of 25 conformers.
References
- 1.Silvestrelli PL, Parrinello M. Structural, electronic, and bonding properties of liquid water from first principles. J Chem Phys. 1999;111:3572–3580. [Google Scholar]
- 2.Sharma M, Resta R, Car R. Dipolar correlations and the dielectric permittivity of water. Phys Rev Lett. 2007;98:247401. doi: 10.1103/PhysRevLett.98.247401. [DOI] [PubMed] [Google Scholar]
- 3.Levy RM, Gallicchio E. Computer simulations with explicit solvent: Recent progress in the thermodynamic decomposition of free energies and in modeling electrostatic effects. Annu Rev Phys Chem. 1998;49:531–567. doi: 10.1146/annurev.physchem.49.1.531. [DOI] [PubMed] [Google Scholar]
- 4.Villa A, Mark AE. Calculation of the free energy of solvation for neutral analogs of amino acid side chains. J Comput Chem. 2002;23:548–553. doi: 10.1002/jcc.10052. [DOI] [PubMed] [Google Scholar]
- 5.Shirts MR, Pitera JW, Swope WC, Pande VS. Extremely precise free energy calculations of amino acid side chain analogs: Comparison of common molecular mechanics force fields for proteins. J Chem Phys. 2003;119:5740–5761. [Google Scholar]
- 6.MacCallum JL, Tieleman DP. Calculation of the water-cyclohexane transfer free energies of neutral amino acid side-chain analogs using the opls all-atom force field. J Comput Chem. 2003;24:1930–1935. doi: 10.1002/jcc.10328. [DOI] [PubMed] [Google Scholar]
- 7.Deng Y, Roux B. Hydration of amino acid side chains: Nonpolar and electrostatic contributions calculated from staged molecular dynamics free energy simulations with explicit water molecules. J Phys Chem B. 2004;108:16567–16576. [Google Scholar]
- 8.Hess B, van der Vegt NFA. Hydration thermodynamic properties of amino acid analogues: A systematic comparison of biomolecular force fields and water models. J Phys Chem B. 2006;110:17616–17626. doi: 10.1021/jp0641029. [DOI] [PubMed] [Google Scholar]
- 9.Mobley DL, Dumont E, Chodera JD, Dill KA. Comparison of charge models for fixed-charge force fields: Small-molecule hydration free energies in explicit solvent. J Phys Chem B. 2007;111:2242–2254. doi: 10.1021/jp0667442. [DOI] [PubMed] [Google Scholar]
- 10.Mobley DL, Bayly CI, Cooper MD, Shirts MR, Dill KA. Small molecule hydration free energies in explicit solvent: An extensive test of fixed-charge atomistic simulations. J Chem Theory Comput. 2009;5:350–358. doi: 10.1021/ct800409d. [DOI] [PMC free article] [PubMed] [Google Scholar]
- 11.Still WC, Tempczyk A, Hawley RC, Hendrickson T. Semianalytical treatment of solvation for molecular mechanics and dynamics. J Am Chem Soc. 1990;112:6127–6129. [Google Scholar]
- 12.Cramer CJ, Truhlar DG. An SCF solvation model for the hydrophobic effect and absolute free energies of aqueous solvation. Science. 1992;256:213–217. doi: 10.1126/science.256.5054.213. [DOI] [PubMed] [Google Scholar]
- 13.Onufriev A, Bashford D, Case D. Modification of the generalized born model suitable for macromolecules. J Phys Chem B. 2000;104:3712–3720. [Google Scholar]
- 14.Luo R, David L, Gilson MK. Accelerated Poisson-Boltzmann calculations for static and dynamic systems. J Comput Chem. 2002;23:1244–1253. doi: 10.1002/jcc.10120. [DOI] [PubMed] [Google Scholar]
- 15.Gallicchio E, Levy RM. AGBNP: An analytic implicit solvent model suitable for molecular dynamics simulations and high-resolution modeling. J Comput Chem. 2004;25:479–499. doi: 10.1002/jcc.10400. [DOI] [PubMed] [Google Scholar]
- 16.Tomasi J, Mennucci B, Cammi R. Quantum mechanical continuum solvation models. Chem Rev. 2005;105:2999–3093. doi: 10.1021/cr9904009. [DOI] [PubMed] [Google Scholar]
- 17.Rizzo RC, Aynechi T, Case DA, Kuntz ID. Estimation of absolute free energies of hydration using continuum methods: Accuracy of partial charge models and optimization of nonpolar contributions. J Chem Theory Comput. 2006;2:128–139. doi: 10.1021/ct050097l. [DOI] [PubMed] [Google Scholar]
- 18.Wagoner JA, Baker NA. Assessing implicit models for nonpolar mean solvation forces: The importance of dispersion and volume terms. Proc Natl Acad Sci USA. 2006;103:8331–8336. doi: 10.1073/pnas.0600118103. [DOI] [PMC free article] [PubMed] [Google Scholar]
- 19.Tan C, Tan Y-H, Luo R. Implicit nonpolar solvent models. J Phys Chem B. 2007;111:12263–12274. doi: 10.1021/jp073399n. [DOI] [PubMed] [Google Scholar]
- 20.Fennell CJ, Kehoe C, Dill KA. Oil/water transfer is partly driven by molecular shape, not just size. J Am Chem Soc. 2010;132:234–240. doi: 10.1021/ja906399e. [DOI] [PMC free article] [PubMed] [Google Scholar]
- 21.Papazyan A, Warshel A. Effect of solvent discreteness on solvation. J Phys Chem B. 1998;102:5348–5357. [Google Scholar]
- 22.Florián J, Warshel A. Calculations of hydration entropies of hydrophobic, polar, and ionic solutes in the framework of the Langevin dipoles solvation model. J Phys Chem B. 1999;103:10282–10288. [Google Scholar]
- 23.Marrink SJ, de Vries AH, Mark AE. Coarse grained model for semiquantitative lipid simulations. J Phys Chem B. 2004;108:750–760. [Google Scholar]
- 24.Izvekov S, Voth GA. Multiscale coarse-graining of mixed phospholipid/cholesterol bilayers. J Chem Theory Comput. 2006;2:637–648. doi: 10.1021/ct050300c. [DOI] [PubMed] [Google Scholar]
- 25.King G, Warshel A. A surface constrained allatom solvent model for effective simulations of polar solutions. J Chem Phys. 1989;91:3647–3661. [Google Scholar]
- 26.Beglov D, Roux B. Finite representation of an infinite bulk system: Solvent boundary potential for computer simulations. J Chem Phys. 1994;100:9050–9063. [Google Scholar]
- 27.Lounnas V, Lüdemann SK, Wade RC. Towards molecular dynamics simulation of large proteins with a hydration shell at constant pressure. Biophys Chem. 1999;78:157–182. doi: 10.1016/s0301-4622(98)00237-3. [DOI] [PubMed] [Google Scholar]
- 28.Im W, Bernèche S, Roux B. Generalized solvent boundary potential for computer simulations. J Chem Phys. 2001;114:2924–2937. [Google Scholar]
- 29.Lee MS, Salsbury FR, Jr, Olson MA. An efficient hybrid explicit/implicit solvent method for biomolecular simulations. J Comput Chem. 2004;25:1967–1978. doi: 10.1002/jcc.20119. [DOI] [PubMed] [Google Scholar]
- 30.Jorgensen WL, Chandrasekhar J, Madura JD, Impey RW, Klein ML. Comparison of simple potential functions for simulating liquid water. J Chem Phys. 1983;79:926–935. [Google Scholar]
- 31.Ashbaugh HS. Convergence of molecular and macroscopic continuum descriptions of ion hydration. J Phys Chem B. 2000;104:7235–7238. [Google Scholar]
- 32.Latimer WM, Pitzer KS, Slansky CM. The free energy of hydration of gaseous ions, and the absolute potential of the normal calomel electrode. J Chem Phys. 1939;7:108–111. [Google Scholar]
- 33.Hummer G, Pratt LR, García AE. Free energy of ionic hydration. J Phys Chem. 1996;100:1206–1215. [Google Scholar]
- 34.Rajamani S, Ghosh T, Garde S. Size dependent ion hydration, its asymmetry, and convergence to macroscopic behavior. J Chem Phys. 2004;120:4457–4466. doi: 10.1063/1.1644536. [DOI] [PubMed] [Google Scholar]
- 35.Mobley DL, Barber AE, II, Fennell CJ, Dill KA. Charge asymmetries in hydration of polar solutes. J Phys Chem B. 2008;112:2405–2414. doi: 10.1021/jp709958f. [DOI] [PMC free article] [PubMed] [Google Scholar]
- 36.Lee B, Richards RM. The interpretation of protein structures: Estimation of static accessibility. J Mol Biol. 1971;55:379–400. doi: 10.1016/0022-2836(71)90324-x. [DOI] [PubMed] [Google Scholar]
- 37.Connolly ML. Analytical molecular surface calculation. J Appl Cryst. 1983;16:548–558. [Google Scholar]
- 38.Onsager L. Electric moments of molecules in liquids. J Am Chem Soc. 1936;58:1486–1493. [Google Scholar]
- 39.Åqvist J. Ion-water interaction potentials derived from free energy perturbation slmulations. J Phys Chem. 1990;94:8021–8024. [Google Scholar]
- 40.Darden T, Pearlman D, Pedersen LG. Ionic charging free energies: Spherical versus periodic boundary conditions. J Chem Phys. 1998;109:10921–10935. [Google Scholar]
- 41.Fennen J, Torda AE, van Gunsteren WF. Structure refinement with molecular dynamics and a boltzmann-weighted ensemble. J Biomol NMR. 1995;6:163–170. doi: 10.1007/BF00211780. [DOI] [PubMed] [Google Scholar]
- 42.Bordner AJ, Cavasotto CN, Abagyan RA. Accurate transferable model for water, n-octanol, and n-hexadecane solvation free energies. J Phys Chem B. 2002;106:11009–11015. [Google Scholar]
- 43.Geney R, Layten M, Gomperts R, Hornak V, Simmerling C. Investigation of salt bridge stability in a generalized born solvent model. J Chem Theory Comput. 2006;2:115–127. doi: 10.1021/ct050183l. [DOI] [PubMed] [Google Scholar]
- 44.Guthrie JP. A blind challenge for computational solvation free energies: Introduction and overview. J Phys Chem B. 2009;113:4501–4507. doi: 10.1021/jp806724u. [DOI] [PubMed] [Google Scholar]
- 45.Mobley DL, Bayly CI, Cooper MD, Dill KA. Predictions of hydration free energies from all-atom molecular dynamics simulations. J Phys Chem B. 2009;113:4533–4537. doi: 10.1021/jp806838b. [DOI] [PMC free article] [PubMed] [Google Scholar]
- 46.Purisima EO, Sulea T. Restoring charge asymmetry in continuum electrostatics calculations of hydration free energies. J Phys Chem B. 2009;113:8206–8209. doi: 10.1021/jp9020799. [DOI] [PubMed] [Google Scholar]
- 47.Berendsen HJC, van der Spoel D, van Drunen R. GROMACS: A message-passing parallel molecular dynamics implementation. Comput Phys Commun. 1995;91:43–56. [Google Scholar]
- 48.Hess B, Kutzner C, van der Spoel D, Lindahl E. GROMACS 4: Algorithms for highly efficient, load-balanced, and scalable molecular simulation. J Chem Theory Comput. 2008;4:435–447. doi: 10.1021/ct700301q. [DOI] [PubMed] [Google Scholar]
- 49.Essman U, et al. A smooth particle mesh Ewald method. J Chem Phys. 1995;103:8577–8592. [Google Scholar]
- 50.Wang J, Wolf RM, Caldwell JW, Kollman PA, Case DA. Development and testing of a general amber force field. J Comput Chem. 2004;25:1157–1174. doi: 10.1002/jcc.20035. [DOI] [PubMed] [Google Scholar]
- 51.Jakalian A, Bush BL, Jack DB, Bayly CI. Fast, efficient generation of high-quality atomic charges. AM1-BCC model: I. Method. J Comput Chem. 2000;21:132–146. doi: 10.1002/jcc.10128. [DOI] [PubMed] [Google Scholar]
- 52.Wang J, Wang W, Kollman PA, Case DA. Automatic atom type and bond type perception in molecular mechanical calculations. J Mol Graph Model. 2006;25:247–260. doi: 10.1016/j.jmgm.2005.12.005. [DOI] [PubMed] [Google Scholar]
- 53.Baker NA, Sept D, Joseph S, Holst MJ, McCammon JA. Electrostatics of nanosystems: Application to microtubules and the ribosome. Proc Natl Acad Sci USA. 2001;98:10037–10041. doi: 10.1073/pnas.181342398. [DOI] [PMC free article] [PubMed] [Google Scholar]
- 54.Case DA, et al. San Francisco: University of California; 2008. AMBER 10. [Google Scholar]
- 55.Abraham MH, Whiting GS, Fuchs R, Chambers EJ. Thermodynamics of solute transfer from water to hexadecane. J Chem Soc Perk T 2. 1990:291–300. [Google Scholar]
Associated Data
This section collects any data citations, data availability statements, or supplementary materials included in this article.


