

Summary
Coordinated migration of newly born neurons to their prospective target laminae is a prerequisite for neural circuit assembly in the developing brain. The evolutionarily conserved LIS1/NDEL1 complex is essential for neuronal migration in the mammalian cerebral cortex. The cytoplasmic nature of LIS1 and NDEL1 proteins suggest that they regulate neuronal migration cell autonomously. Here, we extend mosaic analysis with double markers (MADM) to mouse chromosome 11 where Lis1, Ndel1, and 14-3-3ε (encoding a LIS1/NDEL1 signaling partner) are located. Analyses of sparse and uniquely labeled mutant cells in mosaic animals reveal distinct cell-autonomous functions for these three genes. Lis1 regulates neuronal migration efficiency in a dose-dependent manner, while Ndel1 is essential for a specific, previously uncharacterized, late step of neuronal migration: entry into the target lamina. Comparisons with previous genetic perturbations of Lis1 and Ndel1 also suggest a surprising degree of cell-nonautonomous function for these proteins in regulating neuronal migration.
Introduction
The assembly of functional neural circuits requires the segregation and interconnection of distinct classes of neurons. In the vertebrate central nervous system, a prevalent motif in neuronal organization is the coalescence of neuronal types into stratified layers or laminae (Ramon y Cajal, 1911). Coordinated migration of newly born neurons from their birthplace to their final position represents a fundamental mechanism to achieve lamination within all structures of the brain. In the past decades, distinct neuronal migration modes as well as a rich catalog of molecules controlling neuronal migration have been identified (Heng et al., 2010; Marin et al., 2010).
Neuronal migration and the laminar positioning of projection neurons within the mammalian neocortex has been intensely studied. Cortical layering occurs in an “inside-out” fashion whereby earlier born neurons occupy deep layers and successively later born neurons settle in progressively upper layers (Angevine and Sidman, 1961; Rakic, 1974). Upon radial glia progenitor cell (RGPC)-mediated neurogenesis, newborn migrating cortical projection neurons are bipolar-shaped in the ventricular zone (VZ) but then convert to a multipolar morphology within the subventricular zone (SVZ) and migrate into the intermediate zone (IZ). A switch from the multipolar state back to a bipolar morphology precedes radial glia-guided locomotion of projection neurons toward the cortical plate (CP), with the trailing process concomitantly developing into the axon. Once the neuron arrives in the CP, the leading process attaches to the pial surface and the neuron undergoes terminal somal translocation to reach its final location (Nadarajah et al., 2001; Noctor et al., 2004; Rakic, 1972; Tsai et al., 2005).
The importance of neuronal migration for cortical lamination is highlighted in patients that suffer from isolated lissencephaly sequence (ILS) or Miller-Diecker syndrome (MDS). Lissencephaly is characterized by a smooth brain surface with an absence or severe reduction of gyri, abnormal lamination, and thickening of the cerebral cortex. About 40% of ILS and virtually 100% of MDS cases occur due to the loss of one copy of the Lissencephaly-1 (LIS1, also known as PAFAH1B1) gene on human chromosome 17 (Reiner et al., 1993; Wynshaw-Boris, 2007). LIS1 is a central component of a protein complex, evolutionarily conserved from fungus to human, that regulates nuclear migration through the cytoplasmic microtubule motor dynein (Morris, 2000). In mice, reduced LIS1 activity results in severe defects in the radial migration of multiple types of neurons including neocortical projection neurons (Cahana et al., 2001; Gambello et al., 2003; Hirotsune et al., 1998; Tsai et al., 2005). NDEL1 (nuclear distribution gene E-like homolog 1) binds to both LIS1 and cytoplasmic dynein heavy chain (Niethammer et al., 2000; Sasaki et al., 2000). Ablation or knockdown of cortical NDEL1 function also results in impaired migration of neocortical projection neurons (Sasaki et al., 2005; Shu et al., 2004; Youn et al., 2009). NDEL1 is a substrate for the serine/threonine protein kinase CDK5 (Niethammer et al., 2000; Sasaki et al., 2000), which is also essential for cortical neuronal migration (Gilmore et al., 1998). The adaptor protein 14-3-3ε binds NDEL1 in a phosphorylation-dependent manner to maintain NDEL1 phosphorylation, which is important for binding to LIS1 and the dynein motor (Toyo-oka et al., 2003). Loss of one copy of 14-3-3ε (also known as YWHAE), which resides within the MDS deletion in human, enhances clinical symptoms of LIS1 heterozygosity in humans and neuronal migration defects in Lis1 heterozygous mice (Toyo-oka et al., 2003). Thus, the tripartite LIS1/NDEL1/14-3-3ε-complex is a key regulator of cortical neuronal migration (Wynshaw-Boris, 2007).
The coupling of the nucleus and centrosome mediated by the LIS1-complex is a key cell biological mechanism for neuronal migration (Marin et al., 2010; Vallee et al., 2009). The cytoplasmic nature of these proteins suggests that they function cell autonomously to regulate neuronal migration, but this has not been directly tested in vivo. Mice carrying homozygous null alleles die either at implantation (Lis1, Ndel1) or neonatal (14-3-3ε) stages (Hirotsune et al., 1998; Sasaki et al., 2005; Toyo-oka et al., 2003). Thus, previous studies addressing the in vivo functions of the LIS1-complex relied on the analysis of heterozygous or compound heterozygous animals where all cells were mutant, on conditional mutants or on RNAi knockdown approaches where large groups of neurons were affected. To assess the cell-autonomous in vivo function of Lis1, Ndel1, and 14-3-3ε, we applied the MADM (mosaic analysis with double markers) strategy (Zong et al., 2005) to knock out these genes in sparse subpopulations of neurons.
Results
Extension of MADM to Chromosome 11
The Lis1, Ndel1, and 14-3-3ε genes are located on Chr. 11 in the mouse. In order to perform mosaic analyses of these genes using the MADM strategy, we cloned the Hipp11 locus near the centromere of Chr. 11 to insert the “MADM cassettes” (Figures 1A, 1B, and 2A and Experimental Procedures). We replaced Dsred2 in the original chimeric MADM cassettes (Zong et al., 2005) with tandem dimer Tomato (tdT) (Shaner et al., 2004), inserted an FRT site 5′ to the LoxP site, and targeted these cassettes to the Hipp11 locus using homologous recombination in ES cells to produce MADM-11GT (GT: GFPN-term–tdTC-term) and MADM-11TG (TG: tdTN-term–GFPC-term) mice (Figure 1B).
Figure 1. Extension of MADM to Mouse Chromosome 11.

(A) The Hipp11 genomic locus in cytoband A1 (∼3 cM) between Eif4enif1 and Drg1 genes.
(B) Targeting of Hipp11 with GT and TG cassettes to generate MADM-11GT and MADM-11TG. Top panel shows the organization of the Hipp11 genomic locus. Grey boxes indicate exons 1 and 19 of the flanking gene Eif4enif1, and exons 1 and 9 of Drg1. Middle and bottom panels show the Hipp11 genomic locus with integrated GT and TG cassettes. LoxP (black triangles), FRT (rectangle), and the direction of transcription (green arrow) are indicated. Details about recombination products and reconstituted marker genes upon CRE/FLPe-mediated interchromosomal recombination can be found in Figures S1–S3.
(C–H) GFP (green in C–E and H; white in F) and tdT (red in C–E and H; white in G) expression in cortex and hippocampus in P21 MADM-11 mice. (C and H) Sparse MADM labeling of cortical pyramidal cells in MADM-11GT/TG;Rosa26FLPe/+ (C) or MADM-11GT/TG;Nestin-spCre+/− (H). (D) Overview of labeling pattern in MADM-11GT/TG;Emx1Cre/+. (E–G) Higher magnification of D (boxed area) illustrating CA3 pyramidal cells and mossy fiber projections from dentate gyrus granule cells. (I) Schematic depicts TM-mediated MADM-clone induction at E10 in MADM-11GT/TG;Nestin-CreER+/− in symmetrically dividing neuroepithelial stem cell (NESC). A G2-X event (see Figure S1 for a description of the MADM principle) results in two columns of green and red labeled neurons migrating along the processes of radial glia progenitor cells (RGPCs).
(J–M) A G2-X MADM clone in the cortex with neurons expressing GFP (green) and tdT (red), and migrating along RGPCs at E16 (J). Inset in (J) marks area shown in (K)–(M) and depicts red and green apical endfeet of MADM-labeled radial glia with migrating neurons in the VZ. Nuclei (D, J, and K) were labeled using DAPI (blue). CP, cortical plate; IZ, intermediate zone; SVZ, subventricular zone; VZ, ventricular zone; TM, Tamoxifen.
Scale bar, 100 μm (C); 1 mm (D); 30 μm (E–G and K–M); 70 μm (H and J). See also Figures S1 and S2.
Figure 2. MADM Analysis of Lis1, Ndel1, and 14-3-3ε in Somatosensory Cortex.

(A) Genomic location of MADM-11 and Lis1, Ndel1 and 14-3-3ε genes on Chr. 11. Physical and genetic distances to the centromere are indicated.
(B–E) MADM-labeled cells in P21 somatosensory barrel cortex in control-MADM (B; MADM-11GT/TG;Emx1Cre/+), Lis1-MADM (C; MADM-11GT/TG,Lis1;Emx1Cre/+), Ndel1-MADM (D; MADM-11GT/TG,Ndel1;Emx1Cre/+) and 14-3-3ε-MADM (E; MADM-11GT/TG, 14-3-3ε;Emx1Cre/+). In control-MADM (B), GFP+ (green), tdT+ (red), and GFP+/tdT+ (yellow) cells are all WT. In Lis1-, Ndel1-, and 14-3-3ε MADM (C–E), homozygous mutants are GFP+ (green), heterozygous cells are GFP+/tdT+ (yellow) or unlabeled (vast majority), and homozygous WT cells are tdT+ (red). Nuclei were stained using DAPI (blue). White star in (B) marks tdT+ cortical astrocytes. Arrows in (C) indicate sparse green Lis1−/− mutant neurons. Arrows in (D) point to Ndel1−/− astrocytes. Cortical layers are numbered in roman digits. WM: white matter. Scale bar, 150 μm.
(F) Quantification of green/red ratio of neurons (upper panel) and cortical astrocytes (lower panel) corresponding to respective genotypes in (B–E). No Lis1−/− mutant astrocytes were observed in any sample analyzed.
(G–J) Quantification of the relative distribution (%) of mutant green, heterozygote yellow and WT red neurons (upper panels) and astrocytes (lower panels) for genotypes corresponding to (B)–(E). Values represent mean ± SEM ns: nonsignificant, *p < 0.05, **p < 0.01, and ***p < 0.001.
See also Figures S2–S4.
In the absence of recombinase, we did not find any fluorescent cells in trans-heterozygous MADM-11GT/TG mice (data not shown). As predicted by the MADM scheme (Figure S1), introduction of Emx1Cre/+ (Gorski et al., 2002) produced fluorescently MADM-labeled (GFP only, tdT only, or GFP+/tdT+) cells restricted to the forebrain (Figures 1D–1G). MADM-11 labeling in isolated single cells (Figure 1H) can be induced using a specific Nestin-CreERT2 transgenic line (referred to as Nestin-spCre hereafter) where CRE recombinase is active in sparse, random subsets of neuronal progenitors without tamoxifen (TM) induction (line 1 in Imayoshi et al., 2006).
MADM-11 offers several advantages as a general tool for lineage tracing and labeling of single neurons over the original MADM at Rosa26 (Zong et al., 2005). First, like GFP, tdT allows visualization of the red fluorescence marker in live animals. Thus, genotypes of distinctly labeled cells in mosaic animals can be unequivocally determined before fixation and immunostaining. This property greatly improves physiological and imaging studies of live tissues in MADM animals. Second, tdT+ and GFP+ axonal projections (e.g., hippocampal mossy fibers; Figures 1D–1G) can be clearly traced without signal amplification by antibody staining. Third, the interchromosomal recombination rate in MADM-11 is markedly increased compared with the original MADM (data not shown). This allows for temporal control of clone induction in many areas of the brain, including the cerebral cortex, using TM-inducible Nestin-CreER (e.g., lines 4 and 5 in Imayoshi et al., 2006). As an example, we show a single G2-X clone (see Figure S1 available online for details) of MADM-labeled projection neurons in the neocortex, which was induced at embryonic day 10 (E10) by TM and analyzed at E16 (Figures 1I–1M). Fourth, FLPe recombinase (Farley et al., 2000) can also be used to drive interchromosomal recombination with MADM-11 (Figure 1C). Lastly, the location of the MADM cassettes allows > 99% of genes located on mouse Chr. 11 to be subjected to MADM-based mosaic analyses.
Lis1 Is Cell Autonomously Required for Cortical Neuron and Astrocyte Production
To genetically dissect the cell-autonomous functions of the Lis1, Ndel1, and 14-3-3ε genes, we generated separate recombinant MADMGT and MADMTG strains for null mutants of Lis1 (Hirotsune et al., 1998), Ndel1 (Sasaki et al., 2005) and 14-3-3ε (Toyo-oka et al., 2003), respectively (Figure S3A). These recombinants were crossed to mice that carried the reciprocal MADM cassette and a Cre recombinase transgene to generate experimental MADM animals (Figure S3A). We examined individual Lis1−/−, Ndel1−/−, and 14-3-3ε−/− projection neurons during neocortical development using Emx1-Cre expressed in cortical progenitors (Figure 2).
First, we analyzed the role of Lis1, Ndel1, and 14-3-3ε in cortical neuron production. We compared the number of homozygous mutant (green) and homozygous wild-type (WT; red) cells in the somatosensory cortex at postnatal day 21 (P21) (Figures 2B–2F). G2-X events allow the visualization of two progeny of the same mitosis with two distinct colors (Figure S1). If cell division were symmetric, the number of red and green cells within an isolated clone would be identical (see Figures 1I–1M). Even if the cell division were asymmetric such that red and green progeny numbers were different in individual clones, the random distribution of colors in asymmetric clones would ensure that the number of red and green progeny were equal overall, given a large enough number of independent G2-X events.
Indeed, the green/red ratio in control-MADM (MADM-11GT/TG; Emx1Cre/+) was not significantly different from 1 (Figures 2B and 2F). By contrast, in Lis1-MADM (MADM-11GT/TG,Lis1;Emx1Cre/+), the mutant/WT (green/red) ratio is drastically reduced to ∼0.1 (Figures 2C and 2F). These results indicate that LIS1 is required cell autonomously for production or survival of cortical neurons. A similarly low mutant/WT ratio in the cortex was also observed at P1 and P7 (Figures S4A and S4C; data not shown). These data indicate that LIS1 is not required for survival of neurons during the postnatal period, although we cannot rule out the possibility that LIS1 is required for survival of prenatal neurons (Gambello et al., 2003). In addition, no Lis1−/− astrocytes were observed (Figures 2C and 2F). The most likely interpretation for our results is that LIS1 is essential for cortical neural progenitor cell divisions (Tsai et al., 2005; Yingling et al., 2008), which give rise to both cortical projection neurons and astrocytes (Costa et al., 2009). A similar reduction in the number of Lis1−/− cells was evident in all brain areas analyzed, including the hippocampus, the olfactory bulb and the cerebellum (data not shown). Together, these findings suggest that LIS1 is cell autonomously required for production of most if not all neuronal classes. Indeed, LIS1 is also cell autonomously required for the production of neurons in the Drosophila brain (Liu et al., 2000), indicating that this is an evolutionarily conserved function.
In contrast to Lis1, the mutant/wt (green/red) ratio for Ndel1 and 14-3-3ε neurons and astrocytes was not significantly different from 1 (Figures 2D–2F) under identical experimental conditions. These results indicate that NDEL1 and 14-3-3ε are not cell autonomously required for proliferation of neural progenitors or survival of postmitotic neurons and astrocytes. One possible explanation for these divergent phenotypes could be genetic redundancy. For example, the function of NDEL1 in cell proliferation may be compensated for by NDE1, which shares 55% sequence homology with NDEL1; deletion of Nde1 results in mice with microcephaly (small brain), likely caused by a reduction in progenitor cell division (Feng et al., 2000; Feng and Walsh, 2004). Similarly, multiple isoforms of 14-3-3 are expressed in the brain (Takahashi, 2003) and distinct 14-3-3 isoforms may compensate for loss of 14-3-3ε function. Alternatively, LIS1 may act independently of NDEL1 or 14-3-3ε to regulate cell proliferation.
Lis1 and Ndel1 Display Distinct Cell-Autonomous Phenotypes in Cortical Neuron Migration
Next, we analyzed the role of Lis1, Ndel1, and 14-3-3ε in radial migration of cortical projection neurons. Since the vast majority of cells in Lis1-, Ndel1-, and 14-3-3ε-MADM mice are heterozygous for the respective gene to be analyzed, we can study the effect of gene dosage in addition to homozygous loss of each gene by comparing the layer distribution of homozygous mutant (green), heterozygous (yellow), and homozygous WT (red) cells in the same animals (Figures 2C–2E), and to control-MADM animals (Figure 2B). We quantified such distributions in the P21 somatosensory cortex (Figures 2G–2J).
Despite their stark reduction in number, we observed Lis1−/− neurons in all cortical layers, similar to corresponding Lis1+/− and Lis1+/+ in the same animals (Figure 2C), or WT controls in separate animals (Figure 2B). However, the numbers of both Lis1−/− and Lis1+/− neurons were significantly decreased in layers II/III but increased in layer VI compared to Lis1+/+ neurons (Figures 2C and 2H). Reduced numbers of Lis1−/− and Lis1+/− neurons in the uppermost layers of the cortex were evident from the earliest postnatal stages on (Figure S4). These data indicate that Lis1+/+ cells exhibit a cell migration advantage compared to Lis1+/− or Lis1−/− cells. Moreover, since Lis1+/+ cells reside in a largely heterozygous environment, these data indicate that the migration advantage of Lis1+/+ cells is cell autonomous.
Perhaps surprisingly, Lis1−/− neurons do not exhibit obvious defects when compared to Lis1+/− neurons. However, when examined at postnatal day 1 (P1), we found a significant accumulation of Lis1−/− cells in the white matter compared to Lis1+/− and Lis1+/+ cells, and a concomitant reduction of Lis1−/− cells in upper cortical layers (Figures S4A and S4B). The difference between Lis1−/− and Lis1+/− cells became non-significant at P7 (Figures S4C and S4D). These findings suggest that homozygous loss of Lis1 delays migration of cortical neurons, but that this defect is rescued later in development.
The distribution of Ndel1+/− neurons is similar to Ndel1+/+ neurons (Figures 2D and 2I) in the same mosaic or in control animals (Figures 2B and 2G), indicating that cortical neuronal migration is not sensitive to Ndel1 dosage. However, the vast majority (>85%) of Ndel1−/− neurons accumulated in the white matter below layer VI at P21 (Figures 2D and 2I), indicating a profound migration deficit in neurons lacking NDEL1 function. We observed similar migration deficits of cortical Ndel1−/− neurons in all major cortical areas (data not shown). Identical defects were seen when Ndel1−/− neurons were labeled with tdT instead of GFP (Figure S3D). The accumulation of Ndel1−/− neurons below layer VI was not caused by a developmental delay as this defect persisted in an 8 month old animal (data not shown). Because Ndel1−/− neurons are sparsely intercalated among the vast majority of unlabeled cells that are Ndel1+/− in these mosaic Ndel1 animals, this defect reflects a cell-autonomous function of NDEL1 in regulating cortical neuronal migration.
Interestingly, despite the severe neuronal migration defect, the layer distribution of Ndel1−/− cortical astrocytes was not significantly altered when compared to heterozygous or WT cells (Figures 2D and 2I). Thus, NDEL1 is selectively required cell autonomously for migration of cortical neurons but not astrocytes.
Contrary to the phenotypes observed with Lis1 and Ndel1 mutant neurons, 14-3-3ε−/−, 14-3-3ε+/−, and 14-3-3ε+/+ cells are distributed across layers II–VI similar to cells labeled in control-MADM (Figures 2E, 2G, and 2J). These data suggest that neither reduced dosage nor homozygous loss of 14-3-3ε in isolated cells causes any defects in cortical neuron migration. It is possible that distinct 14-3-3 isoforms may compensate for loss of 14-3-3ε function in neuronal migration.
Cell-Autonomous Function of Lis1, Ndel1, and 14-3-3ε in Hippocampal Neuronal Migration
We extended the MADM analysis of Lis1, Ndel1, and 14-3-3ε to the migration of hippocampal pyramidal neurons (Figure 3). CA1 pyramidal neurons are born in the hippocampal neuroepithelium and migrate radially toward the developing target layer where they settle in an inside-out fashion similar to the projection neurons in the neocortex (Altman and Bayer, 1990; Figure 3G). The positions of labeled CA1 pyramidal neurons in control-MADM are consistent with the normal migration pattern described above (Figures 3A and 3E). Likewise, the soma of Ndel1+/+ and 14-3-3ε+/+ or Ndel1+/− and 14-3-3ε+/− pyramidal cells were all located within the CA1 layer (Figures 3C and 3D, red and yellow). These data indicate that CA1 pyramidal neuron migration is not sensitive to the partial reduction of the Ndel1 or 14-3-3ε gene dosage, similar to our findings in cortical neurons. By contrast, the vast majority of Ndel1−/− CA1 (Figures 3C, 3E and 3G,) and CA3 (data not shown) pyramidal neurons accumulated at the base of the CA subfields. A significant fraction of 14-3-3ε−/− CA1 pyramidal neurons also failed to reach the CA1 layer but were scattered between the base and the CA1 cell layer (Figures 3D and 3E). These data indicate that both Ndel1 and 14-3-3ε are cell autonomously required for hippocampal pyramidal neuron migration, although the defect in 14-3-3ε−/− is milder than in Ndel1−/− neurons.
Figure 3. MADM Analysis of Lis1, Ndel1, and 14-3-3ε in the Hippocampus.

(A–D) MADM-labeled cells in P21 CA1 hippocampus in control- (A), Lis1- (B), Ndel1- (C), and 14-3-3ε- (D) MADM. Genotypes and fluorescent labeling are as depicted in Figure 2. The CA1 layer is indicated in (A) and double arrow indicates the distance of the CA1 field from the base of the hippocampus. White arrows in (B) mark ectopic CA1 cell masses. Green stars mark ectopic cells in (C) and (D). Scale bar, 50 μm.
(E) Relative distribution (%) of pyramidal cells within the CA1 layer (CA1) or at ectopic locations (ect. CA1) in control- (top), Ndel1- (middle), and 14-3-3ε- (bottom) MADM.
(F) Distance (μm) of CA1 pyramidal cell soma from the base of the hippocampus in CA1 in control-, Lis1-, Ndel1-, and 14-3-3ε-MADM. Values represent mean ± SEM ns: nonsignificant; **p < 0.01 and ***p < 0.001.
(G) Schematic summary of migration of WT (red) and Ndel1−/− (green) MADM-labeled hippocampal CA1 and CA3 pyramidal neurons (CA) and dGCs. Red WT CA1 and CA3 pyramidal neurons migrate radially and exit the ventricular zone to form the pyramidal cell layers (gray circles). Green Ndel1−/− CA1 and CA3 pyramidal neurons remain at the base of the CA1/CA3 subfields. Red WT dGCs migrate radially to different sublayers of the dentate gyrus granule layer (gray circles). Green Ndel1−/− dGCs accumulate at the hilus and at the base of the dentate granule cell layer but do not properly invade the target layer.
See also Figure S5.
LIS1 affects neuronal migration in a dose-dependent manner both in human and mice (Wynshaw-Boris, 2007). In Lis1-MADM animals, we observed significant heterotopia (ectopic “islands” of cells as revealed by DAPI staining; see also Hirotsune et al. [1998]) containing MADM-labeled CA1 pyramidal neurons (Figure 3B). Given these heterozygous effects, we could not clearly define the CA1 layer and determine the amount of ectopically located pyramidal cells in Lis1-MADM. We therefore quantified migration phenotypes in Lis1-MADM based on the distance of the pyramidal cell soma from the base of CA1 (Figure 3F). Interestingly, the average distance of Lis1+/− and residual Lis1−/− cells appeared equal (Figures 3B and 3F). However, Lis1+/+ cells were most often found at the “leading edge” of the CA1 pyramidal layer, with a fraction of Lis1+/+ cells migrating beyond the dense CA1 field (Figures 3B and 3F). Consequently, the average distance of Lis1+/+ soma from the base of CA1 was almost doubled when compared to Lis1+/− or Lis1−/− (Figure 3F). These data reinforced our findings in cortical neurons (Figure 2H), that two copies of normal Lis1 gene provide migrating Lis1+/+ cells with a competitive advantage cell autonomously over Lis1−/− and Lis1+/− cells.
The migration phenotypes of MADM-labeled dentate gyrus granule cells (dGCs) in control-, Lis1-, Ndel1-, and 14-3-3ε-MADM appeared strikingly similar to pyramidal neurons in the CA1 field and cortical projection neurons (Figure S5): Ndel1 is cell autonomously required for dGC migration; Lis1+/+ dGCs displayed an advantage over Lis1+/− and Lis1−/− cells, which exhibited indistinguishable migration behaviors; 14-3-3ε−/− dGCs had no detectable migration defects, similar to cortical neurons (Figure 2; see also Figure S6).
Ndel1 Is Essential for the Migration of Many Distinct Types of Neurons
Prior to this study, Ndel1 function in vivo in neuronal migration was analyzed mostly in cortical projection neurons and hippocampal neurons (Shu et al., 2004). The severe Ndel1−/− migration phenotype in MADM mice in both the cortex (Figures 2D and 2I) and hippocampus (Figure 3G) prompted us to expand the mosaic analysis of Ndel1 to other neuronal types. We focused on the olfactory bulb (OB; Figure 4) and the cerebellum (Figure 5) to test whether NDEL1 regulates a common step during the migration of distinct neuronal types.
Figure 4. Ndel1 Function is Essential for Migration of Olfactory Interneurons.
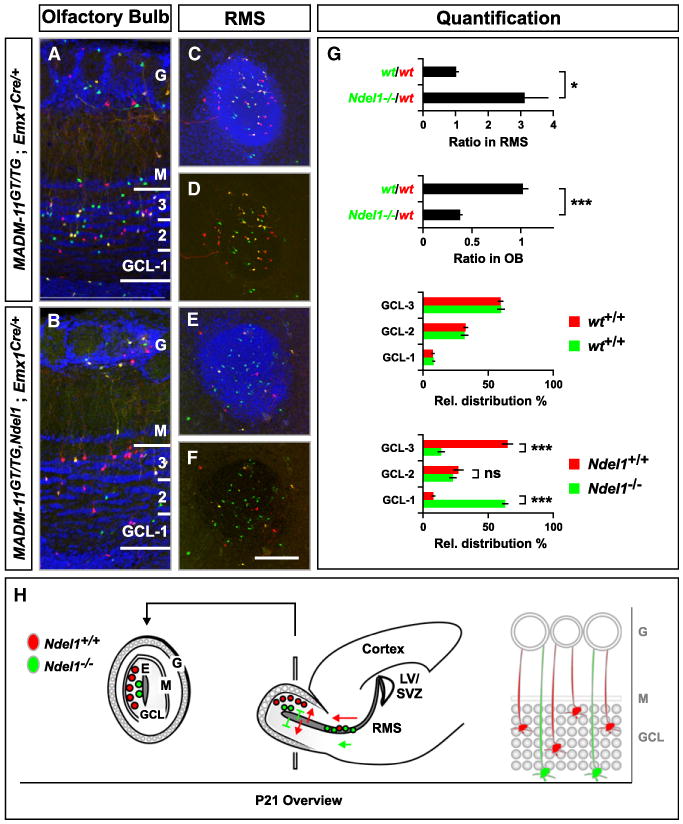
(A and B) Distribution of olfactory bulb interneurons (oINs) across the granule cell layer (GCL) in the P21 OB. Genotypes are indicated, Ndel1−/− cells labeled with GFP (green) and WT cells with tdT (red). Note the reduction of green Ndel1−/− cells in (B).
(C–F) Distribution of migrating oINs in cross sections of the RMS. Nuclei were stained using DAPI to outline the cytoarchitecture of the OB (A and B) and RMS (C and E). G, glomerular layer; M, mitral cell layer. Scale bar, 100 μm (A and B); 150 μm (C–F).
(G) Quantification of the green/red ratio in the RMS and the OB (upper panels) and the relative distribution (%) of oINs across three equal sectors in the GCL (lower panels). Values represent mean ± SEM ns: nonsignificant; *p < 0.05 and ***p < 0.001. (H) Schematic summary of migration of WT (red) and Ndel1−/− (green) MADM-labeled oINs. Red WT oINs originate from the subventricular zone of the lateral ventricle (SVZ/LV), migrate along the RMS to the OB, where oINs exit the RMS to migrate centrifugally to occupy different layers of the GCL. Green Ndel1−/− oINs accumulate along the RMS as indicated by the higher number of green circles in the RMS, and accumulate significantly closer to the ependymal layer (E) (extension of RMS) within the OB than red WT cells, suggesting a defect in migration in the target lamina (gray circles in the high magnification scheme on the right). G, glomerular layer; M, mitral cell layer; GCL, granule cell layer.
See also Figure S6.
Figure 5. Ndel1 Is Required for Migration of Cerebellum Purkinje and Granule Cells.
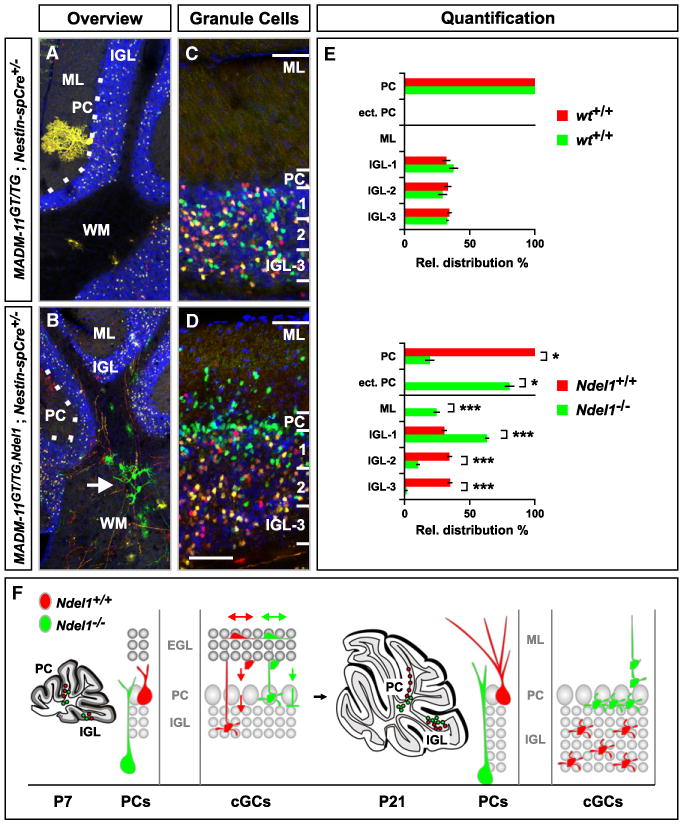
(A–D) Distribution of Purkinje cells and cGCs in P21 cerebellum. Genotypes are indicated, Ndel1−/− cells labeled with GFP (green) and WT cells with tdT (red). (A and B) Central part of the cerebellum with the white matter (WM), Purkinje cell (PC) layer (white dotted line), internal granule cell layer (IGL) and molecular layer (ML) labeled. Ndel1−/− Purkinje cells are mostly localized in the white matter (B, white arrow). See Figure 8F for high-resolution image of Ndel1−/− Purkinje cell. (C and D) Distribution of cGCs in control- (C) and Ndel1-MADM (D). Scale bar, 150 μm (A and B); 60 μm (C and D).
(E) Quantification of Purkinje cell distribution (%) in the PC layer or in ectopic locations (ect. PC), and cGCs across the molecular (ML) and internal granule layer (IGL), in control- (upper panel) and Ndel1-MADM (lower panel). The IGL was divided into three equal sectors for quantification of the relative distribution of cGCs. Values represent mean ± SEM ns: nonsignificant; *p < 0.05 and ***p < 0.001.
(F) Schematic summary of migration of WT (red) and Ndel1−/− (green) cerebellar Purkinje cells and cGCs. cGCs are born at the most superficial sublayer of the external granule layer (EGL) during the first 3 postnatal weeks (left panel). Nascent WT cGCs migrate inward across the ML, pass the PC layer, and settle throughout the IGL (small gray circles representing the final positions of cGCs). Most Ndel1−/− cGCs also migrate across the ML, but a fraction fails to pass the PC layer. Ndel1−/− cGCs that pass the PC layer accumulate at the most superficial sublayer of the IGL.
See also Figure S6.
OB interneurons (oINs) are mostly GABAergic and migrate tangentially from the SVZ of the lateral ventricle along the rostral migratory stream (RMS) to the OB (Lledo et al., 2008; Lois and Alvarez-Buylla, 1994). After reaching the OB, oINs exit the RMS and migrate centrifugally to occupy different layers within the OB (Figure 4H). We found Ndel1−/− oINs along the entire RMS and within the OB. However, the distribution of Ndel1−/− cells differed significantly from Ndel1+/+ cells (Figures 4A–4F). The ratio of the total number of green/red (mutant/WT) cells within the central segment of the RMS (∼600–800 μm) was increased ∼3-fold compared to the ratio of green/red (WT/WT) cells in control-MADM, indicating that Ndel1−/− oINs accumulate in the RMS. Correspondingly, the ratio of green/red neurons in Ndel1-MADM was reduced ∼3-fold in the OB granule cell layers compared to control-MADM (Figure 4G). Furthermore, Ndel1−/− oINs that have exited the RMS migrated significantly shorter distances within the OB when compared to Ndel1+/+ in the same mosaic animal (Figure 4G). Similar results were obtained when mosaic brains were examined at P6/7 (data not shown). Thus, Ndel1−/− oINs accumulate along the RMS and in the most central granule cell layers within the OB, indicating a general migration defect along the entire path (Figure 4H).
Cerebellar Purkinje cells normally occupy a single layer in the cerebellar cortex (Figures 5A and 5F) as a consequence of radial migration from the ventricular zone outward around the time of birth (Altman and Bayer, 1997; Miale and Sidman, 1961). We used Nestin-spCre to analyze MADM-labeled cerebellar Purkinje cells, which were readily identifiable on the basis of their large cell bodies and characteristic dendritic trees. We found that >80% of Ndel1−/− Purkinje cells were located within the cerebellar white matter at P21 (Figures 5B and 5E), indicating a severe migration defect.
Cerebellar granule cells (cGCs) exhibit a unique migration path. In the embryo, cGC progenitors migrate from the rhombic lip to occupy the surface of the developing cerebellar cortex. During the first 3 postnatal weeks, cGC progenitors proliferate in the outer external granule layer (EGL) at the surface of the cerebellar cortex. Postmitotic cGCs then migrate radially inward, passing the already-formed Purkinje cell layer and eventually settle within the internal granule layer (IGL) (Figure 5F; Altman and Bayer, 1997; Miale and Sidman, 1961). At P21, all labeled cGCs in control-MADM as well as red Ndel1+/+ and yellow Ndel1+/− cells in Ndel1-MADM had completed neurogenesis and migration, and all Ndel1+/+ and Ndel1+/− cGCs were located within and throughout the IGL (Figures 5C and 5D). By contrast, a significant fraction of Ndel1−/− cells was observed within the deep molecular layer (derivative of the EGL). Ndel1−/− cGCs that did migrate past the Purkinje cell layer accumulated within the most superficial layer of the IGL next to the Purkinje cells (Figures 5D and 5E). The marked accumulation of Ndel1−/− cGCs at the border between the Purkinje cell layer and the IGL indicates that the majority of Ndel1−/− cGCs can complete the initial migration from their site of birth and past the molecular and even the Purkinje cell layer, but accumulate at the border of their final destination, the IGL. In conclusion, we infer from the analyses of six distinct neuron types that NDEL1 is generally required cell autonomously for neuronal migration. However, it appears that not all phases of the migration process are equally blocked in Ndel1−/− neurons.
Ndel1 Regulates Cortical Neuron Entry into the Developing Cortical Plate
To identify the critical step in neuronal migration controlled by NDEL1, we traced the developmental origin of the migration defects in Ndel1−/− neurons. We focused mosaic analyses on the development of the neocortex because the cortical lamination process with sequential inside-out layering has been well characterized and can be traced unambiguously by costaining with a nuclear marker.
We used Emx1-Cre for time course MADM analyses. Starting at E12, the distribution of migrating Ndel1−/− neurons across the developing cortex in the VZ and developing preplate (PP) did not differ from WT neurons (Figures 6A and 6B). This finding indicates that somal translocation, the predominant migration mode of early born neurons (Nadarajah et al., 2001), is not affected by loss of Ndel1. By E14, a thin CP has formed. The fraction of Ndel1−/− neurons located within the nascent CP was significantly decreased when compared to the fraction of control neurons. Instead, Ndel1−/− cells showed a tendency to accumulate at the upper edge of the IZ (Figures 6C, 6D, and 6R). This phenotype became more pronounced at E16, when Ndel1−/− neurons accumulated specifically below the developing CP in the upper IZ (Figures 6E, 6F, and 6S). This migration deficit persisted at P1 when Ndel1−/− neurons were still found to accumulate below layer VI, in the region that becomes the white matter at later stages (Figures 6G, 6H, and 6T; see also Figures 2D, S3C, and S3D). These results suggest that Ndel1−/− neurons can migrate through the VZ and the IZ but not within the developing CP.
Figure 6. Ndel1 Cell Autonomously Regulates Cortical Neuron Migration into the Cortical Plate.

(A–H) Time course analysis of migration pattern of MADM-labeled cortical projection neurons using in control- (A, C, E, and G) and Ndel1-MADM (B, D, F, and H) at E12 (A and B), E14 (C and D), E16 (E and F) and P1 (G and H). Genotypes are indicated, Ndel1−/− cells labeled with GFP (green) and WT cells with tdT (red).
(I–P) Clonal analysis in MADM-11GT/TG,Ndel1;Nestin-CreER+/− embryonic cortex. (I–L) TM was applied at E10 (TM/E10) and sample analyzed at E16 (A/E16). G2-X clone is illustrated with Ndel1+/+ cells (red in I and L; white in J) and Ndel1−/− cells (green in I and L; white in K). White star marks the border of the cortical plate where Ndel1−/− cells accumulate. (M–P) Time course of clonal analysis in MADM-11GT/TG,Ndel1;Nestin-CreER+/− with TM applied at E8 (M) or E10 (N–P) and samples analyzed at E14 (M and N), E16 (O) and E18 (P). Scale bar, 30 μm (A and B); 60 μm (C and D); 100 μm (E, F, I–L, O, and P); 150 μm (G and H); 50 μm (M and N).
(Q–U) Quantification of ratio of green/red cells (Q) and relative distribution (%) of red and green cells in the VZ/SVZ, IZ, and CP (R–U). Genotypes (top) indicate control-MADM (left column) and Ndel1-MADM (right column) using Emx1Cre/+ at E14 (R), E16 (S), and P1 (T) or Nestin-CreER+/− (TM/E10; A/E16) (U). Values represent mean ± SEM ns, nonsignificant; *p < 0.05 and ***p < 0.001.
Because the MADM analysis described so far was performed with constitutive Emx1-Cre or Nestin-spCre (not shown), the exact timing of CRE-mediated mitotic recombination (and hence the removal of the Ndel1 gene) for any given labeled neuron was unknown. Accordingly, we next carried out temporally controlled clonal MADM analyses using TM-inducible Nestin-CreER. Cortical clones were induced at E10, when the vast majority of RGPCs divide symmetrically (Götz and Huttner, 2005), and analyzed at E16. Individual G2-X MADM-clones appeared as differentially labeled radial columns with an equal number of red WT and green Ndel1−/− migrating neurons (Figures 6I–6L and 6Q; see also Figures 1J–1M for an example of WT G2-X clone). These results directly confirmed our earlier finding that loss of Ndel1 does not affect neuron production. In all MADM clones, the developing CP was populated by ∼50% of red control cells. By contrast, the fraction of Ndel1−/− cells in the CP was reduced to ∼10% of all cells; instead, the number of Ndel1−/− neurons in the upper IZ was significantly increased (Figure 6U). Notably, the number of Ndel1+/+ and Ndel1−/− neurons in the VZ/SVZ was not significantly different (Figure 6U), indicating that both Ndel1−/− and Ndel1+/+ neurons migrate equally across the VZ/SVZ. Further examples whereby clones were induced at E8 or E10 and examined at E14, E16, and E18 (Figures 6M–6P) also demonstrated that Ndel1−/− neurons migrate normally within the VZ/SVZ and across the IZ, but fail to enter or migrate within the developing CP.
Taken together, the developmental studies and clonal analyses indicate that Ndel1 is not cell autonomously required for migration of cortical neurons within the VZ/SVZ and IZ. The primary defect in Ndel1−/− neurons appears to be an inability to enter or migrate within the CP, which represents the target lamina for cortical projection neurons.
Live Imaging Reveals a Specific Block of Ndel1−/− Projection Neurons in Cortical Plate Entry
Our results from sparse mosaic knockout are markedly different from the findings in conditional Ndel1 mutants: upon conditional ablation of Ndel1 in most or all cells in the cortex, migration of Ndel1−/− neurons is completely abolished (Youn et al., 2009). To compare these two conditions (most cells versus sparse single cells mutant for Ndel1), we performed live imaging experiments of MADM-labeled neurons in organotypic slice preparations similar to those used previously in Ndel1 cortical conditional knockout experiments (Youn et al., 2009). We traced embryonic cortical slices from control- and Ndel1-MADM E14.5 brains over the course of up to 15 hr (Figures 7 and S7). We found that the average migration speed of Ndel1−/− neurons within the IZ was not significantly different from Ndel1+/+ neurons in the same slices (Figures 7A–7H and 7Q) or in slices from control-MADM (Figure S7A–S7H). These data are consistent with the developmental time course analysis (Figure 6), indicating that NDEL1 is not cell autonomously required for migration of cortical projection neurons within the IZ.
Figure 7. Live Imaging of MADM-Labeled Ndel1−/− Cortical Projection Neurons.
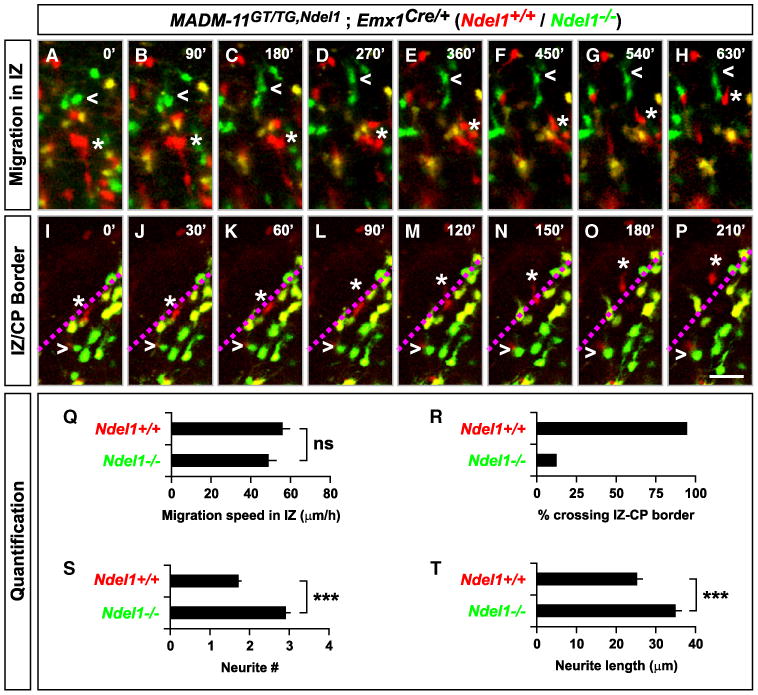
(A–P) Time-lapse images of migrating cortical projection neurons in the IZ (A–H) and at the border to the CP (I–P) in organotypic cortical slices derived from Ndel1-MADM (MADM-11GT/TG,Ndel1;Emx1Cre/+) mice at E14.5. Open arrowheads mark Ndel1−/− cells (GFP, green) and stars mark Ndel1+/+ control cells (tdT, red). The border between the IZ and CP is indicated as dotted line in magenta (I–P). Frames are every 90′ (A–H) and 30′ (I–P). Scale bar, 50 μm (A–H); 40 μm (I–P). (Q–T) Quantification of (Q) migration speed in IZ (n = 33 each for Ndel1+/+ and Ndel1−/− cells each); (R) fraction of labeled cells crossing the IZ-CP border (n = 19, 24 for Ndel1+/+ and Ndel1−/− cells, respectively); (S) number of neurite branches (n = 58 each for Ndel1+/+ and Ndel1−/− cells); (T) neurite length of migrating cells in IZ (n = 51, 65 for Ndel1+/+ and Ndel1−/− cells, respectively). Values in (Q), (S), and (T) represent mean ± SEM; ns, nonsignificant; ***p < 0.001. See also Figure S7 and Movies S1 and S2.
We also identified slices where the border between the IZ and CP was readily identifiable, quantified the behavior of migrating cells when they encountered this IZ-CP border (Figures 7I–7P; Movie S2) and compared to similar experiments performed with control-MADM (Figures S7I–S7P; Movie S1). Whereas 94% of migrating Ndel1+/+ neurons readily crossed the border, 87% of migrating Ndel1−/− neurons failed to traverse the IZ-CP border (Figure 7R). Interestingly, Ndel1−/− neurons displayed significantly increased neurite numbers and elevated neurite length (Figures 7S and 7T). The propensity to form multiple neurites in Ndel1−/− cells is likely to interfere with neuronal migration (Youn et al., 2009) and therefore might contribute to the failure of Ndel1−/− to enter the CP.
These results directly confirm that Ndel1−/− neurons in sparse genetic mosaics in a mostly heterozygous environment can migrate through the VZ/SVZ and the IZ. They also suggest that the inability of Ndel1−/− mutant neurons to migrate in the developing cortex in the Ndel1 cortical conditional knockout mice is a consequence of cell-nonautonomous effects.
Dendrite Morphogenesis and Axonal Projections of Ndel1−/− Neurons
The MADM-labeling strategy afforded high-resolution examination of the morphological differentiation of Ndel1−/− neurons at ectopic sites and provided an opportunity to determine the extent to which dendrite morphogenesis and axon projection relies on neurons entering their appropriate target layers. In principle, we cannot distinguish whether abnormal morphogenesis is a secondary consequence of aberrant neuronal positioning or reflects independent NDEL1 functions. However, we can deduce that any normal aspects of development must be independent of appropriate neuronal position.
We first analyzed the dendritic arbors of ectopically localized neurons in the cortex, hippocampus, and cerebellum. Remarkably, mislocalized projection neurons established dendritic trees that resembled cell type-specific patterns. For cortical and hippocampal pyramidal neurons, except for some dilation at the base of apical dendrites and at axon initial segments (Figures 8B and 8D), the apical dendrites of Ndel1−/− cortical and hippocampal projection neurons appeared indistinguishable from those of control neurons, despite ectopic cell body location (Figures 3A, 3C, 8A–8D, and S8B). Ndel1−/− CA1 pyramidal neurons extend apical dendrites across the entire CA1 field. Given their origin at a more basal level, these primary apical dendrites are therefore longer than those of control neurons (Figure S8). These data indicate that growth of the apical dendrite in pyramidal neurons is not affected by abnormal locations of their cell bodies. Similar results were observed in 14-3-3ε−/− and Lis1−/− neurons (Figure S8).
Figure 8. Dendrite Morphogenesis and Axonal Projections of Ndel1−/− Neurons.

(A–F) Morphology and dendrite pattern of pyramidal cells in the cortex (A and B), in the CA3 layer of the hippocampus (C and D), and in Purkinje cells of the cerebellum (E and F) in control- (A, C, and E) and Ndel1-MADM (B, D, and F). Genotypes of green and red cells are shown below each panel. All images are from P21 animals with the following genotypes: MADM-11GT/TG;Emx1Cre/+ (A and C); MADM-11GT/TG,Ndel1;Emx1Cre/+ (B and D); MADM-11GT/TG;Nestin-spCre+/− (E); MADM-11GT/TG,Ndel1;Nestin-spCre+/− (F). Arrows in (A and B) point to basal segments of pyramidal cells in the cortex; white stars (A, B, and D) mark apical dendrites in pyramidal cells in the cortex (A and B) and CA3 hippocampus (D). ML, molecular layer; PC, Purkinje cell layer; IGL, internal granule layer.
(G–R) Axonal projections in control- and Ndel1-MADM using Emx1Cre/+. (G–J) Corticothalamic projections in thalamus at P21 (G and H) and P1 (I and J). Inset in (G and H) are higher magnification images highlighting axonal varicosities in Ndel1−/− corticothalamic projections. Inset in (J) highlights red Ndel1+/+, yellow Ndel1+/−, and green Ndel1−/− nascent growing axons in P1 thalamus.
(K–P) Time course of axonal projections in the internal capsule in control- (K, M and O) and Ndel1-MADM (L, N and P) at P1 (K and L), P7 (M and N) and P21 (O and P). Note the progressive increase in number and size of axonal varicosities as marked by white arrows (N and P) in green Ndel1−/− mutant subcortical projections. (Q and R) Hippocampal efferents in the fornix in control- (Q) and Ndel1-MADM (R) at P21. White arrow in (R) marks accumulation of varicosities from green Ndel1−/− axons.
Scale bar, 30 μm (A–D); 50 μm (E and F); 230 μm (G, H, and M–P); 200 μm (K and L); 110 μm (I, J, Q, and R). See also Figures S8 and S9.
In the cerebellum, Purkinje cells were readily identified by their characteristic dendritic tree despite their ectopic cell body locations in the white matter (Figure 5B; data not shown). This observation indicates a certain degree of cell-autonomous dendrite development despite a lack of contact with their major presynaptic partners, the cGC axons. However, Purkinje cells displayed a drastic reduction in dendritic branching. Occasionally, ectopic Ndel1−/− Purkinje cells were located at the base of the IGL (Figure 8F). In such cases, Purkinje cells projected their dendrites outward toward the molecular layers and axons in the opposite direction toward the white matter. However, these mispositioned Purkinje cells showed disrupted dendritic branching patterns within the granule cell layer. Interestingly, the dendritic tree became more elaborate once it extended into the molecular layer, where the branches could presumably contact cGC axons (Figure 8F). These results support the general idea that cell-intrinsic programs and external cues act together to regulate dendrite morphogenesis (Scott and Luo, 2001).
Next, we examined axonal projections in ectopic Ndel1−/− neurons, focusing on efferent axons of cortical and hippocampal projection neurons. We found that Ndel1−/− axons reached the thalamus (Figures 8G and 8H) and other subcortical areas (data not shown), similar to Ndel1+/− and Ndel1+/+ axons in the same mosaic animals. Tracing of nascent axons within the thalamus at P1 revealed no differences in the patterning or projection of developing WT or Ndel1−/− axons (Figures 8I and 8J). Since the vast majority of Ndel1−/− cortical neurons failed to migrate into cortical layers and were located ectopically in the white matter (Figures 2D, 2I, S3C, and S3D), these data suggest that migration into the correct layer is not a prerequisite for establishing the correct long-range axonal projections, at least at a gross level.
As development progressed, abnormalities in axons of Ndel1−/− neurons became apparent. At P21, we found axonal swellings specific to Ndel1−/− axons in the thalamus (green varicosities in Figure 8H). Aberrant axonal swellings were also present in corticospinal projections (data not shown) but were most prominent within the internal capsule (IC), a narrow path between the telencephalon and the midbrain containing axons projecting both to and from the cortex. A developmental time course indicated that the appearance of axonal swellings in Ndel1−/− neurons is age dependent within the IC (Figures 8K–8P). We also traced hippocampal efferents in the fornix, a major axonal output pathway of hippocampal projection neurons. Similar to cortical projection neurons, axons of Ndel1−/− hippocampal projection neurons reached the fornix but exhibited aberrant swellings (Figure 8R; data not shown). Importantly, these axonal swellings were never observed in control-MADM animals (Figures 8G, 8I, 8K, 8M, 8O, and 8Q), and were entirely axonal in nature (Figure S9). These axon phenotypes in Ndel1−/− neurons may reflect an independent role of NDEL1 in maintaining axonal integrity, consistent with previous studies showing that NDEL1 regulates neurofilament organization (Nguyen et al., 2004), which is essential for the maintenance of axonal structures (Fuchs and Cleveland, 1998).
In summary, our analysis of dendrite morphogenesis and axonal projections of Ndel1−/− neurons indicates that certain aspects of neuronal morphogenesis, such as neuronal polarity, gross dendritic growth and patterning, and long-range axonal projections, are not strictly dependent on neurons occupying their correct target location. However, ectopically located neurons exhibit significant defects in dendrite morphogenesis and axonal integrity. Whereas some aspects may be a secondary consequence of migration defects (e.g., Purkinje cell dendrites not able to reach their target molecular layers), others may reflect additional functions of NDEL1.
Discussion
Genetic mosaic analysis is a powerful tool to tease apart cell-autonomous and nonautonomous functions of genes in regulating developmental processes. Mosaic analysis has also been used extensively in neurobiology, for example, to identify the contribution of individual neurons to the organismal circadian clock (Low-Zeddies and Takahashi, 2001) or to elucidate the cell-autonomous function of the NMDA receptor in dendritic patterning (Espinosa et al., 2009). Here, we extended the MADM genetic mosaic tool to mouse chromosome 11 and analyzed the functions of LIS1 and NDEL1 in neuronal migration. The LIS1/NDEL1 complex is considered part of the basic machinery for neuronal migration that couples the nucleus and centrosome. Given that both LIS1 and NDEL1 are cytoplasmic proteins, the prediction would be that they should act cell autonomously to regulate all steps of migration. However, our mosaic analysis reveals a far more complex picture and provides novel insights into the cell-autonomous and nonautonomous functions of LIS1 and NDEL1 in regulating neuronal migration (Figure 9).
Figure 9. Cell-Autonomous and Nonautonomous Functions of LIS1 and NDEL1 in Neuronal Migration.
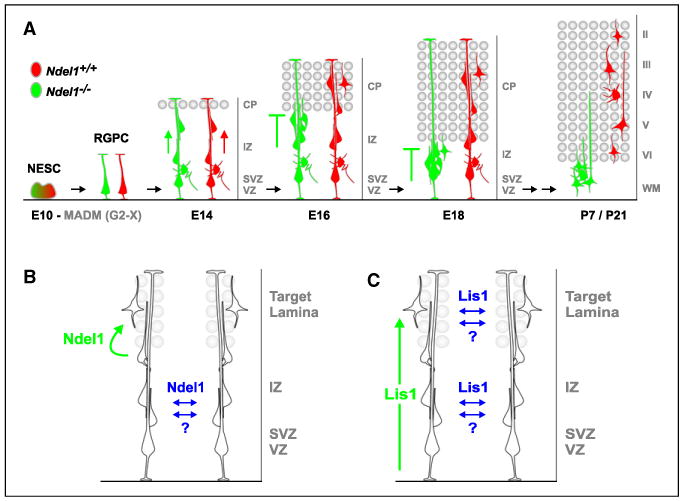
(A) Schematic summary of migration of WT (red) and Ndel1−/− (green) MADM-labeled cortical projection neurons illustrating the cell-autonomous function of NDEL1 to control invasion into the cortical plate, their target lamina. WT neurons exit the VZ, migrate across the IZ (red arrow), and into the CP along the RGPC fiber, settling within distinct layers of the cortex according to their birth date. Ndel1−/− neurons migrate out of the VZ and across the IZ (green arrow), but fail to migrate into the CP (−|), representing the target lamina (gray circles) for cortical projection neurons. Ndel1−/− neurons accumulate below the expanding CP during embryogenesis and eventually remain ectopically located in the white matter (WM) at postnatal stages.
(B and C) Models of cell-autonomous (green) and nonautonomous (blue) in vivo functions of NDEL1 (B) and LIS1 (C) in the developing brain. NDEL1 cell autonomously controls invasion and/or migration within developing target laminae. LIS1 cell autonomously regulates the efficiency of neuronal migration in a dose-dependent manner. In addition, extensive interactions among migrating neurons, either mediated by specific cell-nonautonomous effects of LIS1/NDEL1 or through a general community effect, promote migration of Ndel1−/− cells before reaching the target laminae and Lis1−/− cells along the entire path under sparse knockout conditions.
Although the adult phenotypes of Ndel1−/− neurons support the previously established role of NDEL1 in regulating neuronal migration (Sasaki et al., 2005; Shu et al., 2004), our developmental analyses indicate that NDEL1 is not cell autonomously required for all aspects of neuronal migration. Using MADM-mediated sparse knockout and labeling in fixed brains as well as live imaging, we found that Ndel1−/− neurons migrate normally within the VZ/SVZ and IZ similar to WT neurons. The first defect we observed when comparing Ndel1−/− and Ndel1+/+ neurons in the same mosaic animal was the accumulation of Ndel1−/− neurons at the border of the developing CP (Figures 9A and 9B). This selective defect is unlikely caused by perdurance of Ndel1 mRNA or protein in Ndel1−/− neurons (see Supplemental Experimental Procedures). Since the CP represents the target lamina for migrating cortical projection neurons, we propose that a major cell-autonomous function of NDEL1 in neurons is to regulate the entry into the target laminae (Figures 9A and 9B).
We have extended the analysis of Ndel1 to migration of excitatory and inhibitory neurons including hippocampal pyramidal cells and dentate granule cells (Figure 3G), cerebellar Purkinje cells and granule cells (Figure 5F) and olfactory bulb interneurons (Figure 4H). NDEL1 is cell autonomously required for the migration of all these neurons, and their migration phenotypes strongly support our central hypothesis that NDEL1 regulates the entry into the target lamina. For example, Ndel1−/− cerebellar granule cells migrate normally across the molecular layer of the cerebellar cortex but are accumulated near the Purkinje cell layer before entering into the granular layer, the target lamina for granule cells (Figure 5F).
Mechanistically, NDEL1 could exert this cell-autonomous function of controlling target lamina entry by transducing an extracellular signal to the intracellular neuronal migration machinery. Interestingly, NDEL1 is phosphorylated by CDK5/p35, a protein serine/threonine kinase complex essential for neuronal migration (Chae et al., 1997; Gilmore et al., 1998; Niethammer et al., 2000; Sasaki et al., 2000). Indeed, Cdk5−/− cortical projection neurons exhibit a migration arrest phenotype somewhat similar to the phenotype of Ndel1−/− neurons (Gilmore et al., 1998; Ohshima et al., 2007). It will be interesting in the future to perform MADM analysis of Cdk5 to directly compare the cell-autonomous function of Cdk5 with that of Ndel1, and to determine the extracellular cues and signaling cascades that regulate NDEL1 activity to control the entry of migrating neurons into the target lamina.
LIS1 is well known to regulate neuronal migration in a dosage-sensitive manner (Wynshaw-Boris, 2007). MADM allowed us to compare the behavior of sparse, uniquely labeled Lis1−/−, Lis1+/−, and Lis1+/+ cells in a predominantly Lis1+/− heterozygous animal and thus address the questions of dosage as well as cell autonomy. We find that Lis1+/+ cells have a competitive advantage over cells of all other genotypes in the mosaic animal in their extent of migration; this can be seen in cortical projection neurons, CA1 pyramidal neurons and dentate granule cells. In addition, there is a significant delay in the migration of Lis1−/− compared to Lis1+/− cortical projection neurons to correct layers (Figure S4). Together, these observations support the notion that LIS1 cell autonomously regulates the migration efficiency (Figure 9C) in a dose-dependent manner.
Perhaps the most surprising finding of our study is that the neuronal migration phenotypes resulting from sparse MADM-based gene knockout are distinct from those observed in previous reports using other genetic perturbations of the same genes. For Ndel1, previous RNAi knockdown results in a significant defect of neurons migrating out of the VZ/SVZ (Shu et al., 2004); conditional whole-cortex knockout causes a complete block of neuronal migration within the VZ/SVZ and IZ (Youn et al., 2009). MADM analysis indicates that migration of Ndel1−/− neurons are specifically blocked at the entry of the cortical plate but migrate normally in VZ, SVZ, and IZ. For Lis1, analysis of previous RNAi knockdown, compound heterozygous and whole cortex conditional knockout indicate that neuronal migration is severely perturbed (Gambello et al., 2003; Hirotsune et al., 1998; Tsai et al., 2005; Youn et al., 2009). MADM analysis of Lis1, while revealing an essential role for neural progenitor proliferation consistent with previous results, did not show a complete arrest of migration in Lis1−/− neurons. Indeed, despite a developmental delay, Lis1−/− and Lis1+/− neurons behave similarly in the migration of cortical projection neurons (Figure 2H), hippocampal CA1 pyramidal neurons (Figure 3F) and dentate granule cells (Figure S5F) when examined in adult.
Altogether, these phenotypic differences strongly suggest that a subset of previously described migration functions for Ndel1 and Lis1 can be accounted for by cell-nonautonomous function of these genes in regulating neuronal migration. Specifically, migration of Ndel1−/− cells within the IZ can be positively affected by neighboring Ndel1+/− cells even though entry into the cortical plate cannot. A cell-nonautonomous function may also account for the eventual migration of Lis1−/− neurons into proper cortical and hippocampal layers. We note that small cell-nonautonomous effects have been proposed also for nonradial migration in Lis1+/− mice (McManus et al., 2004).
How can these cytoplasmic proteins exert cell-nonautonomous effects? We envision two scenarios that are not mutually exclusive. First, a “community effect” may provide support for individual neurons in the process of migration. In particular, isolated Ndel1−/− or Lis1−/− neurons, although defective in the intrinsic essential migration machinery (e.g., centrosome-nucleus coupling), could nevertheless physically “piggyback” on normally migrating neighboring neurons. However, if most or all neurons are mutant for Lis1 or Ndel1, community effects become ineffective. Second, migrating neurons may actively signal to each other to facilitate the intrinsic migration program. The generation of such a signal may require the LIS1/NDEL1 complex, accounting for their cell-nonautonomous effect.
Regardless of the exact mechanism, MADM-based genetic mosaic analyses revealed extensive cell-cell interactions among migrating neurons (Figures 9B and 9C). Importantly, such nonautonomous functions could contribute significantly to the clinical symptoms of Lissencephaly, whereby cells with a 50% reduction in LIS1 protein levels exhibit inappropriate community effects or fail to signal to each other. This may in turn exacerbate the already-impaired, intrinsic migratory capacity of Lis1+/− neurons. It will be revealing to investigate the interplay of cell-autonomous and cell-nonautonomous mechanisms in the control of neuronal migration. Our study also reinforced the power of mosaic analysis in dissecting gene function in mammalian brain development. The successful generation of MADM-11 will now allow mosaic analysis for ∼2000 genes located distal to the HIPP11 locus. The targeted knockin approach presented here also suggests a general strategy to expand MADM to other mouse chromosomes.
Experimental Procedures
Identification of Hipp11 as a Suitable Genomic Locus for the Generation of MADM-11 Transgenic Mice
The genomic locus of choice on Chr. 11 for targeted knockin of MADM cassettes should ideally (1) be located close to the centromere to maximize the number of genes on Chr. 11 that can be subjected to MADM-based mosaic analysis; (2) be located within an intergenic region to minimize the probability of disrupting endogenous gene function; and (3) allow strong and ubiquitous biallelic expression of marker proteins derived from the MADM transgenes. We mapped in silico the centromeric-most 10 Mbp of the acrocentric Chr. 11 and chose the targeting site for generating MADM-11 in cytoband A1 at ∼3 cM between the Eif4enif1 and Drg1 genes (Figures 1A and 1B). We named this locus Hipp11. Both Eif4enif1 and Drg1 flanking Hipp11 displayed broad spatial and temporal EST (expression sequence tag) expression patterns (http://www.ncbi.nlm.nih.gov/), potentially permitting MADM transgenes to be capable of global expression from a built-in ubiquitous pCA promoter. Chimeric MADM cassettes were targeted to the Hipp11 locus by homologous recombination in R1 ES cells. Two independent ES cell clones for each MADM-11GT/+ and MADM-11TG/+ were expanded and chimeric founder mice generated by blastocyst injection. Homozygous MADM-11GT/GT, MADM-11TG/TG, and trans-heterozygous MADM-11GT/TG mice were born at expected Mendelian ratios, were fully viable and fertile, and appeared indistinguishable from wild-type mice. MADM-11GT and MADM-11TG mice are available at Jackson Laboratory Repository (http://jaxmice.jax.org/query) under JAX Stock No. 013749 (MADM-11-GT) and JAX Stock No. 013751 (MADM-11-TG).
Analysis of GFP and tdT Markers in MADM-Labeled Brains
Postnatal mice were perfused with 4% PFA and dissected brains postfixed in 4% PFA overnight, cryoprotected in 30% sucrose/PBS and embedded for cryostat sections. Embryonic brains were immersed in 4% PFA for 4 hr to o/n for fixation. Fixed brains were sectioned at 20–60 μm using a cryostat (Le-ica). Cryosections were washed 3× in PBS, stained with DAPI and mounted for imaging using a confocal microscope (Zeiss). Quantification of cell numbers (Supplemental Experimental Procedures) were derived from ≥2 animals/genotype and time points unless indicated otherwise; values in quantification charts represent mean ± SEM. Student's t test was used to determine significance: *p < 0.05, **p < 0.01, and ***p < 0.001.
MADM Clone Induction
For MADM clone induction, pregnant MADM-11GT/GT females that have been crossed to MADM-11TG/TG;Nestin-CreER+/− males were injected intraperitoneal with 1–3 mg TM (Sigma) dissolved in corn oil (Sigma) at E8/E10. Embryos were isolated at E14, E16, and E18 and processed for analysis as described above. No difference in the clonal pattern was observed when the genotypes of males and females were switched. For Ndel1-MADM clones, one of the parent mice contained the MADM-11TG/TG,Ndel1 allele to label mutant cells in green.
Live-Imaging Assay for MADM-Labeled Organotypic Slices
Previously established live-imaging protocols (Youn et al., 2009) were used with slight adaptations (see Supplemental Experimental Procedures).
Supplementary Material
Acknowledgments
We thank B. Tasic and L. Li for generating and validating unpublished 3×Myc-tdT constructs, Y. Chen-Tsai and Stanford Transgenic Facility for help with generating knockin mice, R. Tsien for providing tdT, R. Kageyama for providing Nestin-CreER+/−, members of the Luo, Zong, and Wynshaw-Boris labs for discussion, and S. McConnell, T. Mosca, C. Potter, Y. Chou, C. Liu, L. Sweeney, W. Joo, and M. Spletter for comments on the manuscript. This work was supported by postdoctoral fellowships from the European Molecular Biology Organization ALTF 851-2005 (S.H.), Human Frontier Science Program LT00805/2006-L (S.H.) and LT00300/2007-L (K.M.), Swiss National Science Foundation PA00P3_124160 (S.H.), JSPS Postdoctoral Fellowships for Research Abroad (K.M.), and NIH grants NS050835 to L.L. and NS041310 and HD047380 to A.W.-B. L.L. is an investigator of the Howard Hughes Medical Institute.
Footnotes
Supplemental Information includes nine figures, two movies, and Supplemental Experimental Procedures and can be found with this article online at doi:10.1016/j.neuron.2010.09.027.
References
- Altman J, Bayer SA. Prolonged sojourn of developing pyramidal cells in the intermediate zone of the hippocampus and their settling in the stratum pyramidale. J Comp Neurol. 1990;301:343–364. doi: 10.1002/cne.903010303. [DOI] [PubMed] [Google Scholar]
- Altman J, Bayer SA. The Development of the Cerebellar System in Relation to Its Evolution, Structure, and Functions. Boca Raton, FL: CRC Press; 1997. [Google Scholar]
- Angevine JB, Jr, Sidman RL. Autoradiographic study of cell migration during histogenesis of cerebral cortex in the mouse. Nature. 1961;192:766–768. doi: 10.1038/192766b0. [DOI] [PubMed] [Google Scholar]
- Cahana A, Escamez T, Nowakowski RS, Hayes NL, Giacobini M, von Holst A, Shmueli O, Sapir T, McConnell SK, Wurst W, et al. Targeted mutagenesis of Lis1 disrupts cortical development and LIS1 homodimerization. Proc Natl Acad Sci USA. 2001;98:6429–6434. doi: 10.1073/pnas.101122598. [DOI] [PMC free article] [PubMed] [Google Scholar]
- Chae T, Kwon YT, Bronson R, Dikkes P, Li E, Tsai LH. Mice lacking p35, a neuronal specific activator of Cdk5, display cortical lamination defects, seizures, and adult lethality. Neuron. 1997;18:29–42. doi: 10.1016/s0896-6273(01)80044-1. [DOI] [PubMed] [Google Scholar]
- Costa MR, Bucholz O, Schroeder T, Götz M. Late origin of glia-restricted progenitors in the developing mouse cerebral cortex. Cereb Cortex. 2009;19(Suppl 1):i135–i143. doi: 10.1093/cercor/bhp046. [DOI] [PubMed] [Google Scholar]
- Espinosa JS, Wheeler DG, Tsien RW, Luo L. Uncoupling dendrite growth and patterning: single-cell knockout analysis of NMDA receptor 2B. Neuron. 2009;62:205–217. doi: 10.1016/j.neuron.2009.03.006. [DOI] [PMC free article] [PubMed] [Google Scholar]
- Farley FW, Soriano P, Steffen LS, Dymecki SM. Widespread recombinase expression using FLPeR (flipper) mice. Genesis. 2000;28:106–110. [PubMed] [Google Scholar]
- Feng Y, Walsh CA. Mitotic spindle regulation by Nde1 controls cerebral cortical size. Neuron. 2004;44:279–293. doi: 10.1016/j.neuron.2004.09.023. [DOI] [PubMed] [Google Scholar]
- Feng Y, Olson EC, Stukenberg PT, Flanagan LA, Kirschner MW, Walsh CA. LIS1 regulates CNS lamination by interacting with mNudE, a central component of the centrosome. Neuron. 2000;28:665–679. doi: 10.1016/s0896-6273(00)00145-8. [DOI] [PubMed] [Google Scholar]
- Fuchs E, Cleveland DW. A structural scaffolding of intermediate filaments in health and disease. Science. 1998;279:514–519. doi: 10.1126/science.279.5350.514. [DOI] [PubMed] [Google Scholar]
- Gambello MJ, Darling DL, Yingling J, Tanaka T, Gleeson JG, Wynshaw-Boris A. Multiple dose-dependent effects of Lis1 on cerebral cortical development. J Neurosci. 2003;23:1719–1729. doi: 10.1523/JNEUROSCI.23-05-01719.2003. [DOI] [PMC free article] [PubMed] [Google Scholar]
- Gilmore EC, Ohshima T, Goffinet AM, Kulkarni AB, Herrup K. Cyclin-dependent kinase 5-deficient mice demonstrate novel developmental arrest in cerebral cortex. J Neurosci. 1998;18:6370–6377. doi: 10.1523/JNEUROSCI.18-16-06370.1998. [DOI] [PMC free article] [PubMed] [Google Scholar]
- Gorski JA, Talley T, Qiu M, Puelles L, Rubenstein JL, Jones KR. Cortical excitatory neurons and glia, but not GABAergic neurons, are produced in the Emx1-expressing lineage. J Neurosci. 2002;22:6309–6314. doi: 10.1523/JNEUROSCI.22-15-06309.2002. [DOI] [PMC free article] [PubMed] [Google Scholar]
- Götz M, Huttner WB. The cell biology of neurogenesis. Nat Rev Mol Cell Biol. 2005;6:777–788. doi: 10.1038/nrm1739. [DOI] [PubMed] [Google Scholar]
- Heng JI, Chariot A, Nguyen L. Molecular layers underlying cytoskeletal remodelling during cortical development. Trends Neurosci. 2010;33:38–47. doi: 10.1016/j.tins.2009.09.003. [DOI] [PubMed] [Google Scholar]
- Hirotsune S, Fleck MW, Gambello MJ, Bix GJ, Chen A, Clark GD, Ledbetter DH, McBain CJ, Wynshaw-Boris A. Graded reduction of Pafah1b1 (Lis1) activity results in neuronal migration defects and early embryonic lethality. Nat Genet. 1998;19:333–339. doi: 10.1038/1221. [DOI] [PubMed] [Google Scholar]
- Imayoshi I, Ohtsuka T, Metzger D, Chambon P, Kageyama R. Temporal regulation of Cre recombinase activity in neural stem cells. Genesis. 2006;44:233–238. doi: 10.1002/dvg.20212. [DOI] [PubMed] [Google Scholar]
- Liu Z, Steward R, Luo L. Drosophila Lis1 is required for neuroblast proliferation, dendritic elaboration and axonal transport. Nat Cell Biol. 2000;2:776–783. doi: 10.1038/35041011. [DOI] [PubMed] [Google Scholar]
- Lledo PM, Merkle FT, Alvarez-Buylla A. Origin and function of olfactory bulb interneuron diversity. Trends Neurosci. 2008;31:392–400. doi: 10.1016/j.tins.2008.05.006. [DOI] [PMC free article] [PubMed] [Google Scholar]
- Lois C, Alvarez-Buylla A. Long-distance neuronal migration in the adult mammalian brain. Science. 1994;264:1145–1148. doi: 10.1126/science.8178174. [DOI] [PubMed] [Google Scholar]
- Low-Zeddies SS, Takahashi JS. Chimera analysis of the Clock mutation in mice shows that complex cellular integration determines circadian behavior. Cell. 2001;105:25–42. doi: 10.1016/s0092-8674(01)00294-x. [DOI] [PMC free article] [PubMed] [Google Scholar]
- Marin O, Valiente M, Ge X, Tsai LH. Guiding neuronal cell migrations. Cold Spring Harb Perspect Biol. 2010;2:a001834–a001834. doi: 10.1101/cshperspect.a001834. [DOI] [PMC free article] [PubMed] [Google Scholar]
- McManus MF, Nasrallah IM, Pancoast MM, Wynshaw-Boris A, Golden JA. Lis1 is necessary for normal non-radial migration of inhibitory interneurons. Am J Pathol. 2004;165:775–784. doi: 10.1016/S0002-9440(10)63340-8. [DOI] [PMC free article] [PubMed] [Google Scholar]
- Miale IL, Sidman RL. An autoradiographic analysis of histogenesis in the mouse cerebellum. Exp Neurol. 1961;4:277–296. doi: 10.1016/0014-4886(61)90055-3. [DOI] [PubMed] [Google Scholar]
- Morris NR. Nuclear migration. From fungi to the mammalian brain. J Cell Biol. 2000;148:1097–1101. doi: 10.1083/jcb.148.6.1097. [DOI] [PMC free article] [PubMed] [Google Scholar]
- Nadarajah B, Brunstrom JE, Grutzendler J, Wong RO, Pearlman AL. Two modes of radial migration in early development of the cerebral cortex. Nat Neurosci. 2001;4:143–150. doi: 10.1038/83967. [DOI] [PubMed] [Google Scholar]
- Nguyen MD, Shu T, Sanada K, Larivière RC, Tseng HC, Park SK, Julien JP, Tsai LH. A NUDEL-dependent mechanism of neurofilament assembly regulates the integrity of CNS neurons. Nat Cell Biol. 2004;6:595–608. doi: 10.1038/ncb1139. [DOI] [PubMed] [Google Scholar]
- Niethammer M, Smith DS, Ayala R, Peng J, Ko J, Lee MS, Morabito M, Tsai LH. NUDEL is a novel Cdk5 substrate that associates with LIS1 and cytoplasmic dynein. Neuron. 2000;28:697–711. doi: 10.1016/s0896-6273(00)00147-1. [DOI] [PubMed] [Google Scholar]
- Noctor SC, Martínez-Cerdeño V, Ivic L, Kriegstein AR. Cortical neurons arise in symmetric and asymmetric division zones and migrate through specific phases. Nat Neurosci. 2004;7:136–144. doi: 10.1038/nn1172. [DOI] [PubMed] [Google Scholar]
- Ohshima T, Hirasawa M, Tabata H, Mutoh T, Adachi T, Suzuki H, Saruta K, Iwasato T, Itohara S, Hashimoto M, et al. Cdk5 is required for multipolar-to-bipolar transition during radial neuronal migration and proper dendrite development of pyramidal neurons in the cerebral cortex. Development. 2007;134:2273–2282. doi: 10.1242/dev.02854. [DOI] [PubMed] [Google Scholar]
- Rakic P. Mode of cell migration to the superficial layers of fetal monkey neocortex. J Comp Neurol. 1972;145:61–83. doi: 10.1002/cne.901450105. [DOI] [PubMed] [Google Scholar]
- Rakic P. Neurons in rhesus monkey visual cortex: systematic relation between time of origin and eventual disposition. Science. 1974;183:425–427. doi: 10.1126/science.183.4123.425. [DOI] [PubMed] [Google Scholar]
- Ramon y Cajal S. Histology of the Nervous System of Man and Vertebrates. Oxford: Oxford University Press; 1911. [Google Scholar]
- Reiner O, Carrozzo R, Shen Y, Wehnert M, Faustinella F, Dobyns WB, Caskey CT, Ledbetter DH. Isolation of a Miller-Dieker lissencephaly gene containing G protein beta-subunit-like repeats. Nature. 1993;364:717–721. doi: 10.1038/364717a0. [DOI] [PubMed] [Google Scholar]
- Sasaki S, Shionoya A, Ishida M, Gambello MJ, Yingling J, Wynshaw-Boris A, Hirotsune S. A LIS1/NUDEL/cytoplasmic dynein heavy chain complex in the developing and adult nervous system. Neuron. 2000;28:681–696. doi: 10.1016/s0896-6273(00)00146-x. [DOI] [PubMed] [Google Scholar]
- Sasaki S, Mori D, Toyo-oka K, Chen A, Garrett-Beal L, Muramatsu M, Miyagawa S, Hiraiwa N, Yoshiki A, Wynshaw-Boris A, Hirotsune S. Complete loss of Ndel1 results in neuronal migration defects and early embryonic lethality. Mol Cell Biol. 2005;25:7812–7827. doi: 10.1128/MCB.25.17.7812-7827.2005. [DOI] [PMC free article] [PubMed] [Google Scholar]
- Scott EK, Luo L. How do dendrites take their shape? Nat Neurosci. 2001;4:359–365. doi: 10.1038/86006. [DOI] [PubMed] [Google Scholar]
- Shaner NC, Campbell RE, Steinbach PA, Giepmans BN, Palmer AE, Tsien RY. Improved monomeric red, orange and yellow fluorescent proteins derived from Discosoma sp red fluorescent protein. Nat Biotechnol. 2004;22:1567–1572. doi: 10.1038/nbt1037. [DOI] [PubMed] [Google Scholar]
- Shu T, Ayala R, Nguyen MD, Xie Z, Gleeson JG, Tsai LH. Ndel1 operates in a common pathway with LIS1 and cytoplasmic dynein to regulate cortical neuronal positioning. Neuron. 2004;44:263–277. doi: 10.1016/j.neuron.2004.09.030. [DOI] [PubMed] [Google Scholar]
- Takahashi Y. The 14-3-3 proteins: Gene, gene expression, and function. Neurochem Res. 2003;28:1265–1273. doi: 10.1023/a:1024296932670. [DOI] [PubMed] [Google Scholar]
- Toyo-oka K, Shionoya A, Gambello MJ, Cardoso C, Leventer R, Ward HL, Ayala R, Tsai LH, Dobyns W, Ledbetter D, et al. 14-3-3ε is important for neuronal migration by binding to NUDEL: a molecular explanation for Miller-Dieker syndrome. Nat Genet. 2003;34:274–285. doi: 10.1038/ng1169. [DOI] [PubMed] [Google Scholar]
- Tsai JW, Chen Y, Kriegstein AR, Vallee RB. LIS1 RNA interference blocks neural stem cell division, morphogenesis, and motility at multiple stages. J Cell Biol. 2005;170:935–945. doi: 10.1083/jcb.200505166. [DOI] [PMC free article] [PubMed] [Google Scholar]
- Vallee RB, Seale GE, Tsai JW. Emerging roles for myosin II and cytoplasmic dynein in migrating neurons and growth cones. Trends Cell Biol. 2009;19:347–355. doi: 10.1016/j.tcb.2009.03.009. [DOI] [PMC free article] [PubMed] [Google Scholar]
- Wynshaw-Boris A. Lissencephaly and LIS1: Insights into the molecular mechanisms of neuronal migration and development. Clin Genet. 2007;72:296–304. doi: 10.1111/j.1399-0004.2007.00888.x. [DOI] [PubMed] [Google Scholar]
- Yingling J, Youn YH, Darling D, Toyo-Oka K, Pramparo T, Hirotsune S, Wynshaw-Boris A. Neuroepithelial stem cell proliferation requires LIS1 for precise spindle orientation and symmetric division. Cell. 2008;132:474–486. doi: 10.1016/j.cell.2008.01.026. [DOI] [PMC free article] [PubMed] [Google Scholar]
- Youn YH, Pramparo T, Hirotsune S, Wynshaw-Boris A. Distinct dose-dependent cortical neuronal migration and neurite extension defects in Lis1 and Ndel1 mutant mice. J Neurosci. 2009;29:15520–15530. doi: 10.1523/JNEUROSCI.4630-09.2009. [DOI] [PMC free article] [PubMed] [Google Scholar]
- Zong H, Espinosa JS, Su HH, Muzumdar MD, Luo L. Mosaic analysis with double markers in mice. Cell. 2005;121:479–492. doi: 10.1016/j.cell.2005.02.012. [DOI] [PubMed] [Google Scholar]
Associated Data
This section collects any data citations, data availability statements, or supplementary materials included in this article.