

Abstract
Here we investigate the correlations between coding sequence substitutions as a function of their separation along the protein sequence. We consider both substitutions between the reference genomes of several Drosophilids as well as polymorphisms in a population sample of Zimbabwean Drosophila melanogaster. We find that amino acid substitutions are “clustered” along the protein sequence, that is, the frequency of additional substitutions is strongly enhanced within ≈10 residues of a first such substitution. No such clustering is observed for synonymous substitutions, supporting a “correlation length” associated with selection on proteins as the causative mechanism. Clustering is stronger between substitutions that arose in the same lineage than it is between substitutions that arose in different lineages. We consider several possible origins of clustering, concluding that epistasis (interactions between amino acids within a protein that affect function) and positional heterogeneity in the strength of purifying selection are primarily responsible. The role of epistasis is directly supported by the tendency of nearby substitutions that arose on the same lineage to preserve the total charge of the residues within the correlation length and by the preferential cosegregation of neighboring derived alleles in our population sample. We interpret the observed length scale of clustering as a statistical reflection of the functional locality (or modularity) of proteins: amino acids that are near each other on the protein backbone are more likely to contribute to, and collaborate toward, a common subfunction.
Author Summary
Genes are templates for proteins, yet evolutionary studies of genes and proteins often bear little resemblance. Analyses of gene evolution typically treat each codon independently, quantifying gene evolution by summing over the constituent codons. In contrast, studies of protein evolution generally incorporate protein structure and interactions between amino acids explicitly. We investigate correlations in the evolution of codons as a function of their distance from each other along the protein coding sequence. This approach is motivated by the expectation that codons near each other in sequence often encode amino acids belonging to the same functional unit. Consequently, these amino acids are more likely to interact and/or experience similar selective regimes, introducing correlation between the evolution of the underlying codons. We find codon evolution in Drosophilids to be correlated over a characteristic length scale of ≈10 codons. Specifically, the presence of a non-synonymous substitution substantially increases the probability of further such substitutions nearby, particularly within that lineage. Further analysis suggests both functional interactions between amino acids and correlation in the strength of selection contribute to this effect. These findings are relevant for understanding the relative importance of different modes of selection, and particularly the role of epistasis, in gene and protein evolution.
Introduction
There has been an ongoing debate over the past few decades about the processes underlying protein evolution [1]–[5]. The neutral theory [1] posits that protein evolution is chiefly governed by the fraction of newly arising mutations that are not detrimental enough to be removed by natural selection. However, recent population genetic analyses of closely related Drosophila species suggest that protein divergence between species is substantially in excess of the neutral model's predictions [6], [7]. Intriguingly, this protein divergence excess is consistent with an important role for positive selection in protein evolution [5], [8], [9], although the contribution of weakly deleterious mutations to this pattern is still debated [10], [11].
The dramatic shift in our view of the processes driving protein evolution in Drosophila highlights the deficiency in our understanding of the mechanisms responsible for the observed protein divergence excess. One reason for this deficiency is the explicitly sequence-based nature of the population genetic analyses used to describe the excess divergence. These methods were developed for the analysis of linear sequences of independently evolving amino acids, and quite generally ignore the fact that most proteins fold into complex three-dimensional structures, held together by interactions between amino acids and between amino acids and the surrounding medium. Protein function depends critically on this folded structure, e.g. the arrangement of specific amino acids at the active site of an enzyme [12]. This is reflected in protein evolution; both the structure and the function of homologous proteins are remarkably conserved over long times, even while primary sequences substantially diverge [13]. The maintenance of protein structure is possible because evolution preserves structurally important interactions, such as favorable biochemical interactions between amino acids in physical contact [14]. This preservation of structurally important interactions affects sequence-based analyses; the preferred state and variability of an amino acid will depend on amino acids elsewhere in the protein [15].
This study is motivated by the desire to more closely integrate protein structure and function into sequence-based inferences of selection. Correlations between substitution patterns and protein structure have yielded insights over many years, from the slower divergence of protein active sites [1], [16] to recent results indicating a correlation between estimates of positive selection and secondary structure [17]. Work demonstrating the evolutionary consequences of interactions inferred from RNA structure [18]–[20] supported the application of sequence-based inference of functional interactions to proteins, where functional interactions are difficult to identify even when structure is known [21]. Under the assumption that functionally interacting residues coevolve, interactions can be identified if enough evolutionary trajectories can be sampled. In practice this has meant multi-alignments across many species of large protein families [22]–[25], but alignments within populations of the highly mutable HIV have also been used [26], [27]. These methods have been successfully used to identify pair-wise interactions between residues that contribute to protein function. As an example, the inclusion of interactions inferred from a multi-alignment was shown sufficient to produce a stable fold [28].
Here we develop a complementary approach intended to probe the level of influence interactions have on protein evolution. Instead of focusing on a single protein and specific pairs of interacting residues, we shall aggregate evolutionary information across proteins and use the increased statistical power to look for generic patterns. Specifically, we investigate the correlations in the substitution processes at residues a given distance from each other along the protein backbone, averaged over many proteins of D. melanogaster. Our rationale is as follows: residues that are near in the primary protein sequence are also likely to be near in the folded protein (Figure 1A) and therefore more likely to interact physically and/or belong to the same protein domain. Consequently, if correlated evolution in proteins is common, it should be detectable by an increase in evolutionary correlation between residues nearby in sequence, for which physical interaction in the folded protein is more likely. While we will be unable to identify particular interactions, our approach will be informative about the overall level of influence interactions have on the evolution of proteins.
Figure 1. Structural distance as a function of sequence distance and Drosophilid phylogeny.

A) All PDBs for the source organism D. melanogaster were downloaded at http://www.pdb.org/, with homologs excluded at 90% identity. These crystal structures were used to estimate a relationship between the structural distance between the  atoms of amino acids as a function of their separation along the primary sequence. The solid blue line indicates the mean distance, while the dashed lines indicate first and third quartiles. Structural distance increases quickly with sequence distance, but the increase saturates at a sequence distance of around
  amino acids. B) The phylogenic tree of the Drosophilid species we are considering (adapted from that at http://rana.lbl.gov/drosophila/).
We find that amino acid substitutions cluster together on the protein sequence, i.e. amino acid substitutions are more frequent nearby other such substitutions. The strength of this effect decays exponentially with the separation between the residues along the protein sequence, with a characteristic length scale of about  codons. We observe this clustering phenomenon in substitutions between D. melanogaster and several sister species (Figure 1B) as well as in polymorphisms within a Zimbabwean population sample of D. melanogaster. Clustering is absent when considering synonymous substitutions, implicating selection as the root cause. Furthermore, clustering is stronger between substitutions that arose along the same branch of the evolutionary tree than between substitutions that arose in different branches, and nearby derived alleles tend to cosegregate in our population sample. Additionally, pairs of substitutions within
  codons of each other that arose in the same lineage have a significant tendency to cause compensatory changes to the total charge of the protein. These lines of evidence lead us to conclude that epistasis between amino acid substitutions contributes significantly to clustering, and the substitution process as a whole.
Results
The 12 Drosophilid genomes resource [29] serves as the primary data source in this study. We used this resource to identify protein coding sequence substitutions between D. melanogaster (Dmel) and several sister Drosophilids: D. sechellia (Dsec), D. simulans (Dsim), D. yakuba (Dyak), D. erecta (Dere), D. ananassae (Dana) and D. pseudoobscura (Dpse) available at http://rana.lbl.gov/drosophila/ (Figure 1B). Substitutions were ascertained from nucleotide alignments of the reference genomes produced by the blastz algorithm [30], and available from UCSC [31] at ftp://hgdownload.cse.ucsc.edu/goldenPath/dm3/.
Our goal here is to understand how correlation between the substitution processes at different residues is affected by the distance between those residues along the protein sequence. To this end we introduce the conditional probability function (cPDF), which we denote  and define as the probability of there being a substitution of type
  at sequence position
  conditioned on the existence of a substitution of type
  at sequence position
  . To assess, for example, whether the probability of a synonymous divergence (DS) is affected by the presence of a non-synonymous divergence (DN) some distance
  away, we can estimate
  and compare it to the overall level of synonymous divergence.
cPDFs are estimated from sets of aligned coding sequences by averaging over all instances of the focal substitution  in the aligned sequences (Methods). Since we are particularly interested in the functional dependence of cPDFs on the distance from the focal substitution
  we will normalize cPDFs by their asymptotic value (Methods). Note that we will always be measuring distance
  in terms of codons rather than nucleotides, as this is the natural unit of distance in a gene. Figure 2A shows three of these normalized cPDFs,
  ,
,  , and
, and  , estimated from the species comparison of D. melanogaster and D. yakuba.
Figure 2. The frequency of additional substitutions near a focal substitution.

 is the conditional probability of finding a non-synonymous divergence (DN) a distance
  from another DN, relative to the unconditional probability. The peak of
  around
  describes the enhanced frequency of DNs near other DNs over a length scale of approximately 10 codons, an effect we call local ‘clustering’. There is no clustering when synonymous substitutions (DS) are considered. Raw data is plotted here as crosses, the solid lines are moving window smoothings (Methods). A) The cPDFs estimated from the set of aligned coding sequences for the species comparison of D. melanogaster and D. yakuba are shown. The range of the cPDFs estimated from all other species comparisons in this study is indicated with solid background colors, demonstrating the consistency of this signal. Figure S1 displays the amount of coding sequence included for each species comparison. B) The special case in which diverged codons are separated by an intron (minimum length of
  nt). The estimated cPDFs are noisier at low
  because nearby sites are unlikely to span an intron, but the clustering peak of
  is clearly consistent with that found within exons (shown with the dashed line), particularly the length scale. C) The cPDFs between polymorphisms, both synonymous (PS) and non-synonymous (PN), found in
  kb of coding sequence (
 genes) in a Zimbabwean population sample of D. melanogaster. Polymorphisms cluster analogously to substitutions.
Amino acid substitutions cluster along protein sequences
Amino acid substitutions are not distributed uniformly along the protein sequence. The cPDF for non-synonymous substitutions,  , is significantly peaked around
  in every species comparison we consider. This peak describes the tendency of non-synonymous substitutions to ‘clump together’ on the protein sequence, a phenomenon we call clustering. The shape of the clustering peak is well-fit by a decaying exponential with a characteristic length scale of about 10 codons. In sharp contrast, the cPDFs involving synonymous substitutions,
  and
and  , have no clustering peak, indicating that synonymous substitutions are distributed uniformly along the protein sequence. The difference between non-synonymous and synonymous clustering is highly significant, the sampling p-value is essentially zero (
 , chi-square test).
The magnitude of clustering is large. The nearest neighbor of a codon with a non-synonymous substitution is roughly twice as likely to also have such a substitution than would otherwise be expected. The impact of clustering extends well beyond the nearest neighbor, and is appreciable out to a distance of at least  codons from a focal non-synonymous substitution. We quantify the total magnitude of clustering by defining the ‘clustering count’
  as the difference between the expected number of substitutions of type
  in the
  codons downstream of a focal substitution of type
  and the expected number in a
  codon sequence segment distant from the focal substitution (Methods). More plainly,
  is the number of extra
  substitutions you find in the vicinity of an
  substitution because substitutions cluster instead of being distributed uniformly along the sequence. Graphically,
  is the area under the clustering peak (and above the asymptotic value) of the normalized cPDF
  , multiplied by the overall density of
  substitutions.
We are particularly interested in  , which we will simply denote
  . The shape of
  is very consistent between the different species comparisons tested, but the clustering count
  is not because it depends not only on
  , but also on the density of substitutions between the species being compared.
  ranges from
  in the D. melanogaster versus D. sechellia alignment to
  in the D. melanogaster versus D. ananassae alignment, as seen in Figure 3A.
  increases linearly with
  (the fraction of substituted amino acids), this is consistent with a clustering pattern that remains constant as divergence increases with time.
Figure 3. The dependence of clustering count  on sequence divergence.

A) The number of additional amino acid substitutions expected in the vicinity of a focal substitution due to clustering,  , increases linearly with divergence between species. This is seen in this plot of
  against the the fraction of substituted amino acids
  for six comparisons of D. melanogaster to sister Drosophilids. B) Non-synonymous substitutions cluster more strongly in more constrained genes. Here
  is estimated from subsets of the aligned coding sequences for the species comparison of D. melanogaster and D. yakuba. The subsets corresponds to the ten deciles of the coding sequences ranked by non-synonymous divergence. More constrained genes (lower
  , darker color) have more pronounced clustering, seen as the larger peak of
  near
near  . The inset shows clustering count
  versus the average
  of each subset.
  increases linearly at low
  , but quickly levels off and is roughly constant at
  for
for  . This contrasts with the result in panel A where
  measured divergence time, rather than constraint, and
  increased linearly with
  .
.
Clustering between nearby non-synonymous substitutions is strongly supported by the data, but it is not a priori clear whether it is the separation of amino acids along the protein backbone, or the distance in base pairs along the genome, that matters. To discriminate between these possibilities we repeated the correlation analysis including only those pairs of residues which spanned an intron. As a result the genomic separation between codons had a median increase of  bp (
bp ( codons) and a minimum increase of
  bp (
bp ( codons), while separation between the encoded amino acids along the protein backbone was unchanged. As shown in Figure 2B, the cPDFs estimated from these intron-spanning pairs of codons correspond closely with those estimated within exons, when separation along the protein backbone (exonic distance) is used in the estimation. We conclude that the clustering length scale is set by the distance along the protein backbone, not along the genome.
Remarkably, the clustering between amino acid substitutions is not limited to substitutions between species. It is also apparent among polymorphisms within a population sample of D. melanogaster (Methods). Figure 2C shows the estimated cPDFs between synonymous and non-synonymous polymorphisms ( and
and  ). The cPDFs estimated from polymorphisms are much noisier because our population sample sequencing spans only
  kb of coding sequence, as compared to
  Mb for the divergence data. Nevertheless, we find clustering between polymorphisms analogous to that between substitutions: non-synonymous polymorphisms cluster significantly (
 , chi-square test), while synonymous polymorphisms do not.
Factors influencing clustering
We tested for potential relationships between clustering and a number of genetic properties by estimating  on subsets of the full set of coding sequences stratified by the property in question. Clustering is robust in the sense that it is not substantially affected by many of the properties we tested, such as chromosome (including autosome versus X), recombination rate and the level of gapping in the alignment (Figures S2, S3, S4). We did find a systematic relationship between the GC content of coding sequence and clustering; higher GC content correlates with stronger clustering (Figure S5).
A notable factor that influences clustering is the level of constraint under which a gene evolves, which we estimate by the fraction of substituted amino acids  . Amino acid substitution are more clustered in constrained genes than they are in unconstrained genes, i.e.
  has a larger clustering peak when it is estimated from highly constrained (low
  ) coding sequences, see Figure 3B. In the inset of Figure 3B we have plotted the
  estimated from each subset of coding sequences against the average
  of that subset. It is useful to compare this plot to the one in Figure 3A, which also is a plot of
  versus
  . The difference between these plots is that in panel A
  effectively measures divergence time and
  scales linearly with
  , while in the inset of panel B
  tracks the level of constraint and
  is strongly sublinear in
  . In fact, once constraint relaxes past a certain point,
  becomes roughly constant. This relationship suggests that substitutions in constrained genes occur in tight clusters, and that as constraint lessens the additional substitutions which accrue do so uniformly along the sequence.
Potential non-selective causes of clustering
Clustered sequencing errors or mutation events
The sequencing and mutation processes both have the potential to produce a clustering signal. The frequency of sequencing error might autocorrelate along the sequence, for instance as a result of heterogeneity in read depth. If these clustered errors are interpreted as substitutions the result would be an artefactual clustering signal. Clustering in the mutational process, perhaps as a result of single mutational events altering several nearby codons, would be expected to introduce clustering into the substitution process. In fact, spatially correlated mutation events have been reported on length scales comparable to the clustering length scale we observe [32], [33].
There are two observations which contradict both sequencing error and mutation as the primary cause of clustering. First, the strong concordance between the clustering observed within exons and across introns in Figure 2B is incompatible with these mechanisms. Both of these processes would produce clustering which depended on genomic separation, not separation along the protein backbone. Second, both sequencing and mutation are insensitive to the codon structure in coding sequence. As a result, any clustering that is generated by these processes should affect synonymous and non-synonymous substitutions alike. This is inconsistent with our observations, we find clustering between non-synonymous substitutions to be substantial and clustering between synonymous substitutions (or between non-synonymous and synonymous substitutions) to be absent.
On this second point, it is important to be careful when making these comparisons, as the higher frequency of synonymous mutations has the potential to ‘drown out’ an equivalent level of clustering when considering cPDFs normalized to the background level of divergence. However that is is not the case here, non-synonymous clustering is an order of magnitude larger in absolute terms than any synonymous clustering that might exist (Figure S6). Furthermore, the clustering signal we observe is not driven by a small number of anomalous genes. We tested this by bootstrapping, i.e. repeating our analysis using data sets obtained by resampling with replacement from the full set of aligned coding sequences (Methods). The significance of the difference between non-synonymous and synonymous clustering is strongly supported by the bootstrap analysis (Figures S7, S8). We can assign a  -value to this difference by sampling bootstrap distribution of the summary statistics
  and
and  (Figure S8). We find that the boostrapped
  -values for observing
  greater than half
  (roughly the hypothesis that excess clustering is due to a codon-blind mechanism) is less than
  (Methods).
Local misalignment
Inadequacies in the alignment process also have the potential to introduce a spurious clustering signal. For instance, if sequence segments are incorrectly frameshifted the result would be artefactual stretches of predominantly non-synonymous substitutions. These stretches could lead to a non-synonymous only clustering signal consistent with our observations. This is of particular concern because the alignments we used are nucleotide alignments and hence did not account for the codon structure in the open reading frame.
Several lines of evidence argue against a substantial contribution from local misalignment to the clustering signal. (i) Non-synonymous clustering is just as strong when the two substitutions are separated by an intron. This is inconsistent with misalignment because local misalignment will affect stretches of sequence contiguous on the genome. Remember that the alignments used here are genome alignments, introns were not spliced out prior to alignment. (ii) The same clustering signal is observed when the analysis is performed on subsets of the coding sequences with and without alignment gaps (Figure S4). While not perfect, alignment gapping is a common proxy for alignment quality, and the particular concern of frameshifts is eliminated when considering gapless alignments. (iii) We repeated our analysis on an alternative set of alignments of Drosophilid coding sequences made publicly available at ftp://ftp.flybase.net/genomes/12_species_analysis/clark_eisen/alignments/ (specifically the masked, melanogaster group alignments using a guide tree) [29]. While the same reference genomes are used, the alignment method and ortholog selection is different, yet consistent clustering is observed in both cases (Figure S9).
Clustering of amino acid substitutions is due to selection
Non-selective mechanisms cannot account for both significant non-synonymous clustering and the absence of synonymous clustering. Having ruled out non-selective mechanisms, we now consider potential selective mechanisms that could cause amino acid substitutions to cluster. Perhaps the simplest explanation for clustering is that proteins have short segments, such as unstructured loops, that are under reduced purifying selection. These weakly constrained segments experience locally increased rates of amino acid substitution, which we then observe as clustering in both divergence and polymorphism data. There are also several ways in which positive selection could cause clustering. Clustering could be the result of localized ‘adaptive bursts’, i.e. functional modules in which multiple independently adaptive substitutions became available (perhaps due to a changed environment). Because amino acids close on the protein backbone are more likely to be in the same module, the resulting burst of adaptive substitutions would be clustered on the sequence. Amino acids that are close along the chain are also more likely to physically interact, even after protein folding. As a consequence, the fitness effect, and hence evolutionary fate, of nearby substitutions could be contingent on one another (i.e. epistasis). In particular we might imagine common compensatory interactions between nearby substitutions, although all synergistic interactions would contribute to clustering. Finally, another potential mechanism is hitchhiking. In this scenario mildly deleterious amino acid polymorphisms are driven to fixation by the selective sweep of a linked allele, resulting in clustered substitutions. We will now attempt to disentangle the relative contributions of these different selective scenarios.
Clustered substitutions tend to occur in the same lineage
We can polarize substitutions by the lineage on which they arose using an outgroup and then repeat our correlation analysis for pairs of substitutions which arose in the same lineage and for pairs which arose in different lineages (Methods). This allows us to begin to distinguish between potential selective mechanisms of clustering. If spatial heterogeneity in the strength of purifying selection is responsible for clustering we expect equal clustering within and between lineages, since in this case the presence of a substitution simply informs as to the level of constraint in that region of the protein sequence. In contrast, the alternative selective mechanisms (adaptive bursts, compensatory or synergistic mutations, and hitchhiking) are lineage-specific, they only apply when substitutions occur in the same lineage and therefore can only cause clustering between same-lineage substitutions.
We incorporate polarization into our analysis by extending the sequence features  in our cPDFs with the specification of the species lineage on which a substitution arose, e.g.
  is a non-synonymous substitution in the
  Dmel, Dsec, Dsim, Dyak, Dere, Dana, Dpse
 lineage (Methods). The non-synonymous cPDFs estimated for substitutions in the same and different lineage than the focal substitution are shown in Figure 4A for each species comparison. Clustering between substitutions is always significant whether substitutions arose in the same lineage or in different lineages, but clustering between same-lineage substitutions is always significantly stronger (Table S1). We argued above that spatially heterogeneous purifying selection would cause equal clustering within and between lineages. If this is so, the excess clustering within lineages must be generated by one of the lineage-specific alternatives.
Figure 4. Lineage-specific clustering of amino acid substitutions.

A)  estimated from substitutions that arose in the same lineage as the focal substitution (solid black line) and from substitutions that arose in a different lineage then the focal substitution (dashed black line) for the species comparison of D. yakuba to D. melanogaster. Substitutions were polarized (assigned to the lineage in which they arose) by parsimony using D. anannasae as outgroup. Lineage-specific excess clustering,
  Dyak
Dyak , is defined as the area between these curves over the first
  codons, shaded in red, multiplied by the overall substitution density in the Dyak lineage. The green plots in the background are the analogous cPDFs estimated from the other species comparisons we considered (solid lines are same-lineage cPDFs, dashed lines different-lineage cPDFs). Clustering within the same lineage is stronger than that between lineages for every lineage we consider. B) The clustering attributable to a lineage-specific mechanism
  is plotted as a function of the total clustering within a lineage
  for each lineage included in our study. A one parameter linear fit line is included with slope
  , indicating that roughly one-third of the clustering within a lineage appears to arise from lineage-specific mechanisms such as compensatory or synergistic mutations, adaptive bursts and/or hitchhiking. The D. simulans result indicated in red is excluded from the fit as an outlier.
Excess lineage-specific clustering can be quantified with an extension of the clustering count  . First we define the lineage-specific clustering count
  as an analog of
  with the difference that the cPDF from which
  derives is estimated using only substitutions in lineage
  . Therefore,
  is the increased number of
  -lineage DNs near a focal
  -lineage DN due to clustering. Next, the ‘lineage-specific excess clustering count’
  is the portion of
  which is inconsistent with a lineage non-specific mechanism. We quantify this as the difference between the within-
 and between-lineage clustering over the first
  codons (Methods). This corresponds graphically to the area between those cPDFs (the red area in Figure 4A,
  ), multiplied by the density of substitutions in the lineage
  .
.
The lineage-specific excess  appears to be a roughly constant fraction of the total lineage-specific clustering
  . The estimate of
  is plotted against the estimate of
  for both lineages of all our species comparisons in Figure 4B. This relationship is well-fit by a linear model, suggesting that approximately
  of clustering within a lineage is due to lineage-specific mechanisms, i.e. some combination of compensatory or synergistic mutations, adaptive bursts and hitchhiking. The D. simulans lineage is an outlier,
  Dsim
Dsim is aberrantly high. This may be a consequence of details relating to this particular reference sequence: the D. simulans reference sequence has lower coverage and quality than the other reference sequences as well as being a ‘mosaic’ assembly constructed from multiple individuals [29]. The Dsim lineage is also picked out by the synonymous control, there is significant synonymous clustering in this lineage above that found in any other lineage we consider (Figure S10).
Nearby charge-altering substitutions tend to compensate each other
If compensatory mutations are contributing substantially to lineage-specific excess one might find evidence of this in a physical or biochemical quantity associated with the compensation. For example, changes in volume, hydrophobicity, charge, etc. might anti-correlate if the substitutions are compensatory. We tested several amino acid properties for such a relationship but found only one that exhibited the hypothesized behavior: nearby substitutions have a significantly increased probability to cause compensatory changes in charge, but only when they arise in the same lineage! We quantify this effect by estimating the fraction of substitutions which compensate the effect of a focal charge-altering substitution, as a function of distance from the focal substitution  . In Figure 5 we see that the fraction of charge-compensating substitutions is significantly elevated near a focal charge-altering substitution, on roughly the clustering length scale of 10 codons. This compensation serves to partially conserve the total charge of the protein sequence within the clustering length scale.
Figure 5. Amino acid substitutions tend to conserve local charge.

Several amino acids are charged, with charges equal to  . Consequently, an amino acid substitution can cause a change in protein charge
  . Conditioned on a focal charge-altering substitution (
 ), we ask whether nearby substitutions tend to reinforce or compensate the focal change in charge, i.e. whether
  and has the same sign as
  (reinforcing) or the opposite sign (compensating). The fraction of substitutions which compensate/reinforce the focal charge-altering substitution is plotted as a function of the separation between the sites
  , estimated from the species comparison D. melanogaster and D. yakuba. Distinction is made between substitutions which arose in the same and different lineage as the focal substitution. Substitutions in the same lineage tend to be compensatory when within the clustering length scale of 10 codons (
 , chi-square test). This is not observed for substitutions that arose in a different lineage, in that case nearby substitutions are more likely to alter charge in the same direction.
Local charge compensation is significant in every species comparison we considered, all p-values  , chi-square test (Table S2). A measure of the magnitude of this effect is the fraction of charge-altering substitutions that that have their charge alteration compensated for by the net change in charge caused by the other substitutions within
  codons. This varies by lineage, but is always significant and increases with species divergence up to
  for the species comparison of D. melanogaster and D. pseudoobscura. Charge compensation is a lineage-specific effect, and it is responsible for a significant fraction of the lineage-specific excess
  we observe, roughly
  depending on lineage (Table S2). The observation of substantial charge compensation, and the lack of compensation of other amino acid properties, is consistent with previous observations which suggested charge compensation to be of greater significance in protein evolution than compensation of other amino acid characteristics [22], [34]. Interestingly, while substitutions in different lineages do not exhibit the local compensation phenomenon, they do show a weaker, but statistically significant, increase in the fraction of nearby changes which alter charge in the same direction, perhaps indicating convergent evolution (Table S2).
Nearby amino acid mutations cosegregate in a population
Non-synonymous polymorphisms cluster as well, and polymorphism data provides another avenue to distinguish between the possible selective mechanisms of clustering. Under a model of bursts of independent adaptive mutations, beneficial amino acid mutations can be incorporated sequentially, and would not be expected to segregate together in the population since beneficial mutations rapidly fix after arising. In contrast, if epistatic selection is driving the observed clustering we expect that a compensatory mutation will only be found on a chromosome that already carries the first mutation, i.e. we expect the derived states of nearby polymorphic sites to cosegregate. We can quantify this expectation by estimating the average polarized linkage disequilibrium  [35], [36], i.e. the frequency of the doubly derived haplotype minus the product of the frequencies of the individual derived alleles averaged over all pairs of polymorphisms a distance
  apart.
  then indicates that derived alleles occur in coupling more often than would be expected if their fitnesses were independent. Consistent with the compensatory scenario, we find
  when estimated from amino acid polymorphisms within
  codons of each other, as seen in Figure 6.
Figure 6. Polarized linkage disequilibrium.

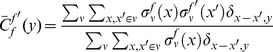
Doubly derived haplotypes are overrepresented among nearby pairs of non-synonymous polymorphisms (PN-PN) in our population sample, but not when one (PN-PS), or both (PS-PS), of the polymorphisms are synonymous. This is quantified by the average polarized linkage disequilibrium  , where
  is the frequency of the doubly derived haplotype for polymorphisms a distance
  apart and
  is the frequency of the derived allele at site
  .
.  is averaged over all pairs of polymorphisms
  apart,
  indicates an overrepresentation of the doubly derived haplotype, which we also refer to as preferential cosegregation of the derived alleles. We test the significance of cosegregation by bootstrapping, which yields
  that as great or greater cosegregation of nearby derived alleles (as measured by
  for
for  ) would be observed by chance.
We evaluate the significance of the cosegregation of nearby derived alleles by bootstrapping: we resample polymorphic sites from the full set of polymorphic sites in our population, pair them off into a number of pairs equal to the number of pairs of polymorphisms within  codons of each other, and then estimate
  from this resampled ensemble. Repeating this process
  times yields a bootstrapped probability distribution
  which we compare to the
  estimated from the data, yielding a bootstrapping p-value of
  of observing an equal or greater
  by chance from our population sample. Again, only pairs of non-synonymous polymorphisms significantly cosegregate, supporting the contention that epistasis is responsible and arguing against purely genomic explanations. Although cosegregation is statistically significant, because our polymorphism data set is limited (compared to whole-genome comparisons of divergence) there is more uncertainty about these results, and it is worth noting that cosegregation does not seem to extend beyond three codons of separation.
Discussion
We have shown that the presence of an amino acid substitution substantially increases the probability of there being additional amino acid substitutions nearby in the protein sequence, with the strength of this effect decaying exponentially along the sequence with a characteristic length scale of ≈10 codons. This ‘clustering’ phenomenon is not observed for synonymous substitutions and is insensitive to the presence of intervening intronic sequence, strongly suggesting selection on proteins as the root cause. Both divergence between Drosophilids and polymorphisms within a population sample of D. melanogaster exhibit this effect. Clustering has a substantial lineage-specific component and nearby substitutions in the same lineage tend to conserve local charge, suggesting compensatory evolution plays a role.
While the results presented here are derived from Drosophila data, we expect that clustering obtains more generally. A recent study found that mutations identified as compensatory clustered near their associated deleterious mutations in eukaryotes, prokaryotes and viruses [37]. Similarly, nucleotide substitutions cluster within codons more often than expected in mammals and HIV, suggesting that two successive mutations are required for the incorporation of some fraction of amino acid substitutions [38], [39].
Origin of clustering
There are a number of selective mechanisms that could cause amino acid substitutions to cluster, and the clustering we observe most likely has multiple causes. We will now try to reconcile the various observations made above with the different mechanisms that have the potential to cause clustering, and estimate their respective contributions. Potential selective mechanisms of clustering can be grouped into two classes: (A) Heterogeneity in the strength of purifying selection acting within an ORF leads to variation in the density of substitutions and polymorphisms, resulting in clustering. (B) Novel protein variants are selected for and this adaptation leads to clusters of substitutions. The latter class of mechanisms comes in several flavors: (i) A localized adaptive burst in which several nearby substitutions independently sweep to fixation. This might be a consequence of changes in selective pressure on a protein domain that requires multiple adaptive substitutions to reach the new optimum [40]. (ii) A complex adaptation, in which several dependent substitutions are required to achieve the selected effect. This case includes scenarios of compensatory mutations, i.e. a second mutation is necessary to compensate deleterious side effects of the first [41], and evolutionary contingency, i.e. the first mutation is necessary for the second mutation to be beneficial [42]. (iii) Hitchhiking, the fixation of otherwise deleterious substitutions as a result of a selective sweep at a linked site [43], [44].
Purifying versus positive selection
Purifying selection prunes mutations that are detrimental, perhaps because they interfere with protein structure or stability. Given that protein structure is strongly conserved across different domains of life, it is reasonable to assume that purifying selection operates in a similar fashion on homologous regions of proteins in different branches of the Drosophila phylogeny. Adaptive evolution, however, depends on the ecological niche of the species and can depend strongly on previous substitutions in that species. Adaptive evolution is therefore expected to be lineage-specific, at least moreso than purifying selection.
We observed that clustering exists between pairs of amino acid substitutions in different lineages as well as in the same lineage, the latter being consistently greater (Figure 4). Clustering across lineages implies that a substitution found in one lineage is predictive of the local substitution rate independent of lineage, which we understand as a lineage-non-specific local increase in the substitution rate. This is most consistent with a class (A) mechanism such as locally relaxed purifying selection, e.g. in an unstructured loop of a protein.
The excess clustering within lineages must be caused by a lineage-specific mechanism such as the class (B) mechanisms described above. Purifying selection can of course also vary in a lineage-specific way. If mildly-deleterious substitutions were highly clustered, and a reduced effective population size rendered them effectively neutral, this could result in excess clustering in the lower population size lineage. However, this scenario is inconsistent with the fact that we observe excess clustering within all lineages, and that it is quantitatively similar between lineage pairs diverging from a common ancestor. Locus-specific variation in purifying selection is also possible, but in most cases will affect an entire gene (e.g. via duplication or transformation into a pseudo-gene) and therefore would not lead to clustering on short length scales. Given that excess lineage-specific clustering is a substantial fraction of the total clustering in every lineage, it does not seem likely that lineage-specific variation in the strength of purifying selection can account for it.
Adaptive mechanisms for clustered substitutions
We start by addressing the potential contribution of hitch-hiking to clustering. A selective sweep of a strongly beneficial substitution fixes a linked haplotype, converting a local snapshot of polymorphisms present in the population into substitutions. This hitch-hiking process does not affect the fixation probability of neutral (and perhaps synonymous) mutations [45], but is expected to increase the fixation probability of nearby deleterious non-synonymous substitutions. However, several observations argue against hitchhiking as the main contributor to clustering. First, hitch-hiking predicts that the length scale of clustering is given by the typical size of hitchhiked region [46]. This implies clustering dependent on separation along the DNA sequence rather than along the protein backbone, contrary to our observations (Figure 2B). Second, there is no correlation between clustering and the average recombination rate of a coding sequence, which would affect the size of hitchhiked regions (Figure S3). Finally, we can calculate a rough upper bound for the contribution of hitchhiking to lineage-specific clustering. Given a per-site heterozygosity  , the expected population frequency of derived mutations per site is
  . Non-synonymous
  in D. melanogaster is
  per site [47]–[49] and thus
  per 4-fold codon (and slightly higher for 2-folds). Given this, the probability of finding a derived amino acid substitution within
  codons of a focal site is
  . This serves as a very generous upper bound on the contribution of hitch-hiking to
  , since only if the focal site is always adaptive and the observed variation always deleterious will this value be approached. This estimate suggests that the contribution of hitchhiking to lineage-specific clustering is minor, since this upper bound is less than the range over which we observe lineage-specific excess, from
  to
to  depending on lineage (Figure 4B).
The two remaining adaptive scenarios, adaptive bursts and complex adaptations, are difficult to distinguish in part because the boundary between them is not sharply delineated. Certainly, different substitutions within  codons in the same protein are never going to be completely independent. The question rather is whether one of the mutations ‘substantially’ affected the probability of the other. Do localized adaptive bursts, loosely defined as
  substitutions within
  codons which all independently improve fitness, dominate our clustering signal? Or are the interactions (epistasis) between nearby substitutions mainly responsible? We cannot fully exclude either scenario, but there is evidence that local interactions play at least a significant role. Mutations of independent beneficial effect would not be expected to compensate each others effect on total charge. This requires epistasis between the substitutions, and implies that complex adaptations are responsible for at least
  of lineage-specific excess. Secondly, independent beneficial mutations are expected to either fix sequentially or, if they do occur simultaneously, to generally segregate in repulsion [50]. This is inconsistent with the preferential cosegregation we observe between nearby derived alleles (Figure 6). Furthermore, charge compensation is only one of many relevant interactions, albeit the one we most readily ascertained from the primary sequence data. So the contribution of charge compensation is only a lower limit for the influence of complex adaptation on the substitution process.
While the possibility of interactions between amino acid substitutions has never been seriously questioned (and has recently been demonstrated in a number of concrete examples[42], [51]), the general importance of epistasis and compensation in evolution has been, and continues to be, controversial. We find evidence that a non-negligible fraction of substitutions are involved in patterns of adaptation suggestive of epistasis. If lineage-specific clustering is mostly due to epistasis, a scenario consistent with our results, we can use the lineage-specific excess to estimate the number of substitutions which owe their fixation to interactions with other substitutions. For example, the lineage-specific excess in the D. yakuba lineage is  Dyak
Dyak . If we attribute the entirety of this to epistasis we would conclude that
  of the substitutions on this lineage were contingent on another substitution. This estimate is clearly generous in the sense that we have not completely excluded the contribution of other processes, but it is also conservative in the sense that it only includes the effect of elevated local epistasis and excludes the contribution of long-range interactions.
To account for interactions between amino acids distant in the protein sequence but nevertheless in close vicinity in the folded protein, one would need to incorporate protein structure explicitly. However, the probability for any random pair of residues to be involved in such interaction decays rapidly with their separation along the protein backbone, likely to an asymptotic value. Hence, in our analysis we expect correlations between distant pairs to be lost in the background, with only the enriched short range interactions observable as excess clustering of substitutions. The presence of this local enrichment is the enabling factor behind our approach. In agreement with this interpretation, the inferred length scale of clustering of 10 codons is consistent with the size of secondary structure elements in proteins (e.g. 3 turns of an  helix). While this manuscript was prepared for publication, another group also found clustering of positively selected amino acid substitutions [17]. Via a different approach, the authors show that the rate of evolution depends on elements of secondary structure and that nearby positively selected sites tend to cluster.
Finally, while we have focused on the mode of evolution responsible for lineage-specific excess, the clear clustering which occurs across lineages is notable in its own right. We attribute this clustering to spatially heterogeneous purifying selection. The clustering length scale is extremely consistent across all the species comparisons we considered and the polymorphism data (Figure 2). This suggests that models of protein evolution might be improved by incorporating correlation between the rate of amino acid evolution along the sequence (e.g. site-specific  in PAML [52]). This is particularly true if the length scale we observe here can be shown to be consistent across phyla, demonstrating it as a generic property of proteins themselves.
Methods
We assign substitutions in coding sequence (CDS) on a codon-by-codon basis to pairwise alignments of the reference genome of D. melanogaster with the reference genomes of 6 other Drosophilids: D. sechellia, D. simulans, D. yakuba, D. erecta, D. ananassae and D. pseudoobscura. We use FlyBase release 5.26 gene models to identify the location of coding sequence in the D. melanogaster genome. Coding sequence substitutions are assigned only in the absence of gaps and ambiguous nucleotide. If the aligned codons encode different amino acids a non-synonymous substitution ( ) is assigned, if the same amino acid, a synonymous substitution (
 ). Substitutions are assigned in the context of an alignment between two lineages, which we can make explicit by writing
  where
where  is the pairwise alignment between lineages
  and
and  . We omit the alignment for notational convenience, the alignment under consideration will be clear by context, but it is worth remembering that the objects we define later depend implicitly on an alignment when they involve substitutions.
Substitutions are polarized into the lineage in which they arose by comparison to the closest available Drosophilid that is more distant from D. melanogaster than the one being aligned. Specifically, D. yakuba is used as the outgroup for the D. simulans and D. sechellia comparisons, D. ananassae for D. yakuba and D. erecta, D. pseudoobscura for D. ananassae and D. willistoni for D. pseudoobscura. Substitutions are assigned to a lineage  if the assignment is unambiguous using standard parsimony criteria. A
  polarized into lineage
  is denoted
  . Not all substitutions can be polarized,
  represents the fraction of substitutions between the lineages
  and
and  which are polarized. The species comparisons between D. melanogaster and either D. yakuba or D. erecta have the best properties for the analysis here: most coding sequence alignments pass quality checks and the number of substitutions, both polarizable and total, is high, as seen in Figure S1 and observed previously [53]. When we present results from just one species comparison it will be the D. melanogaster - D. yakuba comparison for this reason.
Having assigned and polarized substitutions, we study clustering between substitutions typed by synonymity, e.g. non-synonymous (DN) and synonymous (DS) divergent sites, by estimating the probability of finding a substitution (of some particular type)  codons away from a focal substitution. This is formalized as a conditional probability distribution (cPDF), which we denote
  , where
  is the focal substitution type, and
  is the substitution whose frequency is measured at distance
  .
.  and
and  can be simply DN or DS, or in the later analysis a substitution polarized to a particular lineage.
The cPDF  is calculated from a set of CDSs on which the presence/absence of substitutions
  and
and  have been ascertained site-by-site.
  is the proportion of sites a distance
  downstream (coding sense) of a substitution of type
  , summed over all instances of
  in the data set. We must account for the decrease in the number of observations made as
  increases due to the finite length of coding sequences. To be precise, the cPDF is calculated as follows: Let us label individual CDSs with
  and index the codons in a CDS by
  , which ranges from
  to the length of the CDS,
  . We define an indicator variable
  for each CDS
  and substitution type
  .
.  if codon
  of
of  contains an
  substitution, and is
  otherwise. The cPDF is defined as,
 |
(1) |
where the Kronecker symbol  if
if  and 0 otherwise. These cPDFs generically go to an ‘asymptotic value’
  , which is calculated ad-hoc by averaging
  over
over  . This property allows us to separate the functional dependence of a cPDF on distance
  from its absolute value by introducing the ‘normalized’ cPDF
  .
.
The cPDF naturally generalizes to include polarization information. Polarized cPDFs are defined as above, with  ,
,  , and an additional summation over the lineages,
  . A same-lineage cPDF enforces the same-lineage condition with a Kronecker delta
  , different-lineage with
  .
.
We define the clustering count  as the sum of the difference between the cPDF and its asymptotic value over the first
  codons, i.e. the area between
  and the asymptotic value of the cPDF
  over
over  . This is the difference between the expected number of
  substitutions within
  codons downstream of a focal
  substitution and the expected number in a
  codon sequence segment that is distant from the focal substitution. The choice of
  as the upper limit of the sum simply reflects the observation that significant clustering does not extend past this point. Additionally, this is a one-sided sum, ensuring that each pair is counted only once. We also define the lineage-specific excess clustering count for lineage
  ,
,  , in order to quantify the stronger clustering within a lineage. Lineage-specific excess is found by summing over the difference between the normalized same-lineage cPDF and the normalized cross-lineage cPDF and then ‘unnormalizing’,
| (2) |
 |
(3) |
The factor of  , defined above, corrects
  for the fraction of substitutions that cannot be unambiguously polarized. Multiplying by
  roughly accounts for this by assuming that the polarized substitutions are representative of the unpolarized ones. When
  or
or  are written without indices they should be assumed to refer to
  clustering, i.e.
  . Note that
  and
and  depend on the pairwise alignment
  being considered via their dependence on the assignment of substitutions, as described at the beginning of the Methods.
Our definition of cPDFs implicitly involved the determination of the set of CDSs to be summed over. This set varies with the species comparison so we denote it  . For the results presented here
  was the set of all CDSs for which the pairwise alignment between D. melanogaster and sister Drosophilid met several standards of quality: a CDS included in
  was required to have less than
  gapping in its pairwise alignment and less than
  amino acid substitution, the alignment could not contain out-of-frame gaps (gaps with size that is not a multiple of three), and the spliced transcript to which the CDS belongs could contain no extraneous stop codons. Furthermore, we often restrict
  to a specific subset in order to investigate the dependence of the clustering signal on various quantities, e.g. Figure 3B shows the cPDFs calculated using subsets of all CDSs ranked by
  .
.
Polymorphisms were identified in a Zimbabwean population sample of male D. melanogaster. We re-sequenced  kb of coding sequence from
  genes in the highly recombining region of the X-chromosome (cytological positions 3C3 to 18F4) using standard methods reported previously [54]. Samples sizes ranged from
  to
to  with a mean of
  . A subset of these sequences (
 alleles for each of
  loci), were previously reported [54]. All new sequences have been submitted to GenBank, accession numbers are available in Table S3. Polymorphisms are assigned if more than one codon exists in the population sample at that site. Singletons are excluded from the analysis. A non-synonymous polymorphism is assigned if this set of codons encodes more than one amino acid, and a synonymous polymorphism if the number of codons exceeds the number of amino acids encoded. PN and PS assignment is not exclusive. Polarization into mutant/ancestral alleles is inferred by comparison to D. simulans (or D. sechellia when D. simulans is unavailable) at that site (i.e. standard parsimony criteria). cPDFs are constructed analogously to those involving substitutions.
All line plots presented are smoothed from the underlying data. We used a moving window averaging for smoothing, always with window size  . The contribution from each data point to the smoothed average was weighted by the number of ‘trials’ from which the value was estimated.
Assessment of significance
We assess two ‘types’ of significance here, sampling significance and bootstrapping significance. The assessment of sampling significance is understood by recalling how cPDFs are estimated.  is the mean of a set of trials which can have outcome either
  or
or  (Bernoulli random variables).
  is the same, it is just an average over a cPDF for
  . Trials consist of selecting a focal substitution of type
  , looking
  away on the sequence, and recording the presence (
 ) or absence (
 ) of a substitution of type
  . So, assessing the significance of values of
  or
or  is equivalent to assessing the significance of sums of Bernoulli random variables, for which we used chi-square tests.
Bootstrapping significance is also a measure of sampling significance, with the difference being that the effect of resampling is evaluated at the level of the largest unit in our analysis, the coding sequence. The probability distribution of a value of interest is constructed by resampling with replacement from the full set of coding sequences a ‘bootstrapped’ set of equal size, estimating the value of interest on that bootstrapped set, and repeating. Bootstrapping p-values are then determined from this estimate of the probability distribution. If the estimated distribution can be approximated as a gaussian, as is always the case here, the gaussian approximation is used to assign the p-value. A modification of this bootstrapping scheme was used for polymorphism cosegregation, and described there.
Supporting Information
Numbers of substitutions included in our analysis by species comparison. The number of substitutions included in our analysis varies with the species comparison considered. Increased species divergence increases the fraction of substituted sites, while sequence/alignment quality affects the proportion of coding sequence alignments which meet our quality thresholds (Methods). Polarized substitutions are those which can be unambiguously assigned to one lineage or the other by parsimony with the closest outgroup (Methods). The total number of codons in qualified coding sequences (divided by  ) is shown for reference. The species comparison of D. melanogaster to D. yakuba or D. erecta have the best statistical properties for our analysis, most coding sequences have qualifying alignments and the total number of substitutions is high.
(0.01 MB PDF)
Dependence of clustering on chromosome. A) The cPDFs  (solid lines) and
  (dashed lines) are estimated from chromosome-specific sets of coding sequences, for the D. melanogaster to D. yakuba species comparison. Little variation is found, even between the sex-linked X chromosome and the autosomes. B) Chromosome-specific
  ,
,  and
and  are plotted versus the chromosome over which they are estimated. Clustering is consistent across all chromosomes.
(0.03 MB PDF)
Dependence of clustering on recombination rate (cM/Mb). A) The cPDFs  (solid lines) and
  (dashed lines) are estimated from each decile of the full set of X-chromosome coding sequences ranked by average recombination rate, for the D. melanogaster to D. yakuba species comparison. No systematic relationship between recombination rate and clustering is observed. B)
  ,
,  and
and  are plotted versus the average recombination of each ranked decile. The lack of a relationship between recombination rate and clustering is confirmed. The sex-averaged recombination rate was estimated using 149 point estimates of the sex-averaged recombination rate (cM/Mb) across the X chromosome in D. melanogaster (Begun et al. 2007), the local recombination rate for each coding sequence was estimated by linear interpolation. The recombination rates at the telomere and centromere were assumed to be zero. Only the X chromosome was used because recombination rate is more accurately described on the X.
(0.05 MB PDF)
The dependence of clustering on gapping in the alignment. The cPDFs  ,
,  and
and  are estimated from the sets of coding sequences with and without gaps in their alignment for the D. melanogaster to D. yakuba species comparison. Alignments with gaps are expected to be of lower quality, potentially introducing an artefactual clustering signal. While the gapped sequences have slightly higher clustering, the difference is quantitatively slight and there is no qualitative difference. This suggests that misalignment is not the root cause of clustering.
(0.02 MB PDF)
Dependence of clustering on GC content. A) The cPDFs  (solid lines) and
  (dashed lines) are estimated from each decile of the full set of coding sequences ranked by their GC content for the D. melanogaster to D. yakuba species comparison. Increased GC content correlates with greater clustering, as is seen by the higher peak of
  when estimated on subsets of the coding sequence with high GC content. B)
  ,
,  and
and  are plotted versus average GC for the same coding sequence subsets used in panel A.
  increases with GC, and
  and
and  also show some evidence of correlation with GC content, although this is mostly driven by the highest and lowest GC deciles.
(0.05 MB PDF)
Unnormalized cPDFs between substitutions typed by synonymity. The deviation of the unnormalized cPDFS  ,
,  and
and  from their asymptotic value is shown for the species comparison of D. melanogaster to D. yakuba. While there is a small amount of synonymous clustering at very short scales, as evidenced by the small peak in
  and
and  near
near  , it is clear that this effect is an order of magnitude less than the non-synonymous clustering (
 ). This suggests that the mechanism primarily responsible for non-synonymous clustering does not apply to synonymous substitutions.
(0.02 MB PDF)
1,000 bootstrapped estimates of unnormalized cPDFs typed by synonymity. 1,000 Bootstrapped estimates of the unnormalized cPDFs  ,
,  and
and  are plotted for the species comparison of D. melanogaster to D. yakuba. The consistency of the cPDFs suggests that the conclusions we draw from this data, in particular that synonymous clustering is negligible relative to non-synonymous clustering, are not artefacts of a few anomalous genes, but instead reflect a generic characteristic of gene evolution.
(0.05 MB PNG)
1,000 bootstrapped estimates of non-synonymous and synonymous clustering counts. The clustering counts  ,
,  and
and  are estimated from 1,000 bootstrapped replicates of the D. melanogaster to D. yakuba species comparison. Non-synonymous clustering
  is an order of magnitude larger than the synonymous clustering counts
  and
and  , both of which have bootstrapping distributions overlapping zero. We can extract a boot-strapping p-value from these distributions of
  for the hypothesis that
  (Methods), which roughly corresponds to the hypothesis that the mechanism responsible for clustering is blind to codon structure (non-selective). The factor of two reflects the roughly double target size for non-synonymous errors (first two positions versus third position).
(0.03 MB PDF)
The dependence of clustering on alignment methodology. The cPDFs  ,
,  and
and  are estimated from the alignments used in this paper (blastz genome alignments) and from coding sequence alignments of selected orthologs made publicly available as part of the twelve species analysis at ftp://ftp.flybase.net/genomes/12_species_analysis/clark_eisen/alignments/. In both cases the same underlying sequences are being used, but the selection of orthologs and alignment methodology are different. The concordance between the clustering observed in both cases indicates that clustering is not an artefact of some detail of the alignment methodology.
(0.02 MB PDF)
Bootstrap distributions of  by lineage
  .
.  is the lineage-specific excess of synonymous substitutions near non-synonymous substitutions, normalized by the overall level of synonymous divergence in the lineage
  -
-  . Consideration of this quantity serves as a particularly effective synonymous control for the contribution of non-selective processes to
  . The bootstrap estimates of the probability distribution of
  (Methods) are plotted here for every lineage included in this study. Every distribution overlaps zero, suggesting little to no contribution to clustering from non-selective processes, except for the Dsec and Dsim lineages. Both of these lineages have significant lineage-specific synonymous clustering with the effect in Dsim being particularly strong. These results suggest that some non-selective process (such as sequencing error) could be contributing to the lineage-specific clustering in these lineages, and
  in particular.
(0.02 MB PDF)
Magnitude and significance of lineage-specific clustering  . The magnitude of
  is recorded for both lineages of each species comparison considered. All lineages have positive
  , which indicates that clustering is stronger within that lineage than it is between that lineage and the lineage to which it is being compared. The significance of this is quantified by calculating the p-value for the hypothesis that
  . Both a sampling p-value, calculated using a chi-square test, and a bootstrapping p-value, calculated using the bootstrap estimate of the probability distribution of
  , are determined (Methods). Every lineage has significant excess lineage-specific clustering, using either measure of significance.
(0.04 MB PDF)
Correlations between charge-altering substitutions as a function of sequence separation. The hypothesis that the fraction of substitutions causing correlated changes in charge is elevated when the substitutions are within  codons of one other is tested. Pairs of substitutions are typed by whether the substitutions occurred on the (s)ame or (d)ifferent lineages. Conditioned on the focal divergence altering charge, the fraction of substitutions a distance
  away which are (c)ompensatory and (r)einforcing are considered, compensation being charge alterations in opposite directions, and reinforcement when in the same direction. The chi-square p-values are listed, with subscripts indicating the lineage condition and charge relationship being tested, e.g.
  is the p-value for the hypothesis that same-lineage substitutions within
  codons of each other do not have an increased probability to cause compensating changes in charge compared to same-lineage substitutions distant from one another. We find that charge compensation is significantly more frequent among nearby substitutions in the same lineage, but not when the substitutions arose on different lineages. Interestingly, nearby substitutions on different lineages do have a consistently significant increased frequency to cause positively correlated changes in charge, perhaps indicating convergent evolution. The ‘fraction compensated’ is the average net charge compensation caused by same-lineage substitutions within
  codons of a focal charge-altering substitution. The contribution of local charge compensation to lineage specific excess clustering
  is also estimated for each lineage. Local charge compensation consistently accounts for between
  and
and  of
of  .
.
(0.04 MB PDF)
Accessions numbers for sequences from our population sample. We re-sequenced Zimbabwean population sample of male D. melanogaster at loci in  genes in the highly recombining region of the X-chromosome (cytological positions 3C3 to 18F4) using standard methods reported previously [54]. The GenBank accessions numbers of these sequences are shown here.
(0.04 MB XLS)
Acknowledgments
We thank Guy Sella for sharing his observations on clustering of amino acid substitutions in the Drosophila data, Dan Davison for comments on the manuscript, Karen Wong for technical assistance. We acknowledge stimulating discussions with Martin Kreitman and other participants of the “Population Genetics and Genomics” program at the KITP, where this work was initiated.
Footnotes
The authors have declared that no competing interests exist.
This research was supported in part by the National Science Foundation under Grant No. NSF PHY05-51164. RAN acknowledges support through the Harvey L. Karp Discovery Award. The funders had no role in study design, data collection and analysis, decision to publish, or preparation of the manuscript.
References
- 1.Kimura M. Cambridge: Cambridge University Press; 1983. The neutral theory of molecular evolution. [Google Scholar]
- 2.Gillespie JH. Oxford: Oxford University Press; 1991. The Causes of Molecular Evolution. [Google Scholar]
- 3.Hey J. The neutralist, the y and the selectionist. Trends in Ecology & Evolution. 1999;14:35–38. doi: 10.1016/s0169-5347(98)01497-9. [DOI] [PubMed] [Google Scholar]
- 4.Nei M. Selectionism and neutralism in molecular evolution. Molecular Biology and Evolution. 2005;22:2318–2342. doi: 10.1093/molbev/msi242. [DOI] [PMC free article] [PubMed] [Google Scholar]
- 5.Sella G, Petrov DA, Przeworski M, Andolfatto P. Pervasive natural selection in the drosophila genome? PLoS Genet. 2009;5:e1000495. doi: 10.1371/journal.pgen.1000495. doi: 10.1371/journal.pgen.1000495. [DOI] [PMC free article] [PubMed] [Google Scholar]
- 6.Smith NGC, Eyre-Walker A. Adaptive protein evolution in drosophila. Nature. 2002;415:1022–4. doi: 10.1038/4151022a. [DOI] [PubMed] [Google Scholar]
- 7.Fay JC, Wyckoff GJ, Wu CI. Testing the neutral theory of molecular evolution with genomic data from drosophila. Nature. 2002;415:1024–1026. doi: 10.1038/4151024a. [DOI] [PubMed] [Google Scholar]
- 8.McDonald JH, Kreitman M. Adaptive protein evolution at the adh locus in drosophila. Nature. 1991;351:652–4. doi: 10.1038/351652a0. [DOI] [PubMed] [Google Scholar]
- 9.Eyre-Walker A. The genomic rate of adaptive evolution. Trends in Ecology & Evolution. 2006;21:569–575. doi: 10.1016/j.tree.2006.06.015. [DOI] [PubMed] [Google Scholar]
- 10.Ohta T. The nearly neutral theory of molecular evolution. Annual Review of Ecology and Systematics. 1992;23:263–286. [Google Scholar]
- 11.Hughes AL. Looking for darwin in all the wrong places: the misguided quest for positive selection at the nucleotide sequence level. Heredity. 2007;99:364–373. doi: 10.1038/sj.hdy.6801031. [DOI] [PubMed] [Google Scholar]
- 12.Branden C, Tooze J. New York: Garland Science; 1999. Introduction to protein structure. [Google Scholar]
- 13.Chothia C, Lesk AM. The relation between the divergence of sequence and structure in proteins. EMBO Journal. 1986;5:823–26. doi: 10.1002/j.1460-2075.1986.tb04288.x. [DOI] [PMC free article] [PubMed] [Google Scholar]
- 14.Olivier Lichtarge HRB, Cohen FE. An evolutionary trace method defines binding surfaces common to protein families. J Mol Biol. 1996:342–358. doi: 10.1006/jmbi.1996.0167. [DOI] [PubMed] [Google Scholar]
- 15.Fitch W, Markowitz E. An improved method for determining codon variability in a gene and its application to the rate of fixation of mutations in evolution. Biochem Genet. 1970;4:579–593. doi: 10.1007/BF00486096. [DOI] [PubMed] [Google Scholar]
- 16.Zvelebil M, Barton G, Taylor W, Sternberg M. Prediction of protein secondary structure and active sites using the alignment of homologous sequences. J Mol Biol. 1987;195:957–961. doi: 10.1016/0022-2836(87)90501-8. [DOI] [PubMed] [Google Scholar]
- 17.Ridout K, Dixon C, Filatov D. Positive selection differs between protein secondary structure elements in drosophila. Genome Biology and Evolution. 2010;2010:166–179. doi: 10.1093/gbe/evq008. [DOI] [PMC free article] [PubMed] [Google Scholar]
- 18.Kirby DA, Muse SV, Stephan W. Maintenance of pre-mrna secondary structure by epistatic selection. PNAS. 1995;92:9047–9051. doi: 10.1073/pnas.92.20.9047. [DOI] [PMC free article] [PubMed] [Google Scholar]
- 19.Stephan W. The rate of compensatory evolution. Genetics. 1996;144:419–26. doi: 10.1093/genetics/144.1.419. [DOI] [PMC free article] [PubMed] [Google Scholar]
- 20.Meer MV, Kondrashov AS, Artzy-Randrup Y, Kondrashov FA. Compensatory evolution in mitochondrial trnas navigates valleys of low fitness. Nature. 2010;464:279–282. doi: 10.1038/nature08691. [DOI] [PubMed] [Google Scholar]
- 21.Whisstock JC, Lesk AM. Prediction of protein function from protein sequence and structure. Quarterly Reviews of Biophysics. 2004;36:307–340. doi: 10.1017/s0033583503003901. [DOI] [PubMed] [Google Scholar]
- 22.Neher E. How frequent are correlated changes in families of protein sequences? PNAS. 1994;91:98–102. doi: 10.1073/pnas.91.1.98. [DOI] [PMC free article] [PubMed] [Google Scholar]
- 23.Lockless SW, Ranganathan R. Evolutionarily conserved pathways of energetic connectivity in protein families. Science. 1999;286:295–9. doi: 10.1126/science.286.5438.295. [DOI] [PubMed] [Google Scholar]
- 24.Yeang CH, Haussler D. Detecting coevolution in and among protein domains. PLoS Comput Biol. 2007;3:e211. doi: 10.1371/journal.pcbi.0030211. doi: 10.1371/journal.pcbi.0030211. [DOI] [PMC free article] [PubMed] [Google Scholar]
- 25.Burger L, van Nimwegen E. Disentangling direct from indirect co-evolution of residues in protein alignments. PLoS Comput Biol. 2010;6:e1000633. doi: 10.1371/journal.pcbi.1000633. doi: 10.1371/journal.pcbi.1000633. [DOI] [PMC free article] [PubMed] [Google Scholar]
- 26.Wang Q, Lee C. Distinguishing functional amino acid covariation from background linkage disequilibrium in HIV protease and reverse transcriptase. PLoS ONE. 2007;2:e814. doi: 10.1371/journal.pone.0000814. doi: 10.1371/journal.pone.0000814. [DOI] [PMC free article] [PubMed] [Google Scholar]
- 27.Poon AFY, Swenson LC, Dong WWY, Deng W, Pond SLK, et al. Phylogenetic analysis of population-based and deep sequencing data to identify coevolving sites in the nef gene of hiv-1. MBE. 2010;27:819–832. doi: 10.1093/molbev/msp289. [DOI] [PMC free article] [PubMed] [Google Scholar]
- 28.Socolich M, Lockless SW, Russ WP, Lee H, Gardner KH, et al. Evolutionary information for specifying a protein fold. Nature. 2005;437:512–8. doi: 10.1038/nature03991. [DOI] [PubMed] [Google Scholar]
- 29.Consortium DG. Evolution of genes and genomes on the drosophila phylogeny. Nature. 2007;450:203–18. doi: 10.1038/nature06341. [DOI] [PubMed] [Google Scholar]
- 30.Schwartz S, Kent WJ, Smit A, Zhang Z, Baertsch R, et al. Human-mouse alignments with blastz. Genome Res. 2003;13:103–7. doi: 10.1101/gr.809403. [DOI] [PMC free article] [PubMed] [Google Scholar]
- 31.Karolchik D, Baertsch R, Diekhans M, Furey TS, Hinrichs A, et al. The ucsc genome browser database. Nucleic Acids Res. 2003;31:51–4. doi: 10.1093/nar/gkg129. [DOI] [PMC free article] [PubMed] [Google Scholar]
- 32.Colgin LM, Hackmann AFM, Emond MJ, Monnat RJ. The unexpected landscape of in vivo somatic mutation in a human epithelial cell lineage. PNAS. 2002;99:1437–42. doi: 10.1073/pnas.032655699. [DOI] [PMC free article] [PubMed] [Google Scholar]
- 33.Wang J, Gonzalez KD, Scaringe WA, Tsai K, Liu N, et al. Evidence for mutation showers. PNAS. 2007;104:8403–8. doi: 10.1073/pnas.0610902104. [DOI] [PMC free article] [PubMed] [Google Scholar]
- 34.Fukami-Kobayashi K, Schreiber D, Benner S. Detecting compensatory covariation signals in protein evolution using reconstructed ancestral sequences. Journal of Molecular Biology. 2002;319:729–743. doi: 10.1016/S0022-2836(02)00239-5. [DOI] [PubMed] [Google Scholar]
- 35.Slatkin M. Linkage disequilibrium - understanding the evolutionary past and mapping the medical future. Nat Rev Genet. 2008;9:477–485. doi: 10.1038/nrg2361. [DOI] [PMC free article] [PubMed] [Google Scholar]
- 36.Takahasi KR, Innan H. The direction of linkage disequilibrium: A new measure based on the ancestral-derived status of segregating alleles. Genetics. 2008;179:1705–1712. doi: 10.1534/genetics.107.085654. [DOI] [PMC free article] [PubMed] [Google Scholar]
- 37.Davis BH, Poon AFY, Whitlock MC. Compensatory mutations are repeatable and clustered within proteins. Proc Biol Sci. 2009;276:1823–7. doi: 10.1098/rspb.2008.1846. [DOI] [PMC free article] [PubMed] [Google Scholar]
- 38.Bazykin GA, Kondrashov FA, Ogurtsov AY, Sunyaev S, Kondrashov AS. Positive selection at sites of multiple amino acid replacements since rat-mouse divergence. Nature. 2004;429:558–62. doi: 10.1038/nature02601. [DOI] [PubMed] [Google Scholar]
- 39.Bazykin GA, Dushoff J, Levin SA, Kondrashov AS. Bursts of nonsynonymous substitutions in HIV-1 evolution reveal instances of positive selection at conservative protein sites. PNAS. 2006;103:19396–401. doi: 10.1073/pnas.0609484103. [DOI] [PMC free article] [PubMed] [Google Scholar]
- 40.Orr HA. A minimum on the mean number of steps taken in adaptive walks. Journal of Theoretical Biology. 2003;220:241–247. doi: 10.1006/jtbi.2003.3161. [DOI] [PubMed] [Google Scholar]
- 41.Kulathinal R, Bettencourt B, Hartl D. Compensated deleterious mutations in insect genomes. Science. 2004;306:1553–4. doi: 10.1126/science.1100522. [DOI] [PubMed] [Google Scholar]
- 42.Weinreich DM, Delaney NF, Depristo MA, Hartl DL. Darwinian evolution can follow only very few mutational paths to fitter proteins. Science. 2006;312:111–4. doi: 10.1126/science.1123539. [DOI] [PubMed] [Google Scholar]
- 43.Smith JM, Haigh J. The hitch-hiking effect of a favourable gene. Genetical Research. 1974;23:23–35. [PubMed] [Google Scholar]
- 44.Rice WR. Genetic hitchhiking and the evolution of reduced genetic activity of the y sex chromosome. Genetics. 1987;116:161–167. doi: 10.1093/genetics/116.1.161. [DOI] [PMC free article] [PubMed] [Google Scholar]
- 45.Birky CW, Walsh JB. Effects of linkage on rates of molecular evolution. PNAS. 1988;85:6414–6418. doi: 10.1073/pnas.85.17.6414. [DOI] [PMC free article] [PubMed] [Google Scholar]
- 46.Barton NH. Linkage and the limits to natural selection. Genetics. 1995;140:821–841. doi: 10.1093/genetics/140.2.821. [DOI] [PMC free article] [PubMed] [Google Scholar]
- 47.Andolfatto P. Adaptive evolution of non-coding DNA in drosophila. Nature. 2005;437:1149–52. doi: 10.1038/nature04107. [DOI] [PubMed] [Google Scholar]
- 48.Begun DJ, Holloway AK, Stevens K, Hillier LW, Poh YP, et al. Population genomics: Whole-genome analysis of polymorphism and divergence in drosophila simulans. PLoS Biol. 2007;5:e310. doi: 10.1371/journal.pbio.0050310. doi: 10.1371/journal.pbio.0050310. [DOI] [PMC free article] [PubMed] [Google Scholar]
- 49.Shapiro JA, Huang W, Zhang C, Hubisz MJ, Lu J, et al. Adaptive genic evolution in the drosophila genomes. PNAS. 2007;104:2271–2276. doi: 10.1073/pnas.0610385104. [DOI] [PMC free article] [PubMed] [Google Scholar]
- 50.Hill WG, Roberston A. The effect of linkage on limits to artificial selection. Genetical Research. 1966;8:269–294. [PubMed] [Google Scholar]
- 51.Ortlund EA, Bridgham JT, Redinbo MR, Thornton JW. Crystal structure of an ancient protein: evolution by conformational epistasis. Science. 2007;317:1544–8. doi: 10.1126/science.1142819. [DOI] [PMC free article] [PubMed] [Google Scholar]
- 52.Yang Z. Paml 4: Phylogenetic analysis by maximum likelihood. Molecular Biology and Evolution. 2007;24:1586–1591. doi: 10.1093/molbev/msm088. [DOI] [PubMed] [Google Scholar]
- 53.Tanay A, Siggia ED. Sequence context affects the rate of short insertions and deletions in ies and primates. Genome Biol. 2008;9:R37. doi: 10.1186/gb-2008-9-2-r37. [DOI] [PMC free article] [PubMed] [Google Scholar]
- 54.Andolfatto P. Hitchhiking effects of recurrent beneficial amino acid substitutions in the drosophila melanogaster genome. Genome Research. 2007;17:1755–1762. doi: 10.1101/gr.6691007. [DOI] [PMC free article] [PubMed] [Google Scholar]
Associated Data
This section collects any data citations, data availability statements, or supplementary materials included in this article.
Supplementary Materials
Numbers of substitutions included in our analysis by species comparison. The number of substitutions included in our analysis varies with the species comparison considered. Increased species divergence increases the fraction of substituted sites, while sequence/alignment quality affects the proportion of coding sequence alignments which meet our quality thresholds (Methods). Polarized substitutions are those which can be unambiguously assigned to one lineage or the other by parsimony with the closest outgroup (Methods). The total number of codons in qualified coding sequences (divided by ) is shown for reference. The species comparison of D. melanogaster to D. yakuba or D. erecta have the best statistical properties for our analysis, most coding sequences have qualifying alignments and the total number of substitutions is high.
(0.01 MB PDF)
Dependence of clustering on chromosome. A) The cPDFs (solid lines) and (dashed lines) are estimated from chromosome-specific sets of coding sequences, for the D. melanogaster to D. yakuba species comparison. Little variation is found, even between the sex-linked X chromosome and the autosomes. B) Chromosome-specific , and are plotted versus the chromosome over which they are estimated. Clustering is consistent across all chromosomes.
(0.03 MB PDF)
Dependence of clustering on recombination rate (cM/Mb). A) The cPDFs (solid lines) and (dashed lines) are estimated from each decile of the full set of X-chromosome coding sequences ranked by average recombination rate, for the D. melanogaster to D. yakuba species comparison. No systematic relationship between recombination rate and clustering is observed. B) , and are plotted versus the average recombination of each ranked decile. The lack of a relationship between recombination rate and clustering is confirmed. The sex-averaged recombination rate was estimated using 149 point estimates of the sex-averaged recombination rate (cM/Mb) across the X chromosome in D. melanogaster (Begun et al. 2007), the local recombination rate for each coding sequence was estimated by linear interpolation. The recombination rates at the telomere and centromere were assumed to be zero. Only the X chromosome was used because recombination rate is more accurately described on the X.
(0.05 MB PDF)
The dependence of clustering on gapping in the alignment. The cPDFs , and are estimated from the sets of coding sequences with and without gaps in their alignment for the D. melanogaster to D. yakuba species comparison. Alignments with gaps are expected to be of lower quality, potentially introducing an artefactual clustering signal. While the gapped sequences have slightly higher clustering, the difference is quantitatively slight and there is no qualitative difference. This suggests that misalignment is not the root cause of clustering.
(0.02 MB PDF)
Dependence of clustering on GC content. A) The cPDFs (solid lines) and (dashed lines) are estimated from each decile of the full set of coding sequences ranked by their GC content for the D. melanogaster to D. yakuba species comparison. Increased GC content correlates with greater clustering, as is seen by the higher peak of when estimated on subsets of the coding sequence with high GC content. B) , and are plotted versus average GC for the same coding sequence subsets used in panel A. increases with GC, and and also show some evidence of correlation with GC content, although this is mostly driven by the highest and lowest GC deciles.
(0.05 MB PDF)
Unnormalized cPDFs between substitutions typed by synonymity. The deviation of the unnormalized cPDFS , and from their asymptotic value is shown for the species comparison of D. melanogaster to D. yakuba. While there is a small amount of synonymous clustering at very short scales, as evidenced by the small peak in and near , it is clear that this effect is an order of magnitude less than the non-synonymous clustering (). This suggests that the mechanism primarily responsible for non-synonymous clustering does not apply to synonymous substitutions.
(0.02 MB PDF)
1,000 bootstrapped estimates of unnormalized cPDFs typed by synonymity. 1,000 Bootstrapped estimates of the unnormalized cPDFs , and are plotted for the species comparison of D. melanogaster to D. yakuba. The consistency of the cPDFs suggests that the conclusions we draw from this data, in particular that synonymous clustering is negligible relative to non-synonymous clustering, are not artefacts of a few anomalous genes, but instead reflect a generic characteristic of gene evolution.
(0.05 MB PNG)
1,000 bootstrapped estimates of non-synonymous and synonymous clustering counts. The clustering counts , and are estimated from 1,000 bootstrapped replicates of the D. melanogaster to D. yakuba species comparison. Non-synonymous clustering is an order of magnitude larger than the synonymous clustering counts and , both of which have bootstrapping distributions overlapping zero. We can extract a boot-strapping p-value from these distributions of for the hypothesis that (Methods), which roughly corresponds to the hypothesis that the mechanism responsible for clustering is blind to codon structure (non-selective). The factor of two reflects the roughly double target size for non-synonymous errors (first two positions versus third position).
(0.03 MB PDF)
The dependence of clustering on alignment methodology. The cPDFs , and are estimated from the alignments used in this paper (blastz genome alignments) and from coding sequence alignments of selected orthologs made publicly available as part of the twelve species analysis at ftp://ftp.flybase.net/genomes/12_species_analysis/clark_eisen/alignments/. In both cases the same underlying sequences are being used, but the selection of orthologs and alignment methodology are different. The concordance between the clustering observed in both cases indicates that clustering is not an artefact of some detail of the alignment methodology.
(0.02 MB PDF)
Bootstrap distributions of by lineage . is the lineage-specific excess of synonymous substitutions near non-synonymous substitutions, normalized by the overall level of synonymous divergence in the lineage - . Consideration of this quantity serves as a particularly effective synonymous control for the contribution of non-selective processes to . The bootstrap estimates of the probability distribution of (Methods) are plotted here for every lineage included in this study. Every distribution overlaps zero, suggesting little to no contribution to clustering from non-selective processes, except for the Dsec and Dsim lineages. Both of these lineages have significant lineage-specific synonymous clustering with the effect in Dsim being particularly strong. These results suggest that some non-selective process (such as sequencing error) could be contributing to the lineage-specific clustering in these lineages, and in particular.
(0.02 MB PDF)
Magnitude and significance of lineage-specific clustering . The magnitude of is recorded for both lineages of each species comparison considered. All lineages have positive , which indicates that clustering is stronger within that lineage than it is between that lineage and the lineage to which it is being compared. The significance of this is quantified by calculating the p-value for the hypothesis that . Both a sampling p-value, calculated using a chi-square test, and a bootstrapping p-value, calculated using the bootstrap estimate of the probability distribution of , are determined (Methods). Every lineage has significant excess lineage-specific clustering, using either measure of significance.
(0.04 MB PDF)
Correlations between charge-altering substitutions as a function of sequence separation. The hypothesis that the fraction of substitutions causing correlated changes in charge is elevated when the substitutions are within codons of one other is tested. Pairs of substitutions are typed by whether the substitutions occurred on the (s)ame or (d)ifferent lineages. Conditioned on the focal divergence altering charge, the fraction of substitutions a distance away which are (c)ompensatory and (r)einforcing are considered, compensation being charge alterations in opposite directions, and reinforcement when in the same direction. The chi-square p-values are listed, with subscripts indicating the lineage condition and charge relationship being tested, e.g. is the p-value for the hypothesis that same-lineage substitutions within codons of each other do not have an increased probability to cause compensating changes in charge compared to same-lineage substitutions distant from one another. We find that charge compensation is significantly more frequent among nearby substitutions in the same lineage, but not when the substitutions arose on different lineages. Interestingly, nearby substitutions on different lineages do have a consistently significant increased frequency to cause positively correlated changes in charge, perhaps indicating convergent evolution. The ‘fraction compensated’ is the average net charge compensation caused by same-lineage substitutions within codons of a focal charge-altering substitution. The contribution of local charge compensation to lineage specific excess clustering is also estimated for each lineage. Local charge compensation consistently accounts for between and of .
(0.04 MB PDF)
Accessions numbers for sequences from our population sample. We re-sequenced Zimbabwean population sample of male D. melanogaster at loci in genes in the highly recombining region of the X-chromosome (cytological positions 3C3 to 18F4) using standard methods reported previously [54]. The GenBank accessions numbers of these sequences are shown here.
(0.04 MB XLS)