Abstract
We present in this study an acoustic source reconstruction method using focused transducer with B mode imaging for magnetoacoustic tomography with magnetic induction (MAT-MI). MAT-MI is an imaging modality proposed for non-invasive conductivity imaging with high spatial resolution. In MAT-MI acoustic sources are generated in a conductive object by placing it in a static and a time-varying magnetic field. The acoustic waves from these sources propagate in all directions and are collected with transducers placed around the object. The collected signal is then usedto reconstruct the acoustic source distribution and to further estimate the electrical conductivity distribution of the object. A flat piston transducer acting as a point receiver has been used in previous MAT-MI systems to collect acoustic signals. In the present study we propose to use B mode scan scheme with a focused transducer that gives a signal gain in its focus region and improves the MAT-MI signal quality. A simulation protocol that can take into account different transducer designs and scan schemes for MAT-MI imaging is developed and used in our evaluation of different MAT-MI system designs. It is shown in our computer simulations that, as compared to the previous approach, the MAT-MI system using B-scan with a focused transducer allows MAT-MI imaging at a closer distance and has improved system sensitivity. In addition, the B scan imaging technique allows reconstruction of the MAT-MI acoustic sources with a discrete number of scanning locations which greatly increases the applicability of the MAT-MI approach especially when a continuous acoustic window is not available in real clinical applications. We have also conducted phantom experiments to evaluate the proposed method and the reconstructed image shows a good agreement with the target phantom.
Index Terms: electrical impedance, Magneto acoustic, impedance imaging, tomography
I. Introduction
Electrical impedance imaging of biological tissue has been of considerable interest. Several approaches like electrical impedance tomography (EIT) [1], magnetic resonance electrical impedance tomography (MREIT) [2], [3], current density impedance imaging (CDII) [4], magnetic induction tomography (MIT) [5], [6], magnetoacoustic tomography (MAT) [7], [8] and Hall effect imaging (HEI)[9], [10] have been explored to image tissue impedance distribution. Of these techniques EIT, MREIT and CDII use current injection with electrodes placed on the surface of the object. In EIT surface electrodes are also used to measure electric potentials due to different patterns of current injection and the measured potentials are then used to reconstruct the impedance distribution in the object. EIT allows real time imaging and it is low cost. The surface potential measurements however lead to an ill-posed inverse problem and low spatial resolution with this technique. MREIT and CDII use measurement data of magnetic flux density generated by the injected current inside the sample. These data are acquired from magnetic resonance phase images and used to reconstruct the electrical conductivity distribution of the sample. MREIT gives high spatial resolution conductivity images. However MREIT is currently limited by its requirement of high level current injection to obtain acceptable signal-to-noise (SNR) level. CDII requires the object to be rotated in the MRI system to obtain the complete current density which is then used to reconstruct the conductivity distribution. MIT uses a time varying magnetic field and measures the secondary magnetic field produced by the induced eddy currents. With MIT, like EIT, the surface coil measurements of the secondary magnetic field leads to an ill-posed inverse problem while reconstructing the images. In MAT and HEI spontaneous or injected currents in a static magnetic field are used to induce Lorentz force based acoustic vibrations in the object and acoustic measurements from around the object are used to reconstruct the image. These imaging methods also use surface electrodes for current injection/voltage measurements. This leads to the problem of “shielding effect” in these techniques [11] caused by an insulating or low conductive region surrounding the object, such as subcutaneous fat tissue in the human body.
Magnetoacoustic tomography with magnetic induction (MAT-MI) [11]–[20] is a recently proposed approach to image electrical impedance distribution with high spatial resolution. In MAT-MI magnetic fields are used to induce current and hence the method does not suffer from the shielding effect. With MAT-MI ultrasound is generated in the object to be imaged by placing it in a dynamic and a static magnetic field. Eddy currents are induced in the object due to the dynamic field. The static field leads to generation of acoustic vibrations from Lorentz force on the induced currents. The acoustic vibrations are at the same frequency as the dynamic magnetic field which is chosen to match the ultrasound frequency range. This allows us to reconstruct the acoustic source distribution in the object using possible ultrasound imaging approaches. The conductivity distribution of the object can then be reconstructed from the obtained acoustic source map [11], [14], [20]. The use of ultrasound imaging in MAT-MI allows this technique to have high spatial resolution.
Previously with MAT-MI, the acoustic source imaging was done using a point receiver based method. An ideal point receiver has very low sensitivity due to the size of the aperture. Therefore in previous MAT-MI imaging system a point receiver was implemented with a piston transducer of finite aperture size. The omnidirectional nature of the point receiver was achieved by placing the object in a region of approximately uniform sensitivity as shown in figure 1(a). However, as seen in this figure, to obtain the uniform sensitivity, it requires the object to be placed at a relatively large distance away from the transducer and also away from its maximum sensitivity region. The transducer is scanned around the object, forming a continuous aperture, for image reconstruction [11], [13], [14] as shown in figure 1(b). Other techniques of acoustic source imaging using virtual point detectors with scanning around the object have been tried out for photoacoustic tomography (PAT). These methods, like using a large numerical aperture transducer [21] or with negative lens[22], have been proposed to improve the sensitivity of the receiver and shorten the scanning radius. These techniques based on virtual point detectors however much like the piston transducer acting as a point receiver, need scanning to be done on a continuous aperture around the object.
Fig 1.
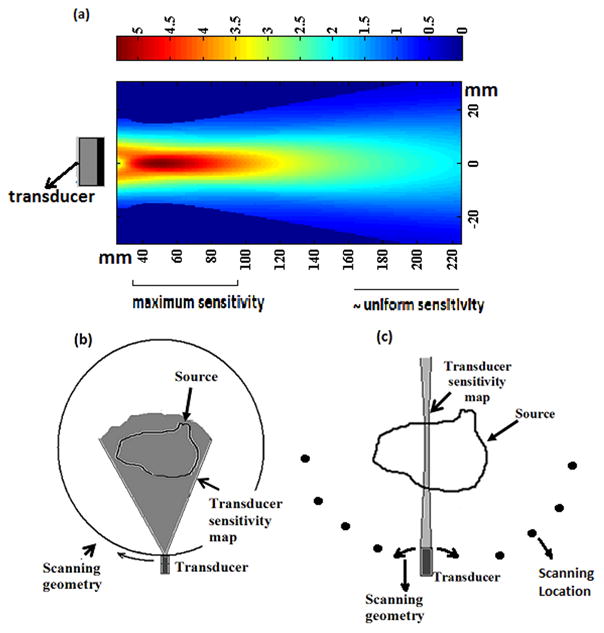
(a) Sensitivity map of a piston transducer (b)-(c) Schematic of image reconstruction schemes for MAT-MI for a given transducer and source distribution (b) Point receiver with scanning around the object (c) Sector-Scan with focus transducer and scanning at different locations around the object
In the present study, the focus region of a transducer is used with B mode scan scheme to reconstruct the MAT-MI ultrasound source distribution. The image reconstruction with a large focus transducer has benefits of improved sensitivity for ultrasound based imaging systems like MAT-MI, PAT, and HEI. The imaging techniques studied with a large transducer are also useful for dual mode ultrasound arrays (DMUA), which use large ultrasound transducer elements for therapeutic applications and imaging the target tissue.
The focus region of a transducer has the maximum sensitivity as seen in figure 1(a). Utilizing such kind of focus region, the transducer receives signal generated mainly from sources in a relatively narrow beam region along its acoustic axis. These sources are time resolved in the collected signal due to time of flight difference to the transducer. The signal obtained is backprojected to reconstruct acoustic sources in the beam region. However, the signal received from a smoothly distributed acoustic source is the strongest when the transducer axis is perpendicular to the source distribution [23], [24]. Therefore to obtain a complete image of the MAT-MI sources, we need to set the transducer to face various edges of the source distribution. This is achieved by rotating the transducer at a location to scan along various lines through the object. This is then repeated at a number of locations around the object for complete image reconstruction and only a discrete number of scanning locations around the object are needed. This kind of scanning scheme is shown in figure 1(c). To evaluate different MAT-MI system designs, we have developed a simulation protocol that can take into account different transducer designs and scan schemes for MAT-MI imaging. It is shown in our computer simulations that, as compared to the previous approach, the MAT-MI system using B-scan with a focused transducer allows MAT-MI imaging at a closer distance and has improved system sensitivity. In addition, the B scan imaging technique allows reconstruction of the MAT-MI acoustic sources with a discrete number of scanning locations which greatly increases the applicability of the MAT-MI approach. We have also conducted phantom experiments and evaluated the proposed method.
II. Theory
A. MAT-MI Forward Problem
The forward problem of MAT-MI describes the physical process by which magnetic fields induce ultrasound signal in a conductive object. A time varying magnetic field induces an electric field in an object according to Faraday’s law.
| (1) |
Here B1(t) is the applied time varying magnetic field and E is the induced electric field. In an object with conductivity σ the induced electric field leads to eddy currents J=σE. The eddy currents in a static magnetic field B0 are subject to Lorentz force J× B0 and the time varying Lorentz force gives rise to a travelling acoustic wave. The generated acoustic waves are governed by the following wave equation [11]:
| (2) |
where p is the pressure and cs is the acoustic speed in the medium. Using Green’s function the solution to (2) can be written as (3)
| (3) |
Where r′ is the location of the acoustic source, R= |r− r′|, and V is the volume containing the acoustic source. This equation gives the observed pressure for an impulse source i.e. a source with its function in time to be δ(t). An induced acoustic source field with time dependence f (t) gives an observed pressure p(r,t) ⊗ f (t), where ⊗ is convolution operator.
The signal received at the ultrasound transducer with a finite aperture size can be described as follows:
| (4) |
On combining (3) and (4), we can get
| (5) |
Here we define the term hr(r′,t) as
| (6) |
This is the spatial impulse response of the transducer located at position r and it is a characteristic of the transducer’s geometry. The effect of the electromechanical impulse response of the transducer e(t) and the temporal waveform of the induced acoustic fields f (t) on the obtained pressure signal can be accounted for in the forward computation by convolving the spatial impulse response with these waveforms (hr (r′,t) ⊗ f (t) ⊗ e(t)).
B. Image Reconstruction with B Scan
The acoustic source reconstruction with B-scan imaging using the focussed transducer involves backprojecting the signal along the focus of the transducer. This gives a 1D image of the object also known as a B-scan. The transducer is then rotated at the location to face various lines through the object. The entire angle over which the transducer is rotated is fixed to cover the object dimensions. The individual 1D images obtained at different angles during the rotation are added up and this gives a sector scan image. To obtain a complete image, sector scan images are collected at a number of locations around the object and are added up to form the final image. This is called a compound scan. This scheme of scanning ensures that the transducer faces the various edges in the object and gives a complete reconstruction of the acoustic source distribution.
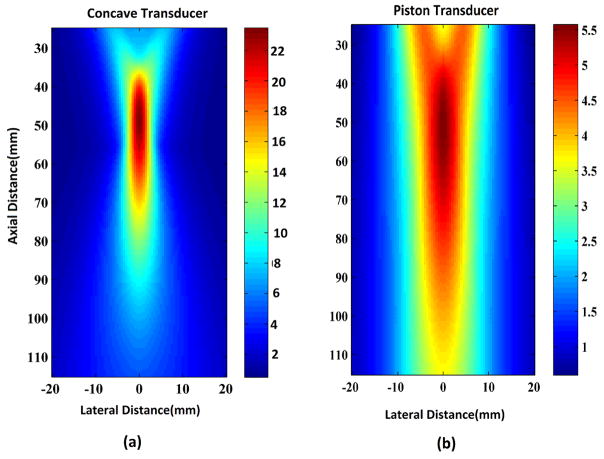
While forming those 1D images with backprojection it is assumed that the transducer beam is a narrow 1D line. However the actual transducer has a finite beam width as seen in figure 2 which is generally termed the “directivity” of the transducer. Taking this into account, a simplified backprojection process for estimating the acoustic source A(r′)= ∇·(J× B0) can be described by the following equation
Fig 2.
(a) Gain map of a concave transducer (b) Gain map of a piston transducer
| (7) |
The term gn(R) accounts for the effect of transducer’s directivity and acts as weighting term to maintain an uniform quality throughout the image [19], where R= |r− r′|, r is the location of the transducer and r′ is the location of the acoustic source. The term gn(R) is determined by the strength of the transducer’s spatial impulse response hr (r′,t) at time tR, where tR is the time at which the signal from source location arrives at the transducer For the current work the directivity has been obtained from simulations of the transducer’s spatial impulse response. The imaging algorithm described by (7) can be used to determine the point spread function (PSF) of the system. The reconstructed image is the convolution of the acoustic source ∇·(J× B0) and the system PSF. Therefore the PSF determines the imaging quality and the predicted PSF can be used to filter the image to improve the accuracy of the reconstruction.
We have used 2D Fourier filtering as described by the following equation
| (8) |
Where , Ik, n, dk, n are the 2D FFT of the filtered image, reconstructed image and the PSF. The term β is a regularization parameter to reduce the effect of noise during filtering and is determined based on SNR considerations.
In the experiment system noise degrades the final reconstruction and the noise unlike the signal from an acoustic source adds up incoherently during the backprojection process. This can be suppressed by multiplying the image with a coherence factor (CF) [27] given by
| (9) |
Where If is a B scan image added in the final compound scan and N is the total number of B scans. The numerator represents the total coherent energy at a point; the denominator denotes the total incoherent energy. At points in the image other than the source location where incoherent noise dominates, the denominator is much larger than the numerator thus suppressing the noise.
III. Method
A. Computer Simulation
The MAT-MI acoustic source is the divergence of the Lorentz force (∇·(J× B0)) and it depends on the variation of the induced eddy current in the object, This leads to a strong MAT-MI acoustic source at the conductivity boundaries due to a big variation of the induced current from the conductivity change at all these boundaries. This has been observed in experiment and previous simulation studies [13]–[15]. In the current study FEM simulations using COMSOL software were used to determine the induced eddy current densities in the object. The static and dynamic magnetic fields are assumed to be uniform over the entire object and the corresponding acoustic sources obtained from the simulation are also observed to be the strongest at the conductivity boundaries. Thus in the current study, the MAT-MI acoustic source is assumed to be only from conductivity boundaries in the object.
Ultrasonic imaging simulations were performed with Field II software [25]. The software allows defining transducers of various geometries. The spatial impulse response of the transducer is calculated in the software by breaking the transducer surface into smaller elements. The program also allows simulating the transducer’s electromechanical impulse response. In the current simulations this is set to the experimentally measured electromechanical impulse response of the transducer obtained with a wide band hydrophone.
B scan imaging simulations are performed with a 500 KHz, 4 cm diameter concave transducer with a 5.5 cm focus. For comparison, a piston transducer with 500 KHz central frequency and 2cm diameter is also used in our simulation study. The piston transducer can be used for the two imaging techniques as described in section 1. The gain map of this transducer in the focus region is shown in figure 2(b). The concave transducer is a larger focus transducer and has a narrower, stronger beam as compared to the piston transducer as seen in figure 2(a). This gives a better spatial resolution and improved sensitivity of 4 times while imaging with B scan method as seen from the color bars for the gain maps in figure 2. The concave transducer simulated here has a beam length of about 4–5 cm around a focal length of 5.5 cm. So an object space of 4 cm by 4 cm is used in the present simulation study and the locations at which the sector scans for the compound scan are performed are 5.5 cm away from the center of the object space. The bandwidth of both the transducers is around 60% of their centre frequency (500 kHz).
The received pressure signal is computed according to (5). At a given transducer location the spatial impulse response is computed at each source location. The received signal is then obtained by adding up the spatial impulse response multiplied with the source amplitude. This process is then repeated for each transducer orientations and locations employed in the compound scan.
The image reconstruction is done by using (6). In the current compound scan scheme 180 degree view angle [24] around the object is used. This gives a complete image reconstruction. The resolution of the reconstruction is about 3–4 mm at 500kHz transducer frequency with a 60 % bandwidth [13].
B. Experiment
We have also evaluated the proposed method in MAT-MI experiments. The experimental setup consists of two permanent magnets used like a Helmholtz pair to get an approximately uniform magnetic field of 0.2T between them. A pair of coils again in Helmholtz configuration is used to generate the dynamic magnetic field. The coil is driven by a current source generating one cycle of sine wave at each pulse. A Gage CompuScope AD converter is used for data acquisition. The transducer signal is amplified by 90 dB and sampled at 10 MHz. The transducers for the current experiments are from Panametrics (center frequency 1 MHz, 9 cm focal length, 4.5cm diameter). The phantom and the transducer are immersed in water for better ultrasound coupling. The signal is averaged 2000 times to improve the SNR. The scanning stage consists of 4 stepper motors capable of moving along x,y and z direction and also rotating the transducer to a desired angle. The schematic diagram of the setup is shown in figure 3.
Fig 3.

Schematic diagram of present experiment system
The backprojection method as described in section 2.2 is used for image reconstruction. The reconstructed image is also multiplied by a coherence factor (CF) to further improve the SNR.
IV. Results
A. Simulation Results
A simulation example is shown in figure 4. An object of 2 concentric circles with inner circle conductivity of 0.6S/m and outer circle conductivity of 0.3S/m in a background of 0 S/m is imaged in this simulation. The induced current density is obtained with FEM simulations using COMSOL software. This is then used to compute the acoustic source distribution which is shown in figure 4(b). As it can be seen here the acoustic source is strongest at the conductivity boundaries.
Fig 4.
(a) Object conductivity distribution (b) Simulated acoustic source (c) Simulated signal received at the transducer (d) Reconstructed acoustic source distribution
The acoustic source distribution is used to compute the signal received at the transducer. A typical signal received with the concave transducer 5.5 cm from the origin is seen here in figure 4(c). In this case the transducer’s acoustic axis passes through the object centre and the four pulses seen in the received signal corresponds to the four object boundaries. The signal obtained at various transducer locations as described in the scanning scheme are then used to reconstruct the acoustic sources as described in section 2.2. The bandwidth used in the simulation is around 300 kHz. This results in an image resolution of about 3–4mm which leads to a thicker boundary after reconstruction.
The directional nature of MAT-MI acoustic source reconstruction can be seen in the image reconstruction result in figure 5. The target object is a 2 cm diameter circle. Image reconstruction from sector scan data at 3 locations: 0, 35 and 55 degrees from around the object are shown in figure 5(a)-(c). From the individual sector scan images it can be seen that only the acoustic sources parallel to the transducer get reconstructed. A complete reconstruction of the object is obtained by adding all the individual sector scans in the final compound scan.
Fig 5.
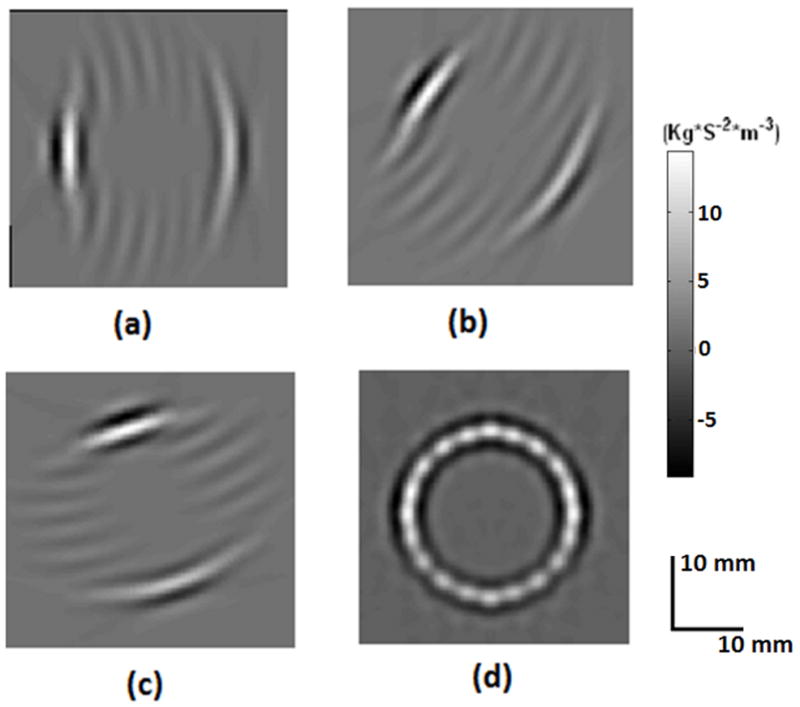
Image reconstruction of a 1 cm circular object (a)-(c) Sector scans at 0,35,55 degrees, respectively (d) Compound scan image obtained by adding all the individual sector scans
The acoustic source reconstruction results in the presence of noise are shown in figure 6. Two target acoustic source distributions are shown in figure 6(a) and figure 6(b) shows the image reconstruction with no noise added to the scans. Image reconstruction with varying SNR is shown in figure 6(c)-(e), the maximum SNRs of the scans used in each of the compound scan images shown here are fixed at 10, 5 and 2, respectively.
Fig 6.
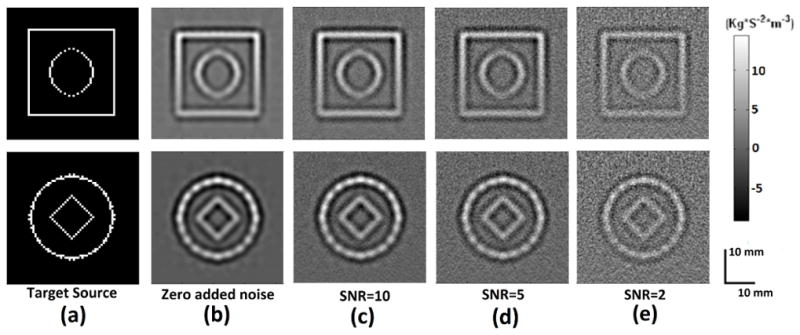
(a) Target source (b)-(e) Reconstructed source distribution (b) No added noise (c) SNR=10 (d) SNR=5 (e) SNR=2
The backprojection method for image reconstruction has the effect of averaging signal from various locations around the object and this improves the SNR of the reconstructed image. As shown in figure 6, a reasonable image reconstruction is still obtained with a SNR of 2.
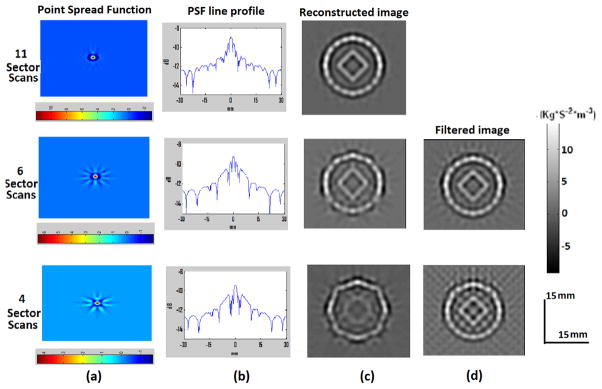
The simulation method can also be used to predict the point spread function (PSF) of the reconstruction scheme and this kind of PSF can be used to filter the image to give a more accurate reconstruction. This is seen in figure 7 where the number of transducer locations used for reconstruction is reduced from 11 sector scans which give a complete reconstruction to 6 and 4 sector scans. The resultant point spread functions for these different numbers of scanning locations are shown in figure 7(a) and these PSFs can be used to filter the reconstructed images. We have used 2D Fourier filter for the image filtering as described in section II.B. However the filtering process is very sensitive to errors in the reconstructed image [27] and to reduce the effect of noise in the filtered image we have used the PSF from 11 sector scans as target PSF. The filtered images show a better reconstruction of the target source distribution as shown in figure 7.
Fig 7.
Images reconstructed with compound scan. The three rows from top to bottom correspond to 11, 6 and 4 sector scans in the compound scan. (a) Point spread function for each scanning scheme (b) A line profile from the PSF (c) Reconstructed image (d) PSF filtered image
As mentioned in section 1 we have used a continuous scanning scheme using a point receiver in previous MAT-MI system and currently we have implemented a compound scan scheme. We have compared these two scanning methods in computer simulations. For comparison we have used the same piston transducer for image reconstruction. The region at the transition from near field to far field provides certain focussing of the piston transducer as seen in figure 1(a) and this region is used for the compound scan scheme. The piston transducer gives a uniform sensitivity at a farther distance as described in section 1 and can act as a point receiver.
We have compared in simulation the distance required for accurate image reconstruction using the two methods and the resultant SNR of the reconstructed images. As shown in figure 8, square acoustic sources of 1, 2 and 4 cm are used for this testing. Image reconstructions using the point receiver method with a scanning radius of 5.5 cm, 10 cm and 20 cm are compared with those using the compound scan method with a scanning radius of 5.5 cm, which equals to the transducer’s focal length. Equal noise is added to each received signal with the highest SNR in the data being 5 and 200 scan lines are used with each reconstruction. For each of the source the image reconstructed with various scanning distances is shown in the figure. It can be seen in the figure that the point receiver method reconstructs the 1 cm square at all the three scanning radius and as the size of square increases to 4 cm a complete reconstruction is obtained only at scanning distance around 20 cm, the compound scan method on the other hand reconstructs the sources at 5.5 cm scanning radius. As expected, because the point receiver method requires a uniform gain for image reconstruction, at a closer distance only smaller objects get completely reconstructed. To completely image a larger object with the size of 2–4 cm the transducer has to be placed around 10–20 cm away from the imaging centre and this will inevitably reduce the sensitivity of the receiver. This can be seen in figure 8 where the complete image reconstruction with point receiver scheme at 20cm has the lowest image SNR. In comparison, with compound scan, the most sensitive region of the transducer’s spatial gain map is used while a complete image reconstruction can still be obtained. As shown in figure 8, the resultant SNR using the compound scan is much better as compared to the point receiver scheme.
Fig 8.

Images of reconstructed source distributed along a square. Each column from left to right corresponds to either different scanning method or different scanning distance. Each row from top to bottom corresponds to the square imaging object of size 1cm, 2cm and 4 cm. Equal noise was added to the acoustic signals in each scan.
B. Experiment Results
We have also applied the developed technique to MAT-MI experiments. Phantoms made of pork skin gel have been used in these experiments. In the first experiment we use a phantom consisting of an approximately 2cm square gel block of 10 % salinity embedded in a 0% gel. As shown in figure 9, the directional nature of the MAT-MI sources can be seen in the reconstruction with the transducers facing only one side of the object and reconstructing only the edge parallel to it. In the reconstructed image, a coherence factor (CF) weighting [26] is seen to suppress the incoherent noise in the received signal from affecting the image reconstruction as seen in figure 9(a) and 9(b). The experiment result is also compared with simulation result as in figure 9(c) and a one to one correspondence can be seen between the experiment and the simulation.
Fig 9.
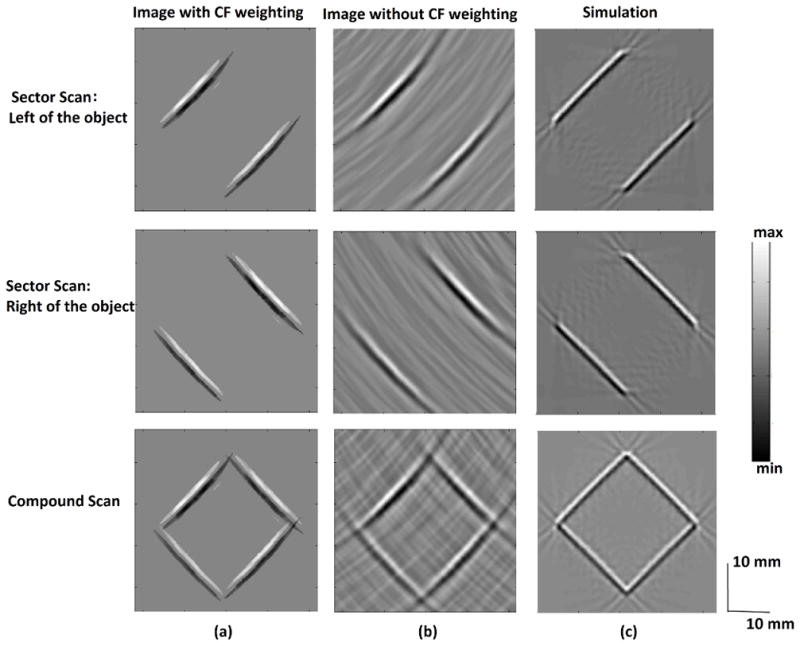
(a)-(c) Each row from top to bottom corresponds to image reconstructed by using experimental sector scan data on the right, left of a square gel object and all the sector scans, respectively. (a) Reconstructed images with CF weighting (b) Reconstruction without CF weighting (c) Simulation
The second phantom imaged is of two 1 cm blocks of 10 % salinity embedded in a 0% gel. The conductivity boundaries alone are reconstructed in the MAT-MI image. Thus the boundaries between the two saline gels and the outer gel are seen in the reconstruction. Because the outer gel with 0 % salinity and water has very close conductivities and therefore this boundary is not present in the MAT-MI image.
V. Discussion
We have applied to MAT-MI a commonly used ultrasound reconstruction method, i.e. B-scan imaging. This allows using the mature scanning techniques in ultrasonography to reconstruct MAT-MI acoustic sources. The reconstructed images in computer simulation and experiments show a good agreement with the corresponding target source profiles.
In the current simulation study we have used the Field II software to simulate ultrasound transducers used with MAT-MI. Compared to the previous MAT-MI simulations [14], [18], [19] where an ideal ultrasound receiver is assumed, the current simulation takes into account the finite bandwidth and shape of the transducer used for imaging. These simulations, taking the transducer parameters into account, validate our experimental observations with MAT-MI where the acoustic sources at the boundaries of conductivity change alone get reconstructed. We have assumed uniform magnetic fields in the current simulations and this can be achieved when the coils used for generating the magnetic fields are sufficiently larger than the object dimensions. In addition, since the current study is focused on imaging the acoustic source distribution, a uniform magnetic field assumption works well for both our computer simulation and experiments. On the other hand, the variations in the uniformity of the fields as seen in our experiment system can be accounted for in estimating conductivity distribution from the reconstructed acoustic source images as demonstrated in [20] where exact magnetic coil configurations have been used.
The B scan technique uses the focus region of a transducers gain map for imaging and this for a given transducer allows imaging of an object from a much closer distance and promises an improved sensitivity. The point receiver based method, however, requires the transducer to be placed at a relatively large distance away from the source and thus gives lower sensitivity. The B scan technique thus optimizes the ultrasound receiver for the MAT MI system. The experimental implementation of the method requires the transducer to be placed at a closer distance to the object. This also leads to a higher electromagnetic interference (EMI) from the magnetic stimulator and this requires a careful design of the stimulator to have very low ringing on turn off for the EMI to subside at the time ultrasound signal arrives at the transducer. The stimulator design implemented in the current system has very low oscillations on turn off but it is weaker in strength than the ones used in previous MAT MI experiments and this gives an overall lower system SNR. Therefore to fully realize the potential of B scan imaging for MAT MI a stronger stimulator with very low oscillations on turn off is required.
In the present system, sector scan is achieved by mechanically rotating a focus transducer. In a practical setting, this could also be done by beam forming and beam steering using a transducer array with better efficiency and accuracy. In addition the discrete number of scanning locations needed by the compound scan scheme for reconstruction allows using MAT-MI when a limited number of acoustic windows are available. Thus a method like this promises to broaden the applicability of MAT-MI for human imaging.
Fig 10.
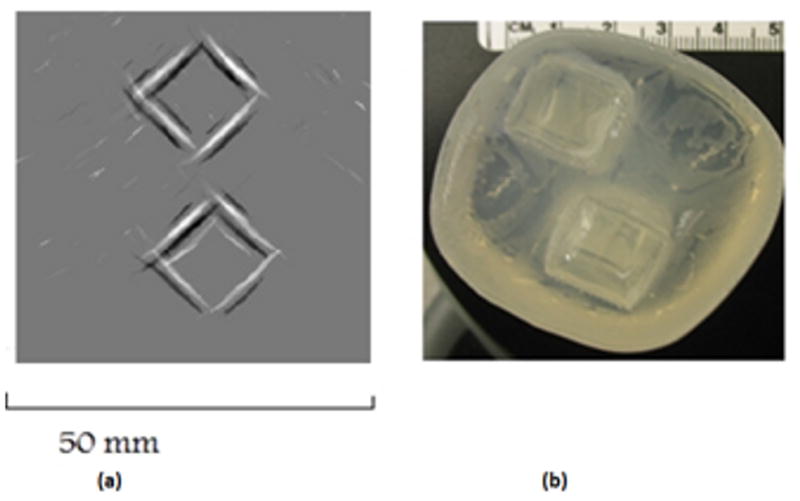
(a) MAT-MI image of two 10% salinity square gel blocks embedded in a 0% salinity gel (b) Top view photo of the phantom
Acknowledgments
This work was supported in part by NIH R21EB006070, NSF BES-0602957, NIH RO1EB007920, RO1EB006433, and RO1HL080093.
The authors would like to thank Dr. Emad Ebbini for help with ultrasound instrumentation and Dr. Gang Hu for his assistance with experiment setup.
Biographies
 Leo Mariappan(S’10) was born in India. He received his Bachelor’s degree in Electrical Engineering from Indian Institute of Technology, Madras, India in 2007. He is now a graduate student in the department of Biomedical Engineering at University of Minnesota, Minneapolis, MN, USA. His research interest is in Magnetoacoustic tomography with magnetic induction and bioimpedance imaging.
 Xu Li (S’07) was born in China. He received his Bachelor’s and Master’s degree in biomedical engineering from Zhejiang University, Hangzhou, China, in 2001 and 2004, respectively. He received his Ph.D. degree in biomedical engineering from University of Minnesota, Minneapolis, in 2010. He is currently a postdoctoral research fellow in the department of radiology at Johns Hopkins University. His research interest includes magnetoacoustic tomography with magnetic induction, bioimpedance imaging, magnetic susceptibility imaging and related imaging methodology.
 Bin He (S’87–M’88–SM’97–F’04) is a Distinguished McKnight University Professor and Professor of Biomedical Engineering, Electrical Engineering and Neuroscience at the University of Minnesota at Twin Cities, where he serves as the Director of Center for Neuroengineering. Dr. He’s major research interests include neuroengineering, functional biomedical imaging, and bioelectromagnetism. He is the Editor of the book entitled “Neural Engineering”, and serves as an associate editor of multiple international journals including IEEE Transactions on Biomedical Engineering, IEEE Transactions on Neural Systems and Rehabilitation Engineering, and Brain Topography. He is also a member of Editorial Board of IEEE Spectrum, Journal of Neural Engineering, and Clinical Neurophysiology, among others. Dr. He was the recipient of NSF CAREER Award, American Heart Association Established Investigator Award, and is a Fellow of IEEE, American Institute of Medical and Biological Engineering, Institute of Physics, and International Society for Functional Source Imaging.
Contributor Information
Leo Mariappan, Department of Biomedical Engineering, University of Minnesota, Minneapolis, MN 55455 USA.
Xu Li, Department of Biomedical Engineering, University of Minnesota, Minneapolis, MN 55455 USA.
Bin He, Department of Biomedical Engineering, University of Minnesota, Minneapolis, MN 55455 USA.
References
- 1.Metherall P, Barber DC, Smallwood RH, et al. Three-dimensional electrical impedance tomography. Nature. 1996 Apr 11;380(6574):509–12. doi: 10.1038/380509a0. [DOI] [PubMed] [Google Scholar]
- 2.Gao N, Zhu SA, He B. Estimation of electrical conductivity distribution within the human head from magnetic flux density measurement. Phys Med Biol. 2005 Jun 7;50(11):2675–87. doi: 10.1088/0031-9155/50/11/016. [DOI] [PubMed] [Google Scholar]
- 3.Kwon O, Woo EJ, Yoon JR, et al. Magnetic resonance electrical impedance tomography (MREIT): simulation study of J-substitution algorithm. IEEE Trans Biomed Eng. 2002 Feb;49(2):160–7. doi: 10.1109/10.979355. [DOI] [PubMed] [Google Scholar]
- 4.Hasanov KF, Ma AW, Nachman AI, et al. Current density impedance imaging. IEEE Trans Med Imaging. 2008 Sep;27(9):1301–9. doi: 10.1109/TMI.2008.922691. [DOI] [PubMed] [Google Scholar]
- 5.Griffiths H. Magnetic induction tomography. Measurement Science and Technology. 2001;12(8):1126. [Google Scholar]
- 6.Peyton AJ, et al. An overview of electromagnetic inductance tomography: description of three different systems. Measurement Science and Technology. 1996;7(3):261. [Google Scholar]
- 7.Roth BJ, Basser PJ, Wikswo JP., Jr A theoretical model for magneto-acoustic imaging of bioelectric currents. IEEE Trans Biomed Eng. 1994 Aug;41(8):723–8. doi: 10.1109/10.310087. [DOI] [PubMed] [Google Scholar]
- 8.Towe BC, Islam MR. A magneto-acoustic method for the noninvasive measurement of bioelectric currents. IEEE Trans Biomed Eng. 1988 Oct;35(10):892–4. doi: 10.1109/10.7300. [DOI] [PubMed] [Google Scholar]
- 9.Montalibet A, Jossinet J, Matias A, Cathignol D. Electric current generated by ultrasonically induced Lorentz force in biological media. Med Biol Eng Comput. 2001 Jan;39(1):15–20. doi: 10.1007/BF02345261. [DOI] [PubMed] [Google Scholar]
- 10.Wen H, Shah J, Balaban RS. Hall effect imaging. IEEE Trans Biomed Eng. 1998 Jan;45(1):119–24. doi: 10.1109/10.650364. [DOI] [PMC free article] [PubMed] [Google Scholar]
- 11.Xu Y, He B. Magnetoacoustic tomography with magnetic induction (MAT-MI) Phys Med Biol. 2005 Nov 7;50(21):5175–87. doi: 10.1088/0031-9155/50/21/015. [DOI] [PMC free article] [PubMed] [Google Scholar]
- 12.He B. High-resolution Functional Source and Impedance Imaging. Conf Proc IEEE Eng Med Biol Soc. 2005;4:4178–82. doi: 10.1109/IEMBS.2005.1615385. [DOI] [PubMed] [Google Scholar]
- 13.Li X, Xu Y, He B. A Phantom Study of Magnetoacoustic Tomography with Magnetic Induction (MAT-MI) for Imaging Electrical Impedance of Biological Tissue. J Appl Phys. 2006 Mar 29;99:nihms15323. doi: 10.1063/1.2186371. [DOI] [PMC free article] [PubMed] [Google Scholar]
- 14.Li X, Xu Y, He B. Imaging electrical impedance from acoustic measurements by means of magnetoacoustic tomography with magnetic induction (MAT-MI) IEEE Trans Biomed Eng. 2007 Feb;54(2):323–30. doi: 10.1109/TBME.2006.883827. [DOI] [PubMed] [Google Scholar]
- 15.Xia R, Li X, He B. Magnetoacoustic tomographic imaging of electrical impedance with magnetic induction. Appl Phys Lett. 2007 Aug 22;91(8):83903. doi: 10.1063/1.2772763. [DOI] [PMC free article] [PubMed] [Google Scholar]
- 16.Brinker K, Roth BJ. The effect of electrical anisotropy during magnetoacoustic tomography with magnetic induction. IEEE Trans Biomed Eng. 2008 May;55(5):1637–9. doi: 10.1109/TBME.2007.914001. [DOI] [PubMed] [Google Scholar]
- 17.Xia R, Li X, He B. Reconstruction of vectorial acoustic sources in time-domain tomography. IEEE Trans Med Imaging. 2009 May;28(5):669–75. doi: 10.1109/TMI.2008.2008972. [DOI] [PMC free article] [PubMed] [Google Scholar]
- 18.Li X, Zhu S, He B. Solving the forward problem of magnetoacoustic tomography with magnetic induction by means of the finite element method. Phys Med Biol. 2009 May 7;54(9):2667–82. doi: 10.1088/0031-9155/54/9/005. [DOI] [PMC free article] [PubMed] [Google Scholar]
- 19.Xia R, Li X, He B. Comparison study of three different image reconstruction algorithms for MAT-MI. IEEE Trans Biomed Eng. Mar;57(3):708–13. doi: 10.1109/TBME.2009.2034637. [DOI] [PMC free article] [PubMed] [Google Scholar]
- 20.Li X, He B. Multi-excitation magnetoacoustic tomography with magnetic induction for bioimpedance imaging. IEEE Trans Med Imaging. 2010 Oct;29(10):1759–67. doi: 10.1109/TMI.2010.2052063. [DOI] [PMC free article] [PubMed] [Google Scholar]
- 21.Li C, Wang LV. High-numerical-aperture-based virtual point detectors for photoacoustic tomography. Appl Phys Lett. 2008;93(3):33902. doi: 10.1063/1.2963365. [DOI] [PMC free article] [PubMed] [Google Scholar]
- 22.Li C, Ku G, Wang LV. Negative lens concept for photoacoustic tomography. Phys Rev E Stat Nonlin Soft Matter Phys. 2008 Aug;78(2 Pt 1):021901. doi: 10.1103/PhysRevE.78.021901. [DOI] [PMC free article] [PubMed] [Google Scholar]
- 23.Xu M, Ku G, Wang LV. Microwave-induced thermoacoustic tomography using multi-sector scanning. Med Phys. 2001 Sep;28(9):1958–63. doi: 10.1118/1.1395037. [DOI] [PubMed] [Google Scholar]
- 24.Xu Y, Wang LV, Ambartsoumian G, et al. Reconstructions in limited-view thermoacoustic tomography. Med Phys. 2004 Apr;31(4):724–33. doi: 10.1118/1.1644531. [DOI] [PubMed] [Google Scholar]
- 25.Jensen JA, Svendsen NB. Calculation of pressure fields from arbitrarily shaped, apodized, and excited ultrasound transducers. IEEE Trans Ultrason Ferroelectr Freq Control. 1992 Mar;39(2):262–267. doi: 10.1109/58.139123. [DOI] [PubMed] [Google Scholar]
- 26.Liao CK, Li ML, Li PC. Optoacoustic imaging with synthetic aperture focusing and coherence weighting. Opt Lett. 2004 Nov 1;29(21):2506–8. doi: 10.1364/ol.29.002506. [DOI] [PubMed] [Google Scholar]
- 27.Wan Y, Ebbini ES. A post-beamforming 2-D pseudoinverse filter for coarsely sampled ultrasound arrays. IEEE Trans Ultrason Ferroelectr Freq Control. 2009 Sep;56(9):1888–902. doi: 10.1109/TUFFC.2009.1265. [DOI] [PMC free article] [PubMed] [Google Scholar]


