

Abstract
The relative roles that ageing and lifelong cytomegalovirus (CMV) infection have in shaping naive and memory CD4+ T-cell repertoires in healthy older people is unclear. Using multiple linear regression analysis we found that age itself is a stronger predictor than CMV seropositivity for the decrease in CD45RA+ CD27+ CD4+ T cells over time. In contrast, the increase in CD45RA− CD27− and CD45RA+ CD27− CD4+ T cells is almost exclusively the result of CMV seropositivity, with age alone having no significant effect. Furthermore, the majority of the CD45RA− CD27− and CD45RA+ CD27− CD4+ T cells in CMV-seropositive donors are specific for this virus. CD45RA+ CD27− CD4+ T cells have significantly reduced CD28, interleukin-7 receptor α (IL-7Rα) and Bcl-2 expression, Akt (ser473) phosphorylation and reduced ability to survive after T-cell receptor activation compared with the other T-cell subsets in the same donors. Despite this, the CD45RA+ CD27− subset is as multifunctional as the CD45RA− CD27+ and CD45RA− CD27− CD4+ T-cell subsets, indicating that they are not an exhausted population. In addition, CD45RA+ CD27− CD4+ T cells have cytotoxic potential as they express high levels of granzyme B and perforin. CD4+ memory T cells re-expressing CD45RA can be generated from the CD45RA− CD27+ population by the addition of IL-7 and during this process these cells down-regulated expression of IL-7R and Bcl-2 and so resemble their counterparts in vivo. Finally we showed that the proportion of CD45RA+ CD27− CD4+ T cells of multiple specificities was significantly higher in the bone marrow than the blood of the same individuals, suggesting that this may be a site where these cells are generated.
Keywords: ageing, CD4 T cells, CD45RA, CMV, IL-7
Introduction
The function of the immune system declines with age leading to increased susceptibility to infectious diseases and poor responses to vaccination.1 With the demographic shift towards an older age in many countries it is of increasing importance to understand the nature of the dysfunctional immunity in older subjects.2 This information will provide information on possible strategies for intervention to boost immunity during ageing.
The immune dysfunction in older humans is partly the result of thymic involution, which restricts the production of naive T cells in older individuals, compromising their ability to respond to new antigens.3 In addition, memory T cells, especially those that are specific for antigens that are encountered frequently, are driven to differentiate continuously towards an end-stage, marked by poor survival, telomere erosion, replicative senescence3 and functional exhaustion.4 This may result in ‘holes’ in the T-cell repertoire as T cells that are specific for certain antigens are lost, which in turn may make older humans susceptible to certain infectious agents.2 However, instead of the potential loss of specific T cells through replicative senescence, immune dysfunction during ageing may also arise from accumulation of certain T-cell populations. Longitudinal studies have defined a cluster of immune parameters in healthy older individuals, which are predictive of significantly decreased 2-year and 4-year survival of subjects over 80 years of age (reviewed in Derhovanessian et al.5). These parameters include a CD4 : CD8 ratio of < 1, which is the result of clonal expansion of highly differentiated CD8+ CD28− T cells, cytomegalovirus (CMV) seropositivity and elevated levels of pro-inflammatory cytokines in the serum.5 Furthermore, a large proportion of the expanded CD8+ T cells in older subjects may be CMV-specific.6–8 Therefore, although CMV infection is harmless to healthy young individuals, infection with this virus may have a previously unappreciated role in immune dysfunction during ageing, which is associated with the accumulation of CMV-specific T cells. This suggests that CMV infection may induce the accumulation of CD8+ effector T cells that hinder the function of other memory T-cell populations.8 This possibility is indirectly supported by data in mice indicating that expanded T-cell clones reduce T-cell diversity and inhibit the function of non-clonal cells in vivo9 and that there is a negative effect of CMV infection on the size and function of Epstein–Barr virus-specific T-cell populations in humans.10
There have been many studies on the CMV-specific CD8+ T-cell population,6,11–13 but less is known about the characteristics of CMV-specific CD4+ T cells and the impact that CMV infection has in shaping the CD4+ T-cell pool in infected healthy humans.14–16 Progressive stages in T-cell differentiation can be identified by sequential changes of expression of surface receptors such as CD45RA, CD28, CD27 and CCR7.8,17 The most differentiated T cells in both the CD8+ and CD4+ populations are CD28− CD27− CCR7−.17 It has been shown that CMV-specific CD8+ T cells are more differentiated phenotypically than those that are specific for other persistent viruses.6 A proportion of these highly differentiated T cells can re-express CD45RA, a marker that was considered to identify unprimed T cells.18–20 The CD8+ CD45RA+ CD27− T-cell population is expanded in CMV-infected individuals and although some reports suggest that these cells are terminally differentiated,21–23 other studies indicate that these cells can be re-activated to exhibit potent functional responses.24,25 Some studies have shown that CD45RA+ CD27− CD4+ T cells increase during ageing and in some autoimmune diseases,26,27 but it is currently not clear whether CMV infection has an impact on their generation and whether these cells are functionally competent.
In this study we show that CMV infection significantly increases the proportion of CD45RA− CD27− and CD45RA+ CD27− effector memory-like CD4+ T cells in older humans. Furthermore, CD45RA+ CD27− CD4+ T cells were found to be multifunctional but potentially short lived after activation and may arise through interleukin-7 (IL-7) -mediated homeostatic proliferation, possibly in the bone marrow. These results suggest the possible involvement of homeostatic cytokines in the CMV infection-induced expansion of CD45RA+ CD27− CD4+ T cells during ageing.
Materials and methods
Volunteer sample collection and isolation
Heparinized peripheral blood was collected from young (mean age, 29 years; range, 20–39 years; n =67), middle-aged (mean age, 51 years; range, 40–65 years; n=18) and old (mean age, 80 years; range, 71–91 years; n=40) donors, with approval from the Ethics Committee of the Royal Free Hospital. The old volunteers in this study were not treated with any immunosuppressive drugs and retained physical mobility and social independence. All donors provided written informed consent. Paired blood and bone marrow samples (mean age, 34 years; range, 21–57 years; n = 18) were obtained from healthy bone marrow donors by the Department of Haematology, University College Hospital London. Peripheral blood mononuclear cells (PBMCs) were isolated by Ficoll–Hypaque density gradient (Amersham Pharmacia Biotech, Uppsala, Sweden).
Cell culture
The CD4+ T cells were purified by positive selection using the VARIOMACS system (Miltenyi Biotec, Bergisch Gladbach, Germany) according to the manufacturer's instructions. In some experiments, CD4+ T cells were further sorted into CD45RA/CD27 subsets using a FACSAria flow cytometer (BD Biosciences, San Jose, CA) after staining with CD45RA and CD27 antibodies for 30 min at 4° in PBS containing 1% BSA (Sigma-Aldrich, Gillingham, UK). Cells were cultured in RPMI-1640 supplemented with 10% heat-inactivated fetal calf serum, 100 U/ml penicillin, 100 mg/ml streptomycin, 50 μg/ml gentamicin and 2 mm l-glutamine (all from Invitrogen, Eugene, OR) at 37° in a humidified 5% CO2 incubator. Purified CD4+ subsets were activated in the presence of anti-CD3 antibody (purified OKT3 0·5 μg/ml) and autologous PBMCs irradiated with 40 Gy gamma-radiation, as a source of multiple co-stimulatory ligands provided by B cells, dendritic cells and macrophages found in these populations.28 In other experiments, cells were cultured in the presence of recombinant human (rh) IL-2 (5 ng/ml), IL-7 (10 ng/ml) or IL-15 (5 ng/ml) (all from R&D Systems, Minneapolis, MN). Cytokines were added at the beginning of the cell culture and not replenished. These cells were harvested at different times for phenotypic and functional analyses.
Measurement of antigen-specific CD4+ T cells
The PBMCs were stimulated with 10 μg/ml of purified protein derivative (PPD; Statens Serum Institut, Copenhagen, Denmark), 1/50 dilution of varicella zoster virus (VZV) -infected cell lysate, 1/200 dilution of Epstein–Barr virus (EBV) -infected cell lysate or 1/50 dilution of herpes simplex virus (HSV) -infected cell lysate (all from Virusys, Taneytown, MD). A CMV-infected cell lysate (used at 1/10 dilution) was prepared by infecting human embryonic lung fibroblasts with the Towne strain of CMV (European Collection of Animal Cell Cultures) at a multiplicity of infection of 2. After 5 days, the infected cells were lysed by repeated freeze–thaw cycles. The PBMCs were left unstimulated or stimulated with antigenic lysates for 15 hr at 37° in a humidified CO2 atmosphere, with 5 μg/ml brefeldin A (Sigma-Aldrich) added after 2 hr. The cells were surface stained with peridinin chlorophyll protein-conjugated (-PerCP) CD4, phycoerythrin-conjugated (-PE) CD27 and phycoerythrin-Cy7-conjugated CD45RA (BD Biosciences) on ice. After being fixed and permeabilized (Fix & Perm Cell Permeabilization kit; Caltag Laboratories, Buckingham, UK), cells were stained with allophycocyanin-conjugated (-APC) interferon-γ (IFN-γ). Samples were acquired on an LSR I flow cytometer (BD Biosciences). For bone marrow experiments, paired peripheral blood and bone marrow samples were stimulated and analysed in parallel.
Flow cytometric analysis of cell phenotype
Cells resuspended in PBS containing 1% BSA and 0·1% sodium azide (Sigma-Aldrich) were stained for 10 min at room temperature with the following anti-human monoclonal antibodies: CD45RA-FITC (clone HI100; BD Pharmingen, San Diego, CA) or CD45RA-APC (clone MEM-56; Caltag); CD45RO-PE (clone UCHL1); CD4-PerCP (clone SK3); CD27-PE (clone M-T271); CD28-FITC (clone CD28·2); CD127-PE (clone hIL-7R-M21); CCR7-PE-Cy7 (clone 3D12) (all from BD Pharmingen); CD57-PE (clone TB03, Miltenyi Biotec). Intracellular staining for Granzyme B-PE (clone GB11; eBioscience, San Diego, CA), perforin-FITC (clone δG9; BD Pharmingen), Bcl-2-FITC (clone 124; Dako, Glostrup, Denmark) and Ki67-FITC (clone B56; BD Biosciences) was performed using the Foxp3 Staining Buffer Set (Miltenyi Biotec) according to the manufacturer's instructions. Proliferation was assessed by carboxyfluorescein diacetate succinimidyl ester (CFSE) dilution assay. Cells were labelled with 0·5 μm CFSE (Molecular Probes-Invitrogen, Carlsbad, CA) at 37° for 15 min in the dark, quenched with ice-cold culture medium at 4° for 5 min, and washed three times before culture in the presence of 50 ng/ml IL-7. Apoptosis was assessed using an annexin V/propidium iodide (PI) detection kit (BD Biosciences). Samples were acquired on a BD FACSCalibur 2 flow cytometer (BD Biosciences) after fixation with 1% formaldehyde (Sigma-Aldrich). Data were analysed using FlowJo software (TreeStar, Ashland, OR).
Intracellular cytokine analysis using polychromatic flow cytometry
The PBMCs (2 × 10⁶ cells/ml) were stimulated with anti-CD3 (purified OKT3 0·5 μg/ml) for 2 hr at 37°. Unstimulated samples were incubated with equivalent amounts of PBS (negative control). After the addition of brefeldin A (10 μg/ml; Sigma), samples were incubated for another 14 hr. Cells were then incubated with 2 mm EDTA at room temperature for 10 min, washed in PBS/BSA/Azide and stained for 30 min at 4° with the following surface antibodies: CD4-PerCP (clone SK3), CD8-APC-H7 (clone SK1), CD27-PE (clone L128), CD16-FITC (clone 3G8), CD56-FITC (clone NCAM16.2) (all from BD Biosciences), CD45RA Energy Coupled Dye (ECD, clone MB1; IqProducts, Groningen, The Netherlands), CD3 Quantum Dot 605 (QDot605, clone UCHT1; Invitrogen), live/dead fixable Aqua stain (Invitrogen). After washing, lysing and permeabilizing according to the manufacturer's instructions (Perm 2 and Lysis; BD Biosciences), cells were stained intracellularly for 30 min at 4° with the following antibodies: IL-2-APC (clone 5344.111), IFN-γ-PE-Cy7 (clone B27), tumour necrosis factor-α (TNF-α) -Alexa Fluor 700 (clone MAb1) (all from BD Biosciences), CD40L Pacific Blue (clone 24-31; Biolegend, San Diego, CA). Samples were acquired on a BD LSR II flow cytometer (BD Biosciences). Data were analysed using FlowJo software (TreeStar) and Pestle and Spice (kindly donated by M. Roederer).
Akt (Ser473) phosphorylation analysis by flow cytometry
After resting the PBMCs overnight in RPMI-1640 (Sigma-Aldrich) with 1% human AB serum (Sigma-Aldrich), they were starved in serum-free RPMI-1640 for 2 hr before stimulation to reduce phosphorylation background. Following surface staining with CD45RA-FITC, CD27-APC (clone O323; eBioscience) and CD4-PE-Cy7 (clone SK3; BD Pharmingen) cells were activated with anti-CD3 (purified OKT3, 1 μg/ml) on ice for 20 min. Primary monoclonal antibodies were cross-linked with anti-mouse IgG F(ab′)2 (20 μg/ml; Jackson ImmunoResearch, West Grove, PA) by incubating on ice for 20 min. Cells were then stimulated at 37° for 5 min. The unstimulated control cells underwent the same manipulations but without the addition of αCD3 and cross-linker. Activation was arrested by fixing the cells with warm Cytofix Buffer (BD Biosciences) at 37° for 10 min. Cells were then permeabilized with ice-cold Perm Buffer III (BD Biosciences) at 4° for 30 min and incubated with PE mouse anti-Akt (pS473) (BD Biosciences) for 30 min at room temperature. Cells were washed in stain buffer (BD Pharmingen) and acquired on a BD FACS Calibur 2 flow-cytometer (BD Biosciences) and analysed using FlowJo software (TreeStar).
Statistical analysis
Statistical analysis was performed using GraphPad Prism version 4.00 (GraphPad Software, San Diego, CA) and P < 0·05 was considered significant. Multiple linear regression was performed using PaswStatistics 18.0 (IBM-SPSS, Chicago, IL).
Results
Persistent CMV infection, but not age itself, correlates with the increase of CD45RA− CD27− and CD45RA+ CD27− CD4+ T cells
Age and CMV infection have been shown to profoundly affect the overall composition of the CD8+ T-cell compartment.12 We found that the frequency of CD45RA+ CD27+ (naive) CD4+ T cells significantly decreased with age (Fig. 1a,b; P = 0·0003) whereas the frequencies of all the primed/memory subsets significantly increased with age: CD45RA− CD27+ (P = 0·0033), CD45RA− CD27− (P = 0·0321), CD45RA+ CD27− (P = 0·0315). However, this analysis does not take into account the individual contribution of ageing and CMV infection in shaping the CD4+ T-cell compartment. An earlier study showed that CMV infection is associated with the accumulation of highly differentiated CD4+ T cells.16 Here we extend these observations by further discriminating between highly differentiated CD4+ T cells in the basis of CD45RA re-expression. We analysed the results in two ways. First, we divided the subjects into young (< 40 years) and old (> 60 years) groups and further subdivided these individuals on the basis of their CMV seropositive or negative status (Fig. 1c). Second, we performed multiple linear regression analysis to examine more closely the impact of aging and CMV in determining the T-cell subset composition during ageing.
Figure 1.

The inflation of CD45RA− CD27− and CD45RA+ CD27− CD4+ T-cell subsets is the result of cytomegalovirus (CMV) exposure and not of age itself. (a) Phenotypic analysis of CD45RA/CD27 expression on young, middle-aged and old CD4+ T cells. Peripheral blood mononuclear cells stained for CD4, CD45RA and CD27 were analysed by flow cytometry. Representative pseudocolour plots for each age-group are shown. (b) Frequencies of each of the CD45RA/CD27 populations within total CD4+ T cells are represented in correlation to the age of the donors. Line of best fit was generated by linear regression and the correlation assessed by Pearson and Spearman rank (GraphPad Prism): CD45RA+ CD27+ (r = −0·3154, P = 0·0003), CD45RA− CD27+ (r = 0·2620, P = 0·0033), CD45RA− CD27− (r = 0·1918, P = 0·0321), CD45RA+ CD27− (r = 0·1924, P = 0·0315). (c) Frequencies of each of the CD45RA/CD27 populations within total CD4+ T cells are represented by grouping via age (young, < 40 years; old, > 60 years) and CMV status. Horizontal lines depict median values. Statistical analysis was performed using the Mann–Whitney U-test (GraphPad Prism). * indicates P value ≤ 0·05; ** indicates P value ≤ 0·001; *** indicates P value ≤ 0·0001.
The percentage of CD45RA+ CD27+ (naive) CD4+ T cells decreased with age; this decrease was significant in CMV-positive (P = 0·003) but not in CMV-negative donors as assessed by the Mann–Whitney U-test. However, when we analysed the data using multiple linear regression analysis (see Supplementary Information, Table S1) we found that age and CMV both induce a significant decrease of the CD45RA+ CD27+ CD4+ T-cell compartment (P < 0·001 and P < 0·045, respectively) but age alone seems to be the main factor modulating the increased CD45RA− CD27+ subset.
The frequencies of CD45RA− CD27− and CD45RA+ CD27− subsets were significantly higher in CMV-infected donors in both young and old age groups (Fig. 1c). Furthermore, old CMV-positive donors had significantly higher proportions of these cells compared with young seropositive subjects as assessed by the Mann–Whitney U-test (Fig. 1c, lower panels). When the results were analysed by multiple linear regression analysis there was a highly significant impact of CMV infection on the increase of both these populations during ageing (P < 0·0001 in both cases) but age itself did not have a significant role in the accumulation of these subsets (see Supplementary Information, Table S1). In conclusion, age and CMV serostatus both contribute to the decrease in CD45RA+ CD27+ CD4+ T cells during ageing but the increase in CD45RA− CD27− and CD45RA+ CD27− T cells in old individuals is primarily the result of CMV infection.
Identification of virus-specific CD4+ T-cell populations in healthy donors of different ages
We next investigated whether the increase in CD45RA− CD27− and CD45RA+ CD27− CD4+ cells in CMV-seropositive donors only occurred within CMV-specific CD4+ T cells or also in those that are specific for different persistent viruses. To do this, we first identified virus-specific populations by intracellular IFN-γ staining after stimulation with lysates of virus-infected cells for 18 hr (see Supplementary Information, Fig. S1a).15 Background responses detected in unstimulated cells (negative control) were subtracted from those detected in stimulated samples. Only responses > 0·02% above background were considered positive. The IFN-γ secretion after stimulation with viral lysates was specific because no cytokine production was observed when CMV lysate was used to stimulate CD4+ T cells from CMV-seronegative donors as described previously.15 We found that in CMV-seropositive donors, there was a significantly higher proportion of CMV-specific CD4+ T cells compared with T cells that were specific for other persistent viruses such as VZV, HSV EBV or mycobacterial antigens (tuberculin PPD) (see Supplementary Information, Fig. S1b).
We next investigated whether the increased proportion of CD45RA− CD27− and CD45RA+ CD27− CD4+ T cells in CMV-seropositive donors (Fig. 1c) was only the result of changes within the CMV-specific T-cell population. We found that there were significantly more CD45RA− CD27− and CD45RA+ CD27− CD4+ T cells in CMV-seropositive donors compared with CMV-seronegative donors (Fig. 2a,b). However, although the majority of CD45RA− CD27− and CD45RA+ CD27− CD4+ T cells in CMV-seropositive donors were CMV-specific, there was also a higher proportion of CD45RA− CD27− and CD45RA+ CD27− CD4+ T cells specific for the other viruses in CMV-seropositive subjects (Fig. 2b,c). Similar results were observed in both young and old donors (data not shown). This result reinforces the idea that CMV infection influences directly the composition of the CD4+ T-cell pools. Furthermore, our results indicate that CMV infection may have a global effect on driving the differentiation of other antigen-specific CD4+ T cells. This confirms our previous observations where the relative expression of CD28 and CD27 instead of CD45RA and CD27 was used to identify CD4+ T cells at different stages of differentiation.15
Figure 2.
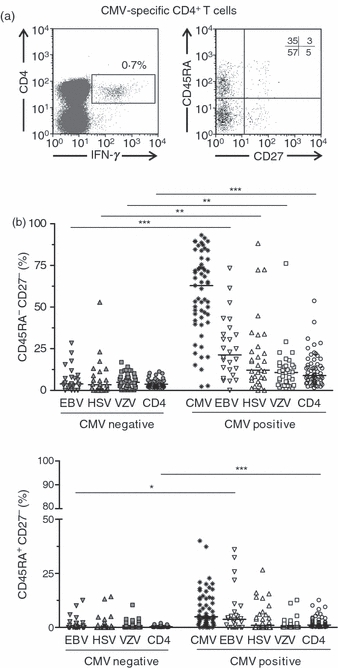
Frequency of CD45RA− CD27− and CD45RA+ CD27− CD4+ subsets within virus-specific cells in cytomegalovirus seronegative (CMV−) and CMV+ individuals. Peripheral blood mononuclear cells were stimulated with CMV, Epstein–Barr virus (EBV), herpes simplex virus (HSV) or varicella zoster virus (VZV) lysates and the phenotype of the antigen-specific CD4+ T cells was assessed by flow cytometry after staining with CD4, CD45RA, CD27 and interferon-γ (IFN-γ) antibodies. Only responses > 0·02% above background (unstimulated cells) were considered positive. The CD45RA/CD27 profile of CMV-specific CD4+ T cells (CD4+ IFN-γ+) from a representative donor is shown (a). (b) The percentage of antigen-specific CD4+ T cells with a CD45RA− CD27− or CD45RA+ CD27− phenotype was assessed in CMV+ and CMV− individuals. Horizontal lines depict median values. Statistical analysis was performed using the Mann–Whitney U-test (GraphPad Prism).
Highly differentiated CD45RA− CD27− and CD45RA+ CD27− CD4+ T-cell subsets are multifunctional
Several reports on CD8+ T cells suggest that the CD45RA+ CD27− subset is terminally differentiated17,22 with limited capacity for self-renewal. To date, few data are available on CD4+ CD45RA+ CD27− T cells in healthy donors. To determine the functional characteristics of the increased CD45RA− CD27− and CD45RA+ CD27− CD4+ T-cell populations in CMV-seropositive subjects we first examined their surface expression of markers that were previously shown to be associated with migration (CCR7), co-stimulation (CD28), responsiveness to cytokines (IL7-Rα) and end-stage differentiation (CD57). We found that CD45RA− CD27− and CD45RA+ CD27− CD4+ T cells both showed low CCR7, CD28 and IL-7Rα but higher CD57 expression compared with naive CD45RA+ CD27+ and CD45RA− CD27+ populations indicating that they were more differentiated (Fig. 3a). In addition, on the basis of CD28, IL-7Rα and CD57 expression, the CD45RA+ CD27− subset was significantly more differentiated than the CD45RA− CD27− population (Fig. 3a).
Figure 3.
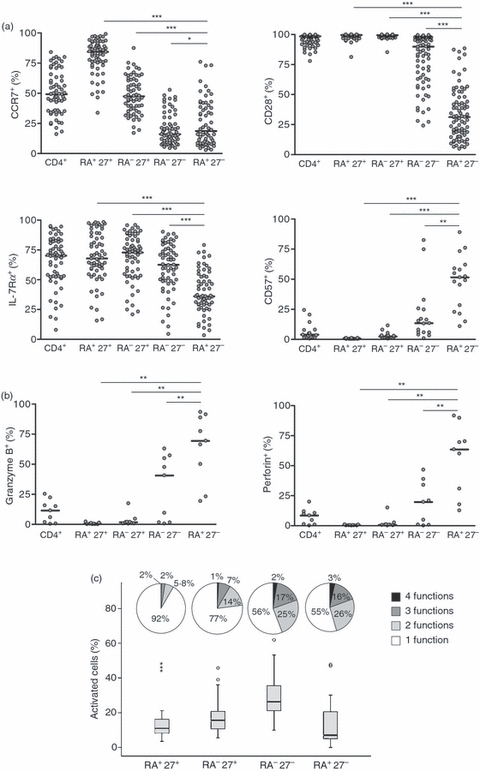
CD45RA− CD27− and CD45RA+ CD27− CD4+ T cells have a terminally differentiated phenotype but are multifunctional. Peripheral blood mononuclear cells (PBMCs) were stained ex vivo and analysed by flow cytometry. The percentage of cells expressing phenotypic (a) and functional (b) markers was determined by gating within total CD4+ cells and within each of the CD45RA/CD27 subsets. Horizontal lines depict median values. Statistical analysis was performed using the Wilcoxon matched pairs test (GraphPad Prism). CD40 ligand (CD40L), interferon-γ (IFN-γ), interleukin-2 (IL-2) and tumour necrosis factor-α (TNF-α) expression by CD4+ CD45RA/CD27 subsets was assessed using multiparametric flow cytometry following stimulation of PBMCs with anti-CD3 in the presence of brefeldin A for 16 hr (c). Frequency of all reacting cells within each CD45RA/CD27 subset is represented by box-plots (n = 25). Reacting cells include those that express 1, 2, 3 or 4 of the analysed activation markers. Shown are median, interquartile range (IQR) (difference between the 75th and 25th percentiles), outlier and extreme values. The pie charts show the distribution of cells showing 1, 2, 3 or 4 functions within each subset.
We next investigated the functional properties of the CD45RA− CD27− and CD45RA+ CD27− subsets of CD4+ T cells. We showed that the expression of molecules associated with cytolytic potential such as granzyme B and perforin were not detectable in naïve CD45RA+ CD27+ and CD45RA− CD27+ CD4+ T cells (Fig. 3b). In contrast, both CD45RA− CD27− and CD45RA+ CD27− CD4+ T cells expressed granzyme B and perforin, the levels of which were significantly higher in CD45RA+ CD27− cells when these populations were compared (Fig. 3b). Other indicators of CD4+ T-cell functionality include production of cytokines such as IFN-γ, IL-2 and TNF-α, and the expression of the CD40 ligand. The co-expression of more than one function in individual cells may be associated with enhanced viral control.29 We therefore performed multiparameter flow cytometric analysis to identify simultaneously the relative expression of IFN-γ, IL-2, TNF-α and CD40 ligand in individual CD4+ T cells at different stages of differentiation defined by relative expression of CD45RA and CD27 (Fig. 3c; see Supplementary Information, Fig. S2 and Table S2).
The CD45RA− CD27+, CD45RA− CD27− and CD45RA+ CD27− subsets contained more cells with three and four functions compared with the CD45RA+ CD27+ CD4+ naive T-cell population (functions expressed are detailed in Supplementary Information, Table S2). These differences were highly significant (Wilcoxon matched pairs test; for all comparisons naive versus other subsets P < 0·0001; Fig. 3c). Both CD45RA− CD27− and CD45RA+ CD27− CD4+ T cells showed equivalent multifunctionality (P = ns), which was higher than in the CD45RA− CD27+ and naive CD45RA+ CD27+ CD4+ T-cell populations (P < 0·01). This indicates that although CD45RA+ CD27− CD4+ T cells bear phenotypic characteristics of highly differentiated T cells, they are not exhausted functionally but instead are capable of potent effector function. We found no evidence for a decreased functionality of CD45RA− CD27− and CD45RA+ CD27− CD4+ T cells when we compared old with young donors after activation with a polyclonal T-cell stimulus (anti-CD3 antibody); these populations were equally multifunctional in both groups of subjects (Mann–Whitney U-test, data not shown).
Survival of CD45RA+ CD27− CD4+ T cells following activation
Beside the ability to secrete cytokines and express cytotoxic machinery, another critical element for T-cell-mediated immune protection is their ability to proliferate and survive after activation. We observed that after T-cell receptor stimulation in vitro CD45RA+ CD27+ and CD45RA− CD27+ CD4+ T-cell populations expanded more than CD45RA− CD27− and CD45RA+ CD27− subsets during culture (Fig. 4a,b; see Supplementary Information, Fig. S3a). To understand the extent to which increased cell death, rather than reduced proliferation, contributes to the decline of the CD45RA+ CD27− population after in vitro stimulation, we measured the rate of cell death by monitoring Annexin V staining and PI incorporation after activation (Fig. 4c,d). The analysis of early apoptotic (Annexin V+ PI−) and late apoptotic/necrotic (Annexin V+ PI+) cells in the different subsets at day 3 after activation showed that CD4+ CD45RA+ CD27− T cells are significantly more prone to cell death than all other subsets. A time–course of Annexin V staining and PI incorporation showed that by day 15 CD4+ CD45RA+ CD27− T cells are almost completely dead when all other subsets are still present in culture (see Supplementary Information, Fig. S3c).
Figure 4.

CD4+ CD45RA+ CD27− cells do not accumulate in culture following activation. (a) Purified CD45RA/CD27 CD4+ T-cell subsets were activated with anti-CD3 and irradiated antigen-presenting cells. At the indicated time-points, the cell number was determined on a haemocytometer. Results are expressed as a percentage of the initial number of cells placed in culture; one representative experiment is shown (results from another donor is shown in supplementary information Fig. S3). (b) Bar graph represents cell recovery at day 3 after anti-CD3 and interleukin-2 (IL-2) activation. Error bars represent the SE from the mean of three separate experiments. Statistical analysis was performed using paired t-test (GraphPad Prism). (c,d) Apoptosis was assessed by Annexin V staining and propidium iodide (PI) incorporation. The percentage of early apoptotic (Annexin V+ PI−) and late apoptotic/necrotic (Annexin V+ PI+) cells was assessed after anti-CD3 and interleukin-2 (IL-2) activation on day 3. Representative pseudocolour plots are shown (c). (d) Bar graph represents early apoptotic (left panel) and late apoptotic/necrotic cells (right panel) at day 3 after anti-CD3 and IL-2 activation. Error bars represent the SE from the mean of four separate experiments. Statistical analysis was performed using paired t-test.
To explore the possibility that pro-survival pathways are defective in CD45RA+ CD27− CD4+ T cells, which makes them susceptible to apoptosis, we investigated the expression of the anti-apoptotic protein Bcl-2, measured by intracellular staining of CD4+ T-cell subsets directly ex vivo (Fig. 5a).30 We found that Bcl-2 expression is significantly lower in CD45RA+ CD27− CD4+ T cells compared with all the other subsets (P < 0·0001). A critical role in promoting cell survival is also ascribed to Akt, which operates by blocking the function of pro-apoptotic proteins and processes.28,31 Akt is phosphorylated at two sites – serine 473 and threonine 308. We previously showed that there is defective phosphorylation of Akt(ser473) but not Akt(thr308) in highly differentiated CD8+ T cells.28,31 We now show that there is a decrease in pAkt(ser473) from CD45RA+ CD27+ (naive), CD45RA− CD27+, CD45RA− CD27− and CD45RA+ CD27− subsets, respectively (Fig. 5b). Therefore CD45RA+ CD27− CD4+ T cells have potent effector function but have decreased capacity for survival after activation, associated with decreased Bcl-2 expression and Akt(ser473) phosphorylation.
Figure 5.
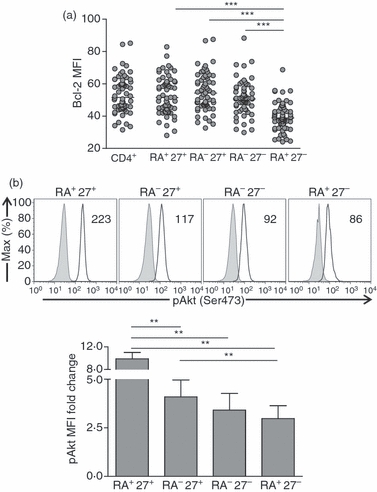
CD4+ CD45RA+ CD27− cells have altered survival signalling pathways. (a) Bcl-2 ex vivo mean fluorescence intensity was assessed in peripheral blood mononuclear cells (PBMCs) by gating within total CD4+ T cells and within each of the CD45RA/CD27 subsets. Horizontal lines depict median values. Statistical analysis was performed using the Wilcoxon matched pairs test (GraphPad Prism). (b) Representative overlays of pAkt (Ser473) expression within CD4+ CD45RA/CD27 subsets activated with anti-CD3 (solid line) and within unstimulated cells which underwent the same protocol in the absence of anti-CD3 (grey histogram) are shown. The values represent the median fluorescent intensity of pAkt (Ser473) within each subset following activation. Bar graph represents the fold change in pAkt(Ser473) mean fluorescence intensity (MFI) after activation relative to the MFI observed in unstimulated cells within the respective subset. Error bars represent the SE from the mean of five separate experiments. Statistical analysis was performed using paired t-test (GraphPad Prism).
CD4+ memory T cells re-expressing CD45RA+ derive from CD45RA− CD27+ CD4+ T cells by IL-7-driven homeostatic proliferation
Previous studies have shown that within CD8+ T cells cytokines such as IL-15 that drive homeostatic proliferation also induce the generation of CD45RA+ CD27− CD8+ T cells.21,32,33 Although the presence CD4+ CD45RA+ CD27− T cells has been described previously26 the mechanism by which they are induced is not known. We showed previously that IL-7 can induce the proliferation of CD4+ CD45RA+ (naive) T cells without inducing CD45RO expression,34 which was subsequently supported by other studies.35 We therefore investigated whether this cytokine could induce CD45RA re-expression in CD45RA− CD27+ or CD45RA− CD27− CD4+ T cells. These cells were isolated by cell sorting then cultured in the presence of IL-2, IL-7 or IL-15 without T-cell receptor stimulation (Fig. 6; see Supplementary Information, Figs S4 and S5). After 6 days, a population re-expressing CD45RA and down-modulating CD45RO emerged from the CD45RA− CD27+ cells cultured in the presence of IL-7 (Fig. 6a). T-cell receptor stimulation alone did not induce CD45RA re-expression and neither did a panel of cytokines including transforming growth factor-β, IL-10 and IFN-α (unpublished observations). We also performed a CFSE dilution assay on CD45RA− CD27+ cells in the presence of IL-7 to assess whether CD45RA re-expression is accompanied by proliferation driven by IL-7. The CD45RA+ cells that were generated in vitro from CD45RA− CD27+ cells by IL-7 divided more than the cells that remained CD45RA− and CD45RO+ in the same culture (Fig. 6b). Although a low level of CD45RA expression was observed in a small proportion of CD45RA− CD27+ CD4+ T cells that were cultured with IL-2 or IL-15 (see Supplementary Information, Fig. S4), this was considerably lower than that induced by IL-7 (Fig. 6a). The relatively weak effect of IL-15 on the induction of CD45RA in CD45RA− CD27+ cells was not enhanced by a higher dose (10 ng/ml) of this cytokine (data not shown).
Figure 6.

CD4+ CD45RA− CD27+ cells stably re-express CD45RA following interleukin-7 (IL-7) -driven proliferation. CD4+ CD45RA− CD27+ cells were purified by FACS sorting and analysed for the expression of CD45RA and CD45RO before culture. (a) Cells were stimulated with IL-7 and CD45RA/CD45RO expression was assessed by flow cytometry at the indicated time-points. The results shown are representative of 12 experiments. (b) Carboxyfluorescein diacetate succinimidyl ester (CFSE) dilution was assessed in the cells that re-expressed CD45RA and in the population that remained CD45RA− following 14 days of culture in the presence of IL-7. Values represent the percentage of cells that underwent more than two rounds of cell division. (c) Overlays represent Bcl-2 and IL-7Rα expression before and during culture in the presence of IL-7 within CD45RA+ cells (solid line) and CD45RA− cells (grey histogram). Histograms from a representative experiment out of three performed are shown.
The CD45RA− CD27− subset cultured in the same experimental conditions did respond to IL-7 in terms of survival (data not shown) but did not re-express CD45RA and remained CD45RO+ throughout the culture period (see Supplementary Information, Fig. S5). These results suggest that IL-7-driven homeostatic proliferation can induce the re-expression of CD45RA in CD45RA− CD27+ CD4+ T cells but cannot induce the CD45RA− CD27− population to form the CD45RA+ memory population. We next determined whether the memory CD45RA+ cells that were generated in vitro resembled phenotypically those that are found in vivo. To do this we monitored the expression of CD27, Bcl-2 and IL-7Rα after different time-points of IL-7 treatment of CD45RA− CD27+ CD4+ T cells in vitro. The population that remained CD45RA− CD45RO+ expressed homogeneously high levels of Bcl-2 and IL-7Rα throughout the culture period (Fig. 6c), except for the initial down-regulation of IL-7Rα (visible at day 5). In contrast the population of CD45RA+ cells that emerged down-regulated both Bcl-2 and IL7-Rα over time (Fig. 6c). Interleukin-7 stimulation of CD45RA− CD27+ CD4+ T cells results in the generation of a population with heterogeneous expression of CD27. However, a small percentage of the CD45RA re-expressing cells are CD27− (see Supplementary Information, Fig. S6). As IL-7 induces CD45RA but not complete loss of CD27 in the timeframe of experimental protocol we acknowledge that other factors in addition to IL-7 may also be required for the generation of a CD45RA+ CD27− T-cell population from CD45RA− CD27+ cells.
Preferential localization of CD45RA+ CD27− CD4+ T cells in the bone marrow
All the results presented so far were performed using CD4+ T cells from peripheral blood. The bone marrow has been known to be a source of IL-7 in vivo.36 We therefore examined the possibility that there was preferential accumulation of CD45RA+ CD27− CD4+ T cells of a particular specificity in this lymphoid compartment. First we compared the distribution of CD4+ CD45RA/CD27 subsets in paired blood and bone marrow samples from healthy donors and observed a significant increase in the percentage of CD45RA− CD27− and CD45RA+ CD27− CD4+ T cells in the bone marrow compared with the blood of the same individuals (Fig. 7a). We investigated next whether the specificity of T cells in the bone marrow was similar to that found in the blood of the same individuals (Fig. 7b). We found that the increased proportion of CMV-specific CD4+ T cells relative to other populations was also observed in bone marrow samples, indicating that the inflation of CMV-specific T cells occurs in more than one lymphoid compartment in vivo (Fig. 7b) In addition, the proportion of CMV-, VZV- and EBV-specific CD4+ T cells was not significantly different between the two compartments. However, there were significantly more PPD-specific CD4+ T cells in the bone marrow compared with the peripheral blood from the same donors, although the significance of this is not clear at present.
Figure 7.
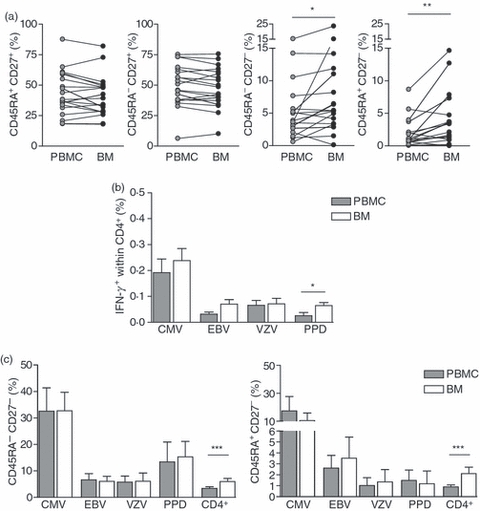
CD4+ CD45RA+ CD27− cells appear to accumulate in the bone marrow. (a) Phenotypic analysis of CD45RA/CD27 expression on paired peripheral blood mononuclear cell (PBMC) and bone marrow (BM) samples. Frequencies of each of the CD45RA/CD27 populations within total CD4+ T cells are shown. (b,c) Paired PBMCs and BM cells were stimulated overnight with varicella zoster virus (VZV), cytomegalovirus (CMV) and Epstein–Barr virus (EBV) viral lysates or purified protein derivative (PPD) in the presence of brefeldin A and analysed by flow cytometry. Antigen-specific populations were identified by intracellular staining for interferon-γ (IFN-γ) production along with CD4, CD45RA and CD27 surface staining. (b) The frequency of CD4+ T cells that were antigen-specific in PBMC and BM samples was determined in all donors (n = 11) with a positive response (> 0·02% once corrected for background). (c) The percentage of antigen specific CD4+ T cells that displayed a CD45RA− CD27− or a CD45RA+ CD27− phenotype was assessed in PBMCs and BM (n = 15). Statistical analysis was performed using the Wilcoxon matched pairs test (GraphPad Prism).
We next investigated whether there was preferential accumulation of CD45RA− CD27− and CD45RA+ CD27− CD4+ T cells of a particular specificity in the bone marrow. We found that the proportion of CMV-, VZV-, EBV- and PPD-specific populations in the bone marrow that were CD45RA− CD27− and CD45RA+ CD27− was not different to that in the blood of the same individuals (Fig. 7c). Therefore it appears that CD45RA− CD27− and CD45RA+ CD27− T cells of all specificities have equal propensity to accumulate in the bone marrow and that it is not a unique site for the generation of CMV-specific effector/memory CD4+ T cells.
Discussion
In this study we show that whereas persistent CMV infection is mainly responsible for the increase of CD45RA− CD27− and CD45RA+ CD27− CD4+ T cells in older subjects, both ageing as well as CMV infection contribute to the decrease of CD45RA+ CD27+ CD4+ T cells. This latter observation may reflect the impact of thymic involution compounded with persistent CMV infection during ageing.1 The majority of CD45RA− CD27− and CD45RA+ CD27− populations in CMV-infected subjects are CMV-specific but there are also increased numbers of these effector CD4+ cells that are specific for other viruses, i.e. EBV, HSV and VZV. This suggests that CMV infection may drive a global increase in CD4+ T-cell differentiation suggesting a bystander phenomenon. However, we cannot rule out the possibility that some people are particularly susceptible to the reactivation of latent viruses in general, CMV included. The bystander effect may be mediated in part by IFN-α that is secreted by CMV-stimulated plasmacytotoid dendritic cells as a result of toll-like receptor stimulation15 or by TNF-α.26 IFN-α and TNF-α have been shown to accelerate the loss of CD27 and CD28 in both CD4+15,37,38 and CD8+39 T cells in humans. However, the induction of IFN-α may also lead to the secondary secretion of other cytokines such as IL-15,40,41 which may induce homeostatic proliferation and CD45RA re-expression during CMV-specific CD8+ T-cell activation.20,42–44 It is currently not known whether IFN-α can also induce IL-7 secretion by leucocytes or stromal cells but this is under investigation. These observations suggest that the accumulation of highly differentiated CD45RA− CD27− and CD45RA+ CD27− CD4+ T cells in CMV-infected individuals may be related in part to the cytokines that are secreted either as a direct or indirect consequence of CMV re-activation in vivo.
There has been controversy about the extent to which CMV re-activation occurs in seropositive individuals. Earlier studies did not find increased CMV DNA in the blood of older humans.45 However, a recent study confirmed that while CMV viral DNA is undetectable in the blood of healthy old volunteers, it is significantly increased in the urine of these individuals compared with a younger cohort of CMV-seropositive subjects.46 This indicates that the ability to control CMV re-activation may be compromised during ageing and that this may lead to increased activation of CMV-specific T cells in older subjects.46 Therefore, the increased CMV-specific T-cell re-activation together with secretion of differentiation-inducing cytokines such as IFN-α,15,37,39 may culminate in the highly differentiated memory T-cell repertoire that is found in older CMV-infected humans.
Previous reports on CD8+ T cells that re-express CD45RA have described them as terminally differentiated and exhausted.21,22 However, we and others have shown that CD45RA+ CD27− CD8+ T cells can be re-activated to proliferate and exhibit effector functions in vitro,20,25,32 indicating that they are functional and retain replicative potential and are an important memory subset.47 We now extend these observations by showing that the same applies to CD45RA+ CD27− cells within the CD4+ T-cell population that secrete multiple cytokines as efficiently as the CD45RA− CD27− population and more efficiently than the naive CD45RA+ CD27+ and CD45RA− CD27+ subsets after T-cell receptor activation. In addition, the CD45RA+ CD27− and CD45RA− CD27− CD4+ T-cell populations that accumulate in CMV-seropositive donors also have cytotoxic potential but it is not clear what their target population may be.
In addition to their functionality, the ability of CD45RA− CD27− and CD45RA+ CD27− T cells to proliferate and survive after T-cell receptor or homeostatic cytokine stimulation is crucial for their role in immunity. We showed that not only CD45RA− CD27− but especially CD45RA+ CD27− CD4+ T cells have reduced levels of Bcl-2 and impaired Akt phosphorylation. These changes may account for the susceptibility of these cells to apoptosis after activation, which contributes to their inability to accumulate after stimulation in vitro. However, this does not necessarily imply that CD45RA− CD27− and CD45RA+ CD27− CD4+ T cells are short lived in vivo. It has been shown that stromal cells can promote the survival of apoptosis-prone T cells that have down-regulated Bcl-230,48 and that the cytokines involved are type 1 interferons (IFN-α, IFN-β).49 In addition, IFN-α/β secreted by stromal cells can also prevent the activation-induced apoptosis of antigen-specific CD4+ T-cell clones.50 These data indicate that although CD45RA− CD27− and CD45RA+ CD27− cells may appear to be susceptible to apoptosis in vitro, there may be soluble factors that are present in vivo that enable them to persist. This may explain why CD45RA+ CD27− CD8+ T cells from older humans show unusual kinetic properties in deuterated glucose uptake studies, where their persistence in the blood is not related to the extent to which they proliferate,51 indicating a possible role for anti-apoptotic factors in vivo.
Our studies suggest that one way in which CMV-specific CD45RA+ CD27− CD4+ T cells may be generated is by IL-7-driven homeostatic proliferation, possibly in combination with other factors. This raises the question as to where this process may occur in vivo. It is widely accepted that bone marrow stromal cells are a source of IL-7 that enables the maturation and differentiation of specific progenitor cells36 and it has been shown that professional memory CD4+ T cells co-localize with IL-7-producing stromal cells in vivo.52 We therefore investigated whether the bone marrow was a possible site for IL-7-driven CD45RA re-expression in memory T cells. There were significantly more CD45RA+ CD27− T cells in the total CD4+ compartment in the bone marrow compared with the blood of the same subjects. However, there was not a preferential accumulation of CD45RA+ CD27− T cells of any particular specificity in the bone marrow. This suggests two possibilities. First, that CD45RA+ CD27− T cells of all specificities preferentially migrate to the bone marrow, or alternatively IL-7 in the bone marrow may induce CD45RA re-expression on CD4+ T cells irrespective of their antigen specificity. Our current experimental system does not allow us to discriminate between these possibilities.
Collectively our results suggest that cytokine secretion may have a largely ignored role in shaping the highly differentiated T-cell repertoire in older humans. Although it is currently unclear why the increase in highly differentiated T cells that are largely CMV-specific is detrimental during ageing,5 the manipulation of the cytokines that may be involved in their generation may be a possible strategy to prevent their accumulation.
Acknowledgments
This work was supported by grants from the Biotechnological and Biological Sciences Research Council (to A.N.A.). R.I.A. received a scholarship from Fundação para a Ciência e a Tecnologia (FCT) co-financed by Programa Operacional Ciência e Inovação 2010 (POCI 2010) and FSE. We thank Professor Caroline Sabin and Doctor Pedro Coutinho for support in statistical analysis. We are also grateful to all the blood donors who took part in this study.
Disclosures
The authors declare no financial conflicts of interest.
Supporting information
Additional supporting information may be found in the online version of this article:
Figure S1. High frequency of cytomegalovirus (CMV) - specific CD4+ T cells. Peripheral blood mononuclear cells were stimulated with CMV, Epstein-Barr virus (EBV), herpes simplex virus (HSV), varicella zoster virus (VZV) or purified protein derivative (PPD) lysate and the percentage of interferon-γ (IFN-γ) secreting antigen-specific CD4+ T cells was assessed by flow cytometry (a). The frequency of CD4+ T cells that were specific for CMV, EBV, HSV, VZV or PPD was determined in individuals who were seropositive for these agents (b). Only responses > 0.02 % above background (unstimulated cells) were considered positive. Horizontal lines depict median values. Significantly increased frequency of CMV specific CD4+ T cells relative to the other antigens is indicated (Wilcoxon rank test, GraphPad Prism).
Figure S2. Multiparameter flow cytometric analysis. Representative dot plots from one donor show the distribution of stimulated CD4 T cells within each CD45RA/CD27 subset. Panels show CD4 plotted against: CD40 ligand (CD40L; upper right), interferon-γ (IFN-γ; upper left), interleukin-2 (IL-2; lower right) and tumour necrosis factor-α (TNF-α; lower left), each for unstimulated and anti-CD3 stimulated T cells.
Figure S3. Cell recovery. Purified CD45RA/CD27 CD4+ T-cell subsets were activated with anti-CD3 and irradiated antigen-presenting cells and irradiated antigen-presenting cells. At the indicated time-points, the cell number was determined on a haemocytometer. Results are expressed as a percentage of the initial number of cells placed in culture; results for one donor are shown. (b,c) Apoptosis was assessed by Annexin V staining and propidium iodide (PI) incorporation. The percentage of early apoptotic (Annexin V+ PI−) and late apoptotic/necrotic (Annexin V+ PI+) cells was assessed in the indicated days. Representative pseudocolour plots are shown (b).
Figure S4. CD4+ CD45RA− CD27+ cells were purified by FACS sorting and analysed for the expression of CD45RA and CD45RO before culture. Cells were stimulated with interleukin-2 (IL-2) or IL-15 and CD45RA/CD45RO expression was assessed by flow cytometry at the indicated time-points. The results shown are representative of four experiments.
Figure S5. CD4+ CD45RA− CD27− cells were purified by FACS sorting and analysed for the expression of CD45RA and CD45RO before culture. Cells were stimulated with interleukin-7 (IL-7), IL-2 or IL-15 and CD45RA/CD45RO expression was assessed by flow cytometry at the indicated time-points. The results shown are representative of three experiments.
Figure S6. CD4+ CD45RA− CD27+ cells were purified by FACS sorting. Cells were stimulated with interleukin-7 (IL-7), or IL-15 and CD45RA/CD27 expression was assessed by flow cytometry at the indicated time-points.
Table S1. Results from multiple linear regression fitting age and cytomegalovirus (CMV) status as co-variates. Table shows the unstandardized coefficient, significance and 95 % confidence interval from the output of SPSS software for each CD45RA/CD27 subset. Unit of age is equal to 1 year.
Table S2. Mean frequencies and the standard error of the mean of CD40 ligand (CD40L), interferon-γ (IFN-γ), interleukin-2 (IL-2) and tumour necrosis factor-α (TNF-α) in all possible combinations in each CD45RA/CD27 subset.
Please note: Wiley-Blackwell is not responsible for the content or functionality of any supporting materials supplied by the authors. Any queries (other than missing material) should be directed to the corresponding author for the article.
References
- 1.McElhaney JE, Effros RB. Immunosenescence: what does it mean to health outcomes in older adults? Curr Opin Immunol. 2009;21:418–24. doi: 10.1016/j.coi.2009.05.023. [DOI] [PMC free article] [PubMed] [Google Scholar]
- 2.Akbar AN, Beverley PC, Salmon M. Will telomere erosion lead to a loss of T-cell memory? Nat Rev Immunol. 2004;4:737–43. doi: 10.1038/nri1440. [DOI] [PubMed] [Google Scholar]
- 3.Nikolich-Zugich J. Ageing and life-long maintenance of T-cell subsets in the face of latent persistent infections. Nat Rev Immunol. 2008;8:512–22. doi: 10.1038/nri2318. [DOI] [PMC free article] [PubMed] [Google Scholar]
- 4.Shin H, Wherry EJ. CD8 T cell dysfunction during chronic viral infection. Curr Opin Immunol. 2007;19:408–15. doi: 10.1016/j.coi.2007.06.004. [DOI] [PubMed] [Google Scholar]
- 5.Derhovanessian E, Larbi A, Pawelec G. Biomarkers of human immunosenescence: impact of cytomegalovirus infection. Curr Opin Immunol. 2009;21:440–5. doi: 10.1016/j.coi.2009.05.012. [DOI] [PubMed] [Google Scholar]
- 6.Appay V, Dunbar PR, Callan M, et al. Memory CD8+ T cells vary in differentiation phenotype in different persistent virus infections. Nat Med. 2002;8:379–85. doi: 10.1038/nm0402-379. [DOI] [PubMed] [Google Scholar]
- 7.van de Berg PJ, Griffiths SJ, Yong SL, et al. Cytomegalovirus infection reduces telomere length of the circulating T cell pool. J Immunol. 2010;184:3417–23. doi: 10.4049/jimmunol.0903442. [DOI] [PubMed] [Google Scholar]
- 8.Akbar AN, Fletcher JM. Memory T cell homeostasis and senescence during aging. Curr Opin Immunol. 2005;17:480–5. doi: 10.1016/j.coi.2005.07.019. [DOI] [PubMed] [Google Scholar]
- 9.Messaoudi I, Lemaoult J, Guevara-Patino JA, Metzner BM, Nikolich-Zugich J. Age-related CD8 T cell clonal expansions constrict CD8 T cell repertoire and have the potential to impair immune defense. J Exp Med. 2004;200:1347–58. doi: 10.1084/jem.20040437. [DOI] [PMC free article] [PubMed] [Google Scholar]
- 10.Khan N, Hislop A, Gudgeon N, Cobbold M, Khanna R, Nayak L, Rickinson AB, Moss PA. Herpesvirus-specific CD8 T cell immunity in old age: cytomegalovirus impairs the response to a coresident EBV infection. J Immunol. 2004;173:7481–9. doi: 10.4049/jimmunol.173.12.7481. [DOI] [PubMed] [Google Scholar]
- 11.Gamadia LE, Rentenaar RJ, Baars PA, et al. Differentiation of cytomegalovirus-specific CD8+ T cells in healthy and immunosuppressed virus carriers. Blood. 2001;98:754–61. doi: 10.1182/blood.v98.3.754. [DOI] [PubMed] [Google Scholar]
- 12.Pita-Lopez ML, Gayoso I, Delarosa O, Casado JG, Alonso C, Munoz-Gomariz E, Tarazona R, Solana R. Effect of ageing on CMV-specific CD8 T cells from CMV seropositive healthy donors. Immun Ageing. 2009;6:11. doi: 10.1186/1742-4933-6-11. [DOI] [PMC free article] [PubMed] [Google Scholar]
- 13.Chidrawar S, Khan N, Wei W, McLarnon A, Smith N, Nayak L, Moss P. Cytomegalovirus-seropositivity has a profound influence on the magnitude of major lymphoid subsets within healthy individuals. Clin Exp Immunol. 2009;155:423–32. doi: 10.1111/j.1365-2249.2008.03785.x. [DOI] [PMC free article] [PubMed] [Google Scholar]
- 14.Pourgheysari B, Khan N, Best D, Bruton R, Nayak L, Moss PA. The cytomegalovirus-specific CD4+ T-cell response expands with age and markedly alters the CD4+ T-cell repertoire. J Virol. 2007;81:7759–65. doi: 10.1128/JVI.01262-06. [DOI] [PMC free article] [PubMed] [Google Scholar]
- 15.Fletcher JM, Vukmanovic-Stejic M, Dunne PJ, et al. Cytomegalovirus-specific CD4+ T cells in healthy carriers are continuously driven to replicative exhaustion. J Immunol. 2005;175:8218–25. doi: 10.4049/jimmunol.175.12.8218. [DOI] [PubMed] [Google Scholar]
- 16.Weinberger B, Lazuardi L, Weiskirchner I, et al. Healthy aging and latent infection with CMV lead to distinct changes in CD8+ and CD4+ T-cell subsets in the elderly. Hum Immunol. 2007;68:86–90. doi: 10.1016/j.humimm.2006.10.019. [DOI] [PubMed] [Google Scholar]
- 17.Appay V, van Lier RA, Sallusto F, Roederer M. Phenotype and function of human T lymphocyte subsets: consensus and issues. Cytometry A. 2008;73:975–83. doi: 10.1002/cyto.a.20643. [DOI] [PubMed] [Google Scholar]
- 18.Akbar AN, Terry L, Timms A, Beverley PC, Janossy G. Loss of CD45R and gain of UCHL1 reactivity is a feature of primed T cells. J Immunol. 1988;140:2171–8. [PubMed] [Google Scholar]
- 19.Faint JM, Annels NE, Curnow SJ, et al. Memory T cells constitute a subset of the human CD8+ CD45RA+ pool with distinct phenotypic and migratory characteristics. J Immunol. 2001;167:212–20. doi: 10.4049/jimmunol.167.1.212. [DOI] [PubMed] [Google Scholar]
- 20.Wills MR, Carmichael AJ, Weekes MP, Mynard K, Okecha G, Hicks R, Sissons JG. Human virus-specific CD8+ CTL clones revert from CD45ROhigh to CD45RAhighin vivo: CD45RAhigh CD8+ T cells comprise both naive and memory cells. J Immunol. 1999;162:7080–7. [PubMed] [Google Scholar]
- 21.Geginat J, Lanzavecchia A, Sallusto F. Proliferation and differentiation potential of human CD8+ memory T-cell subsets in response to antigen or homeostatic cytokines. Blood. 2003;101:4260–6. doi: 10.1182/blood-2002-11-3577. [DOI] [PubMed] [Google Scholar]
- 22.Champagne P, Ogg GS, King AS, et al. Skewed maturation of memory HIV-specific CD8 T lymphocytes. Nature. 2001;410:106–11. doi: 10.1038/35065118. [DOI] [PubMed] [Google Scholar]
- 23.Hoflich C, Docke WD, Busch A, Kern F, Volk HD. CD45RAbright/CD11abright CD8+ T cells: effector T cells. Int Immunol. 1998;10:1837–45. doi: 10.1093/intimm/10.12.1837. [DOI] [PubMed] [Google Scholar]
- 24.Waller EC, McKinney N, Hicks R, Carmichael AJ, Sissons JG, Wills MR. Differential costimulation through CD137 (4-1BB) restores proliferation of human virus-specific “effector memory” (CD28– CD45RAHI) CD8+ T cells. Blood. 2007;110:4360–6. doi: 10.1182/blood-2007-07-104604. [DOI] [PubMed] [Google Scholar]
- 25.Dunne PJ, Faint JM, Gudgeon NH, et al. Epstein-Barr virus-specific CD8+ T cells that re-express CD45RA are apoptosis-resistant memory cells that retain replicative potential. Blood. 2002;100:933–40. doi: 10.1182/blood-2002-01-0160. [DOI] [PubMed] [Google Scholar]
- 26.Saule P, Trauet J, Dutriez V, Lekeux V, Dessaint JP, Labalette M. Accumulation of memory T cells from childhood to old age: central and effector memory cells in CD4+ versus effector memory and terminally differentiated memory cells in CD8+ compartment. Mech Ageing Dev. 2006;127:274–81. doi: 10.1016/j.mad.2005.11.001. [DOI] [PubMed] [Google Scholar]
- 27.Weyand CM, Fulbright JW, Goronzy JJ. Immunosenescence, autoimmunity, and rheumatoid arthritis. Exp Gerontol. 2003;38:833–41. doi: 10.1016/s0531-5565(03)00090-1. [DOI] [PubMed] [Google Scholar]
- 28.Plunkett FJ, Franzese O, Finney HM, et al. The loss of telomerase activity in highly differentiated CD8+CD28–CD27– T cells is associated with decreased Akt (Ser473) phosphorylation. J Immunol. 2007;178:7710–9. doi: 10.4049/jimmunol.178.12.7710. [DOI] [PubMed] [Google Scholar]
- 29.Kannanganat S, Ibegbu C, Chennareddi L, Robinson HL, Amara RR. Multiple-cytokine-producing antiviral CD4 T cells are functionally superior to single-cytokine-producing cells. J Virol. 2007;81:8468–76. doi: 10.1128/JVI.00228-07. [DOI] [PMC free article] [PubMed] [Google Scholar]
- 30.Akbar AN, Borthwick N, Salmon M, et al. The significance of low bcl-2 expression by CD45RO T cells in normal individuals and patients with acute viral infections. The role of apoptosis in T cell memory. J Exp Med. 1993;178:427–38. doi: 10.1084/jem.178.2.427. [DOI] [PMC free article] [PubMed] [Google Scholar]
- 31.Henson SM, Franzese O, Macaulay R, et al. KLRG1 signaling induces defective Akt (ser473) phosphorylation and proliferative dysfunction of highly differentiated CD8+ T cells. Blood. 2009;113:6619–28. doi: 10.1182/blood-2009-01-199588. [DOI] [PubMed] [Google Scholar]
- 32.Dunne PJ, Belaramani L, Fletcher JM, et al. Quiescence and functional reprogramming of Epstein–Barr virus (EBV)-specific CD8+ T cells during persistent infection. Blood. 2005;106:558–65. doi: 10.1182/blood-2004-11-4469. [DOI] [PubMed] [Google Scholar]
- 33.Wallace DL, Berard M, Soares MV, Oldham J, Cook JE, Akbar AN, Tough DF, Beverley PC. Prolonged exposure of naive CD8+ T cells to interleukin-7 or interleukin-15 stimulates proliferation without differentiation or loss of telomere length. Immunology. 2006;119:243–53. doi: 10.1111/j.1365-2567.2006.02429.x. [DOI] [PMC free article] [PubMed] [Google Scholar]
- 34.Soares MV, Borthwick NJ, Maini MK, Janossy G, Salmon M, Akbar AN. IL-7-dependent extrathymic expansion of CD45RA+ T cells enables preservation of a naive repertoire. J Immunol. 1998;161:5909–17. [PubMed] [Google Scholar]
- 35.Geginat J, Sallusto F, Lanzavecchia A. Cytokine-driven proliferation and differentiation of human naive, central memory, and effector memory CD4+ T cells. J Exp Med. 2001;194:1711–9. doi: 10.1084/jem.194.12.1711. [DOI] [PMC free article] [PubMed] [Google Scholar]
- 36.Sudo T, Ito M, Ogawa Y, et al. Interleukin 7 production and function in stromal cell-dependent B cell development. J Exp Med. 1989;170:333–8. doi: 10.1084/jem.170.1.333. [DOI] [PMC free article] [PubMed] [Google Scholar]
- 37.Reed JR, Vukmanovic-Stejic M, Fletcher JM, et al. Telomere erosion in memory T cells induced by telomerase inhibition at the site of antigenic challenge in vivo. J Exp Med. 2004;199:1433–43. doi: 10.1084/jem.20040178. [DOI] [PMC free article] [PubMed] [Google Scholar]
- 38.Bryl E, Vallejo AN, Weyand CM, Goronzy JJ. Down-regulation of CD28 expression by TNF-alpha. J Immunol. 2001;167:3231–8. doi: 10.4049/jimmunol.167.6.3231. [DOI] [PubMed] [Google Scholar]
- 39.Borthwick NJ, Lowdell M, Salmon M, Akbar AN. Loss of CD28 expression on CD8+ T cells is induced by IL-2 receptor gamma chain signalling cytokines and type I IFN, and increases susceptibility to activation-induced apoptosis. Int Immunol. 2000;12:1005–13. doi: 10.1093/intimm/12.7.1005. [DOI] [PubMed] [Google Scholar]
- 40.Tough DF, Borrow P, Sprent J. Induction of bystander T cell proliferation by viruses and type I interferon in vivo. Science. 1996;272:1947–50. doi: 10.1126/science.272.5270.1947. [DOI] [PubMed] [Google Scholar]
- 41.Zhang X, Sun S, Hwang I, Tough DF, Sprent J. Potent and selective stimulation of memory-phenotype CD8+ T cells in vivo by IL-15. Immunity. 1998;8:591–9. doi: 10.1016/s1074-7613(00)80564-6. [DOI] [PubMed] [Google Scholar]
- 42.Judge AD, Zhang X, Fujii H, Surh CD, Sprent J. Interleukin 15 controls both proliferation and survival of a subset of memory-phenotype CD8+ T cells. J Exp Med. 2002;196:935–46. doi: 10.1084/jem.20020772. [DOI] [PMC free article] [PubMed] [Google Scholar]
- 43.Gillespie GM, Wills MR, Appay V, et al. Functional heterogeneity and high frequencies of cytomegalovirus-specific CD8+ T lymphocytes in healthy seropositive donors. J Virol. 2000;74:8140–50. doi: 10.1128/jvi.74.17.8140-8150.2000. [DOI] [PMC free article] [PubMed] [Google Scholar]
- 44.Wherry EJ, Becker TC, Boone D, Kaja MK, Ma A, Ahmed R. Homeostatic proliferation but not the generation of virus specific memory CD8 T cells is impaired in the absence of IL-15 or IL-15Ralpha. Adv Exp Med Biol. 2002;512:165–75. doi: 10.1007/978-1-4615-0757-4_22. [DOI] [PubMed] [Google Scholar]
- 45.Vescovini R, Telera A, Fagnoni FF, et al. Different contribution of EBV and CMV infections in very long-term carriers to age-related alterations of CD8+ T cells. Exp Gerontol. 2004;39:1233–43. doi: 10.1016/j.exger.2004.04.004. [DOI] [PubMed] [Google Scholar]
- 46.Stowe RP, Kozlova EV, Yetman DL, Walling DM, Goodwin JS, Glaser R. Chronic herpesvirus reactivation occurs in aging. Exp Gerontol. 2007;42:563–70. doi: 10.1016/j.exger.2007.01.005. [DOI] [PMC free article] [PubMed] [Google Scholar]
- 47.Akondy RS, Monson ND, Miller JD, et al. The yellow fever virus vaccine induces a broad and polyfunctional human memory CD8+ T cell response. J Immunol. 2009;183:7919–30. doi: 10.4049/jimmunol.0803903. [DOI] [PMC free article] [PubMed] [Google Scholar]
- 48.Gombert W, Borthwick NJ, Wallace DL, et al. Fibroblasts prevent apoptosis of IL-2-deprived T cells without inducing proliferation: a selective effect on Bcl-XL expression. Immunology. 1996;89:397–404. doi: 10.1046/j.1365-2567.1996.d01-759.x. [DOI] [PMC free article] [PubMed] [Google Scholar]
- 49.Pilling D, Akbar AN, Girdlestone J, et al. Interferon-beta mediates stromal cell rescue of T cells from apoptosis. Eur J Immunol. 1999;29:1041–50. doi: 10.1002/(SICI)1521-4141(199903)29:03<1041::AID-IMMU1041>3.0.CO;2-#. [DOI] [PubMed] [Google Scholar]
- 50.Lombardi G, Dunne PJ, Scheel-Toellner D, et al. Type 1 IFN maintains the survival of anergic CD4+ T cells. J Immunol. 2000;165:3782–9. doi: 10.4049/jimmunol.165.7.3782. [DOI] [PubMed] [Google Scholar]
- 51.Wallace DL, Zhang Y, Ghattas H, et al. Direct measurement of T cell subset kinetics in vivo in elderly men and women. J Immunol. 2004;173:1787–94. doi: 10.4049/jimmunol.173.3.1787. [DOI] [PubMed] [Google Scholar]
- 52.Tokoyoda K, Zehentmeier S, Hegazy AN, Albrecht I, Grun JR, Lohning M, Radbruch A. Professional memory CD4+ T lymphocytes preferentially reside and rest in the bone marrow. Immunity. 2009;30:721–30. doi: 10.1016/j.immuni.2009.03.015. [DOI] [PubMed] [Google Scholar]
Associated Data
This section collects any data citations, data availability statements, or supplementary materials included in this article.