Abstract
The rate limiting step in catalysis of bicarbonate dehydration by human carbonic anhydrase II (HCA II) is an intramolecular proton transfer from His64 to the zinc-bound hydroxide. We have examined the role of Tyr7 using site-specific mutagenesis and measuring catalysis by the 18O exchange method using membrane inlet mass spectrometry. The side chain of Tyr7 in HCAII extends into the active-site cavity about 7 Å from the catalytic zinc atom. Replacement of Tyr7 with eight other amino acids had no effect on the interconversion of bicarbonate and CO2, but in some cases caused enhancements in the rate constant of proton transfer by nearly 10-fold. The variant Y7I HCA II enhanced intramolecular proton transfer approximately two-fold; its structure was determined by X-ray crystallography at 1.5 Å resolution. No changes were observed in the ordered solvent structure in the active-site cavity or in the conformation of the side chain of the proton shuttle His64. However, the first eleven residues of the amino-terminal chain in Y7I HCA II assumed an alternate conformation compared with the wild type. Differential scanning calorimetry showed variants at position 7 had a melting temperature approximately 8 °C lower than that of the wild type.
Introduction
Carbonic anhydrases (CAs) are a family of predominantly zinc metalloenzymes found in nearly all forms of life. Carbonic anhydrase catalyzes the dehydration of bicarbonate and a proton into carbon dioxide and water by a two-stage mechanism (eqs 1, 2) [1–3] that appears to be a common feature in this diverse family of enzymes.
| (1) |
| (2) |
The first stage (eq 1) is the dehydration of bicarbonate by zinc-bound hydroxide and subsequent release of carbon dioxide leaving a hydroxide ion at the zinc. The second step in the dehydration direction (eq 2) requires proton transfer to zinc-bound hydroxide from bulk solvent. In many of the isozymes in the α class of CAs, including human carbonic anhydrase II (HCA II), His64 acts as a proton shuttle and provides a pathway for the transfer between bulk solvent and external buffer (B in eq 2). The side chain of His64 in HCA II lies on the rim of the active site cavity with two observed orientations in crystal structures: inward with the side chain pointing toward the zinc and outward with the side chain pointing towards bulk solvent [4, 5]. The intramolecular proton transfer in the second step (eq 2) is rate-limiting for the maximal velocity in well-buffered solutions [6, 7]. Human carbonic anhydrase II promotes a highly rapid catalysis with a maximal turnover rate of about 1 µs−1. For this reason, HCA II is a useful experimental and theoretical model to study the efficiency of proton transfers in a protein environment.
The active site cavity of HCA II has distinct hydrophilic and hydrophobic surfaces with the zinc ion at the bottom of a conical cavity. A chain of hydrogen bonded, ordered water molecules (W1, W2, W3a and W3b) extends from the zinc-bound water to the proton shuttle residue His64 [5] (Figure 1). The water network is maintained in part by interactions with hydrophilic residues within the active site cavity (Tyr7, Asn62, Asn67, Thr200). The significance of this ordered water network in rapid transfer of protons has been studied in various mutants of HCAII [8–14] as well as molecular dynamic simulations [15–18].
Figure 1.
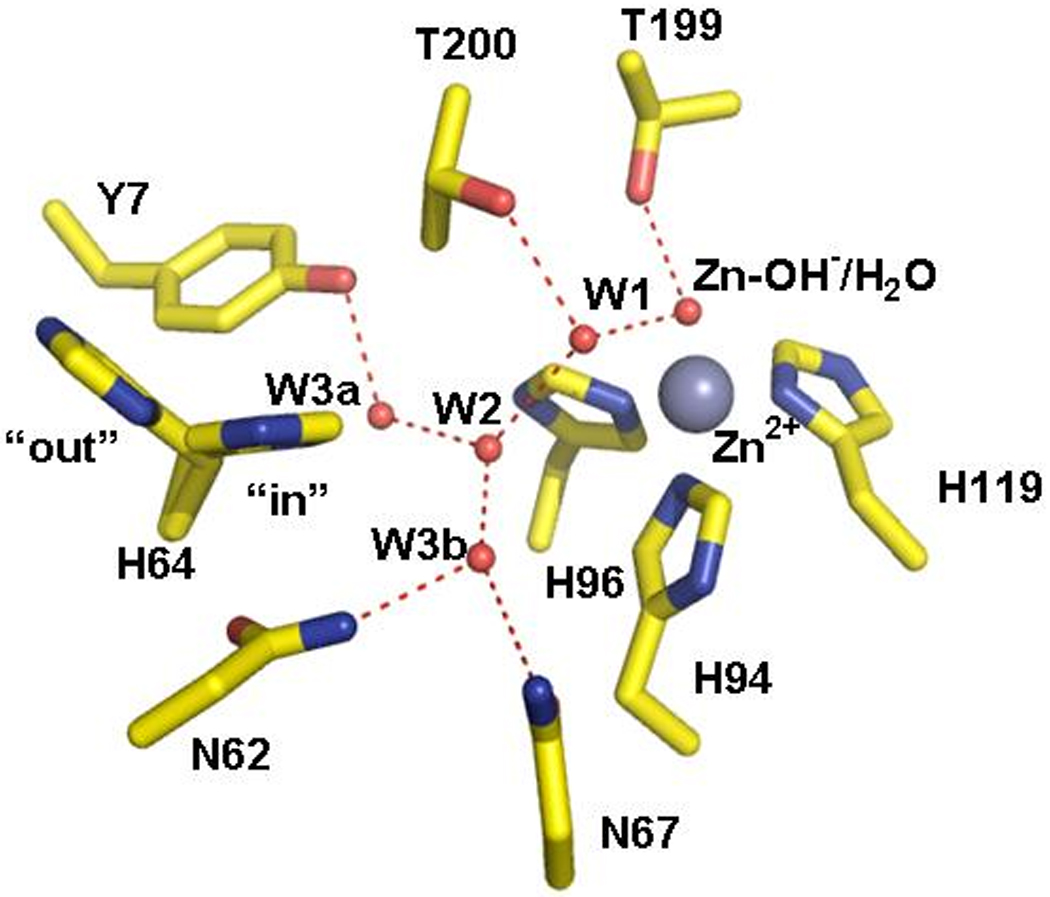
Crystal structure of the active site region of wild type HCA II at 1.05 Å resolution and pH 7.8 from Fisher et al. (PDB ID 2ILI) [5] The zinc ion and the oxygen of water molecules are shown as gray and red spheres, respectively. The water network of the active-site is labeled W1, W2, etc. Dashed red lines are assumed hydrogen bonds. The side chain of the proton shuttle His64 is shown in both the inward and outward orientations. This figure was generated and rendered with PyMOL (www.pymol.org).
Among the residues of interest on the hydrophilic side of the active site cavity is Tyr7, which is a conserved residue in the mammalian as well as in many other isozymes of CA in the α class [19]. The side chain of Tyr7 in HCA II extends into the active site cavity with no apparent interactions with other residues (Figure 1). The hydroxyl of Tyr7 appears to be within hydrogen bonding distance of water molecule W3a. However, the neutron crystal structure recently determined at pH 9 shows the tyrosine hydroxyl unprotonated and no such hydrogen bond to solvent [9]. Initial studies by stopped-flow spectrophotometry using the mutant Y7F HCA II showed catalytic activity in hydration marginally reduced [10]. However, further examination using 18O exchange showed that the proton transfer component of catalytic dehydration was enhanced as much as 9-fold compared to wild type [8].
Here we discuss a number of substitutions at position 7 in HCA II to provide further insight to the structural aspects influencing the rate of the intramolecular proton transfer step in the catalysis. Catalysis by each of the variants was studied by 18O exchange between CO2 and water using membrane inlet mass spectrometry, and the X-ray crystal structure of Y7I HCAII was determined at 1.5 Å resolution. We have found that substitution at Tyr7 had no effect on the first stage of catalysis (eq 1), but certain amino acids at position 7 showed enhanced rate constants for proton transfer, three-fold for Y7I and nearly 10-fold for Y7F compared with wild type. The variants with replacements at residue 7 had a lower thermal stability by about 8 °C and Y7I showed an altered conformation in the first eleven residues at the amino terminus. These studies emphasize the role of Tyr7 in establishing the fold of the N-terminus of HCA II and its influence in long range, intramolecular proton transfer.
Materials and Methods
Expression and purification of enzymes
Several variants of HCA II were created with the Stratagene Quick Change II site-directed mutagenesis kit (La Jolla, CA) on the expression vector coding the full-length wild type HCA II. Tyr 7 was replaced with Ala, Ile, Trp, Asp, Asn, Ser, and Arg. The DNA sequences of each single mutant were confirmed for the entire region coding of CA in the vector. The verified plasmids were then transformed for expression into Escherichia coli BL21(DE3)pLysS cells from Stratagene. The transformed cells were grown in LB media containing 1.0 mM ZnSO4 and induced with IPTG to a final concentration of 1.0 mM at an OD600 of 0.6 AU [14]. Each variant of Try 7 was purified by affinity chromatography using p-(aminomethyl) benzenesulfonamide coupled to agarose beads (Sigma) [20]. Protein concentrations of variants were determined by titration with the tight-binding inhibitor ethoxolamide and detecting activity by 18O exchange between CO2 and water.
Kinetics
Catalysis was measured by the 18O exchange method based on the measurement by membrane inlet mass spectrometry of the depletion of 18O from species of CO2 [21]. The apparatus uses a membrane probe of silastic tubing, which is permeable to dissolved gases and is submerged in the reaction solution. The probe is connected to glass tubing that runs through a dry-ice and acetone water trap and continues to the mass spectrometer (Extrel EXM-200) [22]. In the first of two independent stages of catalysis, the dehydration of labeled bicarbonate has a probability of transiently labeling the active site with 18O (eq 3). In a second stage, the protonation of the zinc-bound, 18O-labeled hydroxide results in the release of H2 18O to the solvent (eq 4).
| (3) |
| (4) |
Two rates for the 18O exchange catalyzed by CA are obtained by this method. The first is R1, the rate of exchange of CO2 and HCO3− at chemical equilibrium, as shown in eq 5. Here kcatexch is a rate constant for maximal interconversion of substrate and product, KeffS is an apparent binding constant for substrate to enzyme, and S indicates substrate, either CO2 or bicarbonate. For the most accurate mechanisms KeffS will contain some terms related to the binding of both CO2 and bicarbonate [23]. The ratio kcatexch/KeffCO2 is, in theory and in practice, equal to kcat/Km for hydration obtained by steady-state methods [23].
| (5) |
The second rate determined by this method is RH2O, which is the rate of release 18O labeled water from the active site (eq 4). RH2O is a measure that is dependent upon the donation of protons to the 18O-labeled zinc-bound hydroxide. In eq 6, kB is the rate constant for proton transfer to the zinc-bound hydroxide, and (Ka)His64 and (Ka)ZnH2O are the ionization constants of the proton donor and zinc-bound water molecule.
| (6) |
Here RH2O0 is a pH independent contribution introduced to provide a fit to data showing a plateau in kBobs at pH > 8. Fits of eqs 5 and 6 to the data were carried out using Enzfitter (Biosoft).
The rate constants kB are presented in a free energy plot and fitted by the Marcus theory for proton transfer [24] as applied to catalysis by carbonic anhydrase as described in earlier work [25, 26]. The observed activation barriers are obtained from the pH independent, maximal values kB, as in ΔG‡obs = −RTln(hkB/kT), where h is the Planck constant and k is the Boltzmann constant. The observed free energy of reaction is obtained from ΔpKa of the reactants, ΔGo = RTln[(Ka)acceptor/(Ka)donor]. In the Marcus approach, the observed overall activation energy for proton transfer ΔG‡obs is described in terms of the standard free energy of reaction ΔGo and an intrinsic kinetic barrier ΔG‡o. This approach is further modified to describe proton transfers in which there is a component of the observed activation barrier that does not depend on ΔGo for the reaction. This component is called the work term wr for the forward direction (dehydration here) and wp for the reverse. The Marcus equation then becomes:
| (7) |
The catalyzed and uncatalyzed exchanges of 18O between CO2 and water at chemical equilibrium were measured in the absence of buffer at a total substrate concentration of 25 mM of all species of CO2 using membrane-inlet mass spectrometry. The temperature was 25 °C and the total ionic strength of solution was kept at a minimum of 0.2 M by the addition of Na2SO4. The stability of these enzymes made it necessary to work with fresh samples and keep them on ice. The kinetics on HCA II Y7F were reported earlier [8].
The hydrolysis of 4-nitrophenylacetate uncatalyzed and catalyzed by variants of CA were measured by the method of Verpoorte et al. [27]. Initial velocities were measured using a Beckman Coulter DU 800 spectrophotometer. The pH profiles of kcat/KM were fit to a single ionization with a maximum at high pH using Enzfitter (Biosoft).
Differential scanning calorimetry (DSC)
DSC experiments were performed using a VP-DSC calorimeter (Microcal, Inc., North Hampton, MA) with a cell volume of ~0.5 ml. Variants of HCA II were buffered in 50 mM Tris-Cl, pH 8.0 at protein concentrations of 50 µM. DSC scans were collected from 30 to 90 °C with a scan rate of 60 °C/hr. The calorimetric enthalpies (ΔH °m) of unfolding were calculated by integrating the area under the peaks in the thermograms after adjusting the pre- and post-transition baselines. The thermograms were fit to a two state reversible unfolding model to obtain van’t Hoff enthalpies (ΔHvH) of unfolding [28].
Crystallization and X-ray data collection
Crystals of the Y7I HCA II mutant were obtained using the hanging drop method [29]. The crystallization drops were prepared by mixing 5 µL of protein (concentration ~10 mg/mL in 10 mM Tris-Cl (pH 8.0)) with 5 µL of the precipitant solution (1.7 M sodium citrate 100 mM Tris-Cl (pH 8.0)) against a well of 1 mL precipitant solution. A few crystals were observed approximately one month after the crystallization setup at 293 K.
The X-ray diffraction data collection of a Y7I HCA II crystal was obtained at room temperature using an R-AXIS IV++ image plate system with Osmic mirrors and a Rigaku HU-H3R Cu rotating anode operating at 50 kV and 100 mA. The detector-to-crystal distance was set to 100 mm and data were collected using oscillation steps of 1° with a 7 minute exposure per image. The data were processed and scaled using HKL2000 [30].
The crystal structure of HCA II (PDB accession code: 2ILI) (5) was used to obtain initial phases for the structure determination using SHELX97 (28). The zinc and all solvent molecules were removed to avoid model bias. 5% of the unique reflections were selected randomly and excluded from the refinement data set for the purpose of Rfree calculations (29). Structural refinement used SHELXL initially with data from 50.0 to 1.5 Å resolution. The protein geometry was defined using the default constrains of conjugate-least squares (CGLS) mode in SHELXL. Each round of CGLS comprised of 15 cycles of refinement. 2Fo–Fc and Fo–Fc electron density Fourier difference maps were calculated after each successive round of CGLS and manually inspected by the graphics program COOT (30) for further fine-tuning of the model and the incorporation of solvent molecules.
RESULTS
Catalysis
The site-specific mutants of HCA II in Table 1 were investigated for their catalytic properties using membrane inlet mass spectrometry measuring the rate of exchange of 18O between CO2 and water. The efficiency of the catalyzed hydration of CO2 was measured as the rate constant kcatexch/KeffCO2 (eq 5) over a pH range of 5.0 to 9.0. The pH profiles for kcatexch/KeffCO2 by the mutants under study were adequately fit to a single ionization and appeared similar to that of the wild type (Figure 2, Supplementary Data, Figures S1, S2). The resulting maximal values of kcatexch/KeffCO2 represent catalytic activity in the hydration direction and were essentially identical to that of wild type (Table 1). The variation was greater for the activities kcat/Km for the catalyzed hydrolysis of p-nitrophenylacetate (Table 1). This probably reflects the larger size of the substrate for the ester hydrolysis which is influenced more by amino acid changes at position 7. The resulting values of pKa ZnH2O representing the ionization of the zinc-bound water for each mutant are listed in Table 2. The data demonstrate that the values of pKaZnH2O of the zinc-bound water are near 7 for wild type and mutants. These pKa ZnH2O values were determined both by measurement of esterase activity and 18O exchange (Table 2).
Table 1.
Maximal Values of Rate Constants for Hydration of CO2, Hydrolysis of 4-Nitrophenylacetate, and Proton Transfer in Dehydration Catalyzed by HCA II and Variants.a
| Enzyme |
kcatexch/KeffCO2 CO2 hydration (µM−1s−1) b |
kcat/Km esterase (M−1s−1) c |
kB proton transfer (µs−1) d |
|---|---|---|---|
| wild type | 120 | 2800 | 0.8 ± 0.1 |
| Y7I | 130 | 2400 | 2.3 ± 0.2 |
| Y7A | 140 | 2300 | 0.8 ± 0.3 |
| Y7W | 140 | 1700 | 1.8 ± 0.1 |
| Y7F e | 120 | 4400 | 7 ± 0.2 |
| Y7D | 130 | 1800 | 0.8 ± 0.1 f |
| Y7N | 100 | 1200 | 2.5 ± 0.1 f |
| Y7R | 120 | 1700 | 1.5 ± 0.1 |
| Y7S | 100 | 1600 | 1.0 ± 0.1 |
Derived from the kinetic curves for each substitution by a fit of to the data of Figures 2,3 and Supporting Information Figures S1–S4. All data were obtained at 25°C.
Measured from the exchange of 18O between CO2 and water using eq 5 in the hydration direction. Standard errors here were less than 10%.
Measured from the fit of the rate constants for ester hydrolysis to a single ionization. Standard errors here were less than 10%.
Measured from the exchange of 18O between CO2 and water using eq 6 in the dehydration direction.
Data are from Fisher et al. [8].
These are maximal values of RH2O/[E] since incomplete pH profiles (Figures S3, S4) did not allow an adequate determination of kB by a fit of eq 6.
Figure 2.
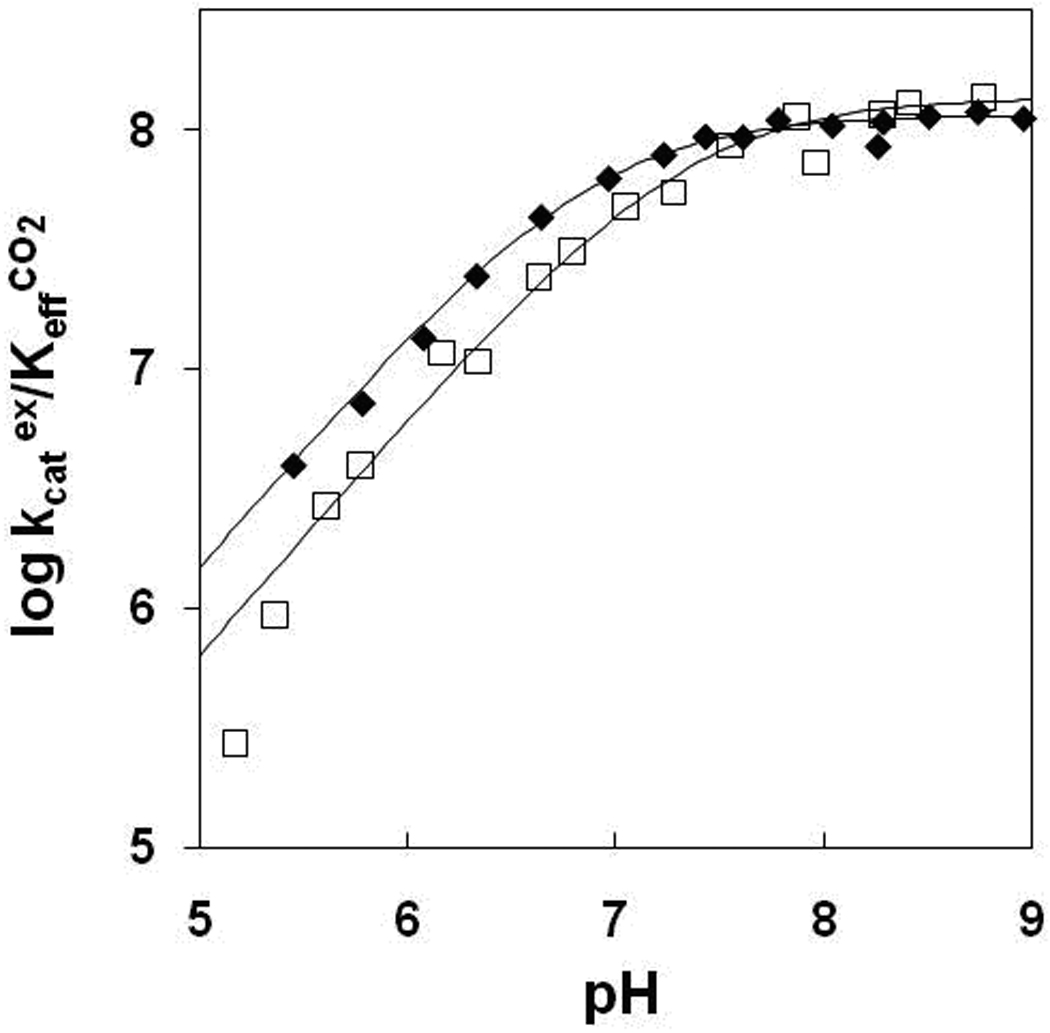
The pH profiles for kcatex/KeffCO2 (M−1s−1) for the hydration of CO2 catalyzed by ( ) wild-type HCA II; and (□) Y7I HCA II. Data were obtained by 18O exchange between CO2 and water using solutions at 25 °C containing 25 mM of all species of CO2 and sufficient Na2SO4 to maintain 0.2 M ionic strength.
Table 2.
Values of Apparent pKa Obtained by Various Kinetic Measurements of Catalysis by HCA II and Mutants
| Enzyme | pKa His64a (eq 6) |
pKa ZnH2Oa (eq 6) |
pKa ZnH2Ob (from kcatexch/KeffCO2) |
pKa ZnH2O (esterase) |
|---|---|---|---|---|
| wild type | 7.2 ± 0.1 | 6.8 ± 0.1 | 6.9 ± 0.1 | 6.9 ± 0.1 |
| Y7I | 6.2 ± 0.1 | 6.8 ± 0.1 | 7.1 ± 0.1 | 6.9 ± 0.1 |
| Y7A | 6.4 ± 0.2 | 6.4 ± 0.3 | 7.0 ± 0.1 | 7.2 ± 0.1 |
| Y7W | 6.9 ± 0.2 | 7.0 ± 0.3 | 7.2 ± 0.1 | 7.0 ± 0.1 |
| Y7F c | 6.0 ± 0.2c | 7.0 ± 0.2c | 7.1 ± 0.3c | 7.0 ± 0.1 |
| Y7D | -- d | -- d | 6.4 ± 0.1 | 6.6 ± 0.2 |
| Y7N | 5.8 ± 0.1 | 6.4 ± 0.1 | 6.8 ± 0.1 | 6.4 ± 0.1 |
| Y7R | 6.2 ± 0.1 | 6.2 ± 0.1 | 7.4 ± 0.1 | 7.1 ± 0.1 |
| Y7S | 6.4 ± 0.1 | 6.4 ± 0.3 | 7.0 ± 0.1 | 6.9 ± 0.1 |
The pH profiles of the rate constant RH2O/[E] (Figures 3, S3, S4) provide three constants relevant to the catalysis, according to eq 6. The first is an estimate of pKa ZnH2O, values which are given in Table 2 and generally are consistent with the values described in the above paragraph. Exceptions are Y7A, Y7S, and Y7R (Table 2; Figures S3,S4). These differences may be due to different properties of the active site for the processes of eq 3 and eq 4, or possibly difficulty interpreting the irregular curves for RH2O during catalysis by Y7A and Y7S (Figures S3,S4). The pH profile for RH2O/[E] in catalysis by Y7D did not have sufficient bell shape to assign values of pKa. In later construction of a free energy plot, we have used data only from RH2O.
Figure 3.
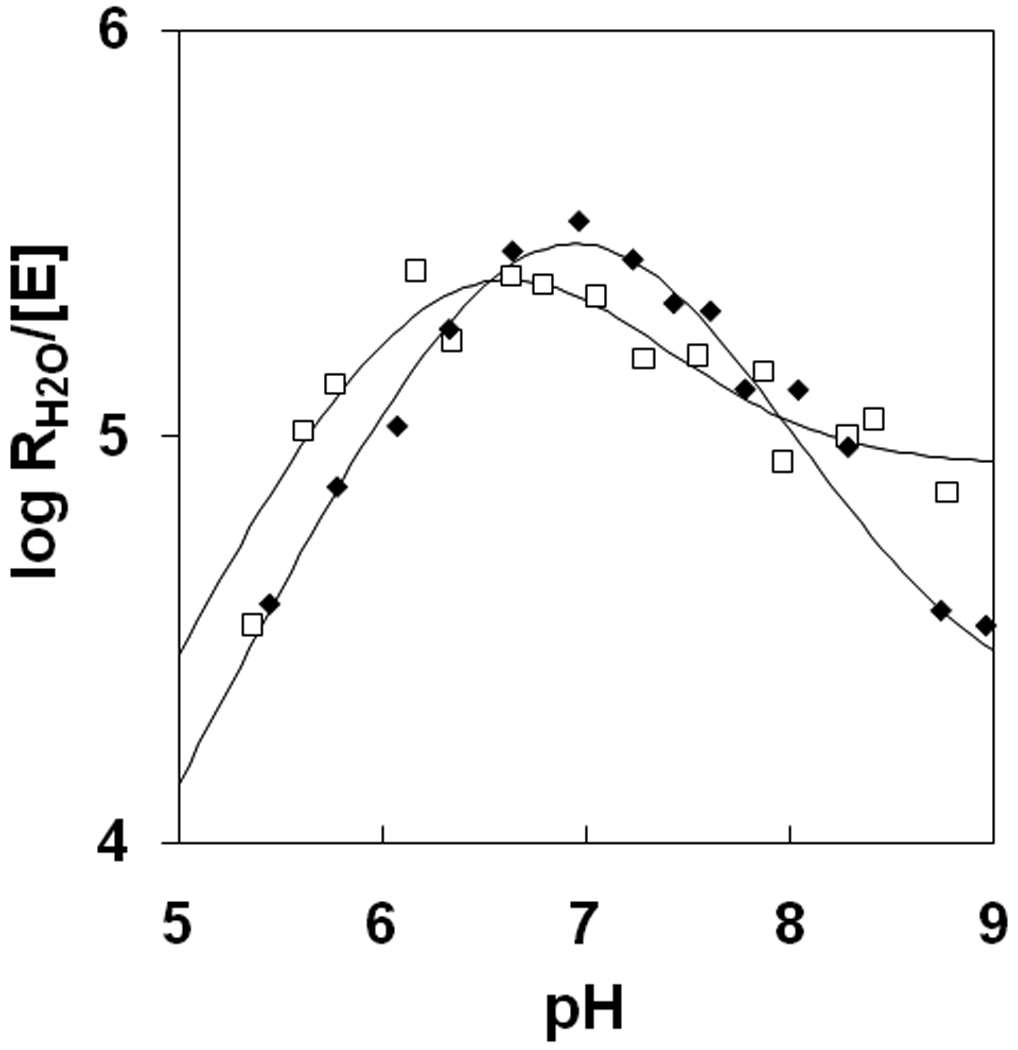
The pH profiles for RH2O/[E] (s−1) the proton-transfer dependent rate of release of 18O-labeled water catalyzed ( ) wild-type HCA II; and (□) Y7I HCA II. Conditions were as described in Figure 2.
The second constant is a value of pKa His64 (Table 2). These values are uniformly lower for replacements at residue 7 than the value of pKa His64 at 7.2 in wild type HCA II (Table 2). Such a shift in pKa His64 is associated with the inward coordination of the side chain of His 64 [8, 14] and its more hydrophobic environment than in wild type HCA II in which this side chain appears about equally in inward and outward orientations [4, 5]. The third constant is the maximal, pH-independent value of kB describing intramolecular proton transfer in the dehydration direction obtained by a fit to eq 6 to the pH profiles for RH2O/[E] (Table 1; Figures 3, S3, S4). The pH profiles for RH2O, from which kB values were obtained, were more difficult to fit for Y7D and Y7N than the bell curve of wild type HCA II and other variants. The data for Y7I were consistent with a value of kB of 2.3 µs−1 from a fit of Figure 3. The greatest change in kB among these variants was found for Y7F with a value of 7 µs−1 (Table 1).
Structure of Y7I HCA II
Crystals of Y7I HCA II were well ordered and diffracted X-rays to 1.5 Å resolution. Refinement and final model statistics are given in Table 3. The structures of Y7I and Y7F HCA II are similar to wild type in that the residues coordinating the zinc and those in the active site cavity (with the exception of residue seven) are unchanged (Figures 1, 4). Moreover, both show His64 predominantly in the inward orientation (Figure 4). A least-squares superposition of the crystal structure of Y7I onto wild-type HCA II (PDB ID: 2ILI [5]) yielded an average RMSD of 0.30 Å. However, the structure of Y7I HCAII showed several interesting features not present in the structures of wild type or of Y7F HCA II reported earlier [8]. Most notably there was a novel conformation of residues 4 to 11 of the N-terminal chain (Figure 5); the amino-terminal residues 1–4 were not observed in the crystal structure presumably because of disorder. This N-terminal conformation in Y7I HCA II caused the side chain of Ile7 to point away from the metal in the active site; the side chain of Ile7 does not occupy a position analogous to the side chain of Tyr7 in wild type, which lies between Thr200 and His64 (Figure 4). Despite the differences in structure of the N-terminal residues of Y7I and wild type, the geometry of the residues coordinating the zinc and the active site solvent structures were not altered (Figures 1,4).
Table 3 .
Crystal Structure Data and Refinement Statistics for Y7I HCA II
| Data-collection statistics | |
| Temperature (K) | 100 |
| Wavelength (Å) | 0.9724 |
| Space group | P 21 |
| Unit-cell parameters (Å,°) |
a = 42.8, b = 41.6, c = 73.2, β =104.9 |
| Total number of reflections Total number of unique reflections |
507927 (43272)* 38859 (3606) * |
| Resolution (Å) aRsym I/σ(I) |
20.0-1.5 (1.55-1.5) * 9.9 (41.7) * 23.4 (3.5) * |
|
bRcryst(%) cRfree(%) |
16.6 21.1 |
| Amino acide residues | 4–261 |
| No. of protein atoms | 2059 |
| No. of H2O molecules | 186 |
| R.m.s.d. for bond lengths (Å), angles (°) | 0.007, 1.1 |
| Ramachandran statistics (%) Most favored, additionally allowed and generously allowed regions | 88.4, 11.1, 0.5 |
| Average B factors (Å2) main-, side-chain, Zn, solvent | 17.3, 22.7, 11.7, 30.2 |
Rsym = Σ |I - <I>|/ Σ <I>.
Rcryst = (Σ |Fo| - |Fc|/ Σ |Fobs| ) × 100.
Rfree is calculated in same manner as bRcryst, except that it uses 5% of the reflection data omitted from refinement.
Values in parenthesis represent highest resolution bin.
Figure 4.
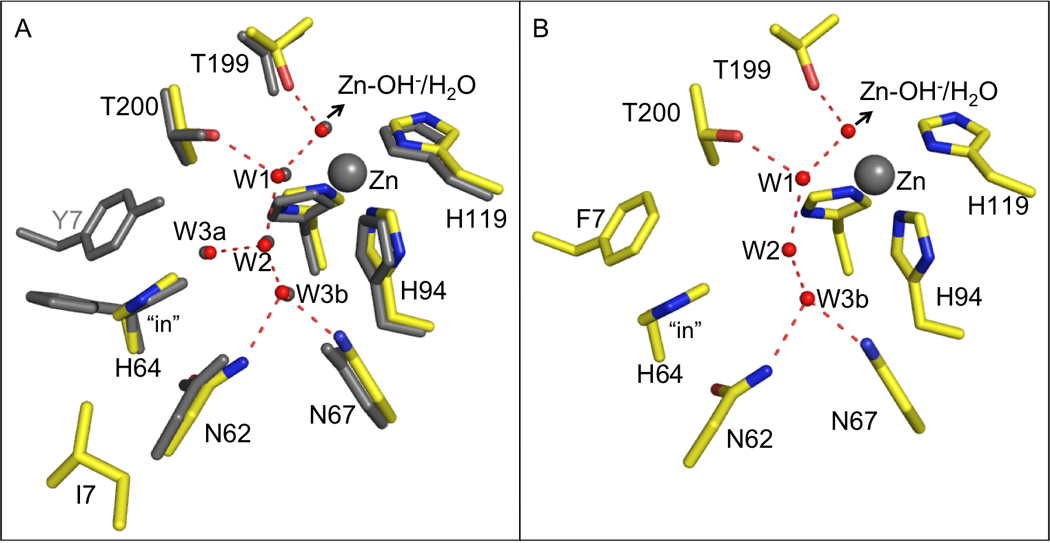
Crystal structures of the active sites of (A) Y7I HCA II superimposed on wild-type HCA II which is shown in gray; and (B) Y7F HCA II from Fisher et al. [8]
Figure 5.
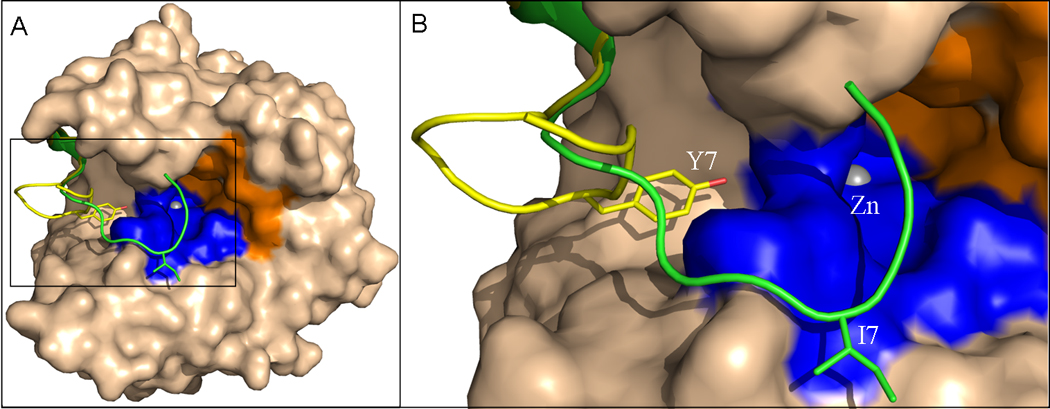
Overall (A) and N-terminus (B) of superimposed crystal structures of wild-type HCA II and Y7I HCA II. The superimposed enzyme except the N-terminus is represented as a surface. The N-terminus of (yellow) wild type; and (green) Y7I HCA II is represented as ribbon, while the respective amino acids at position 7 as sticks. The hydrophobic and hydrophilic regions of the active-site are rendered orange and blue respectively. The active site zinc is depicted as a gray sphere.
Thermal Stability
The thermal stability of HCA II mutants was determined by differential scanning calorimetry (DSC). A single peak representing the main unfolding transition was observed for all of the variants of Table 1 and is shown for wild type, Y7I and Y7F HCA II in Figure 6. The fit to these data was based on a two state, reversible unfolding model to obtain the thermodynamic parameters. The main unfolding transition of the wild-type enzyme Tm occurred at 59.5 ± 0.5 °C and that of Y7I occurred at 51.8 ± 0.5 °C. The values of Tm for each of the remaining variants of Table 1 were between 49.3 and 52.5 °C except Y7F which had a distinctly broad transition with a Tm of 55.8 ± 0.5 °C (Figure 6). The calorimeteric parameters determined from the DSC experiments and the calculated thermodynamic parameters for all the HCA II mutants examined are listed in Table S1.
Figure 6.
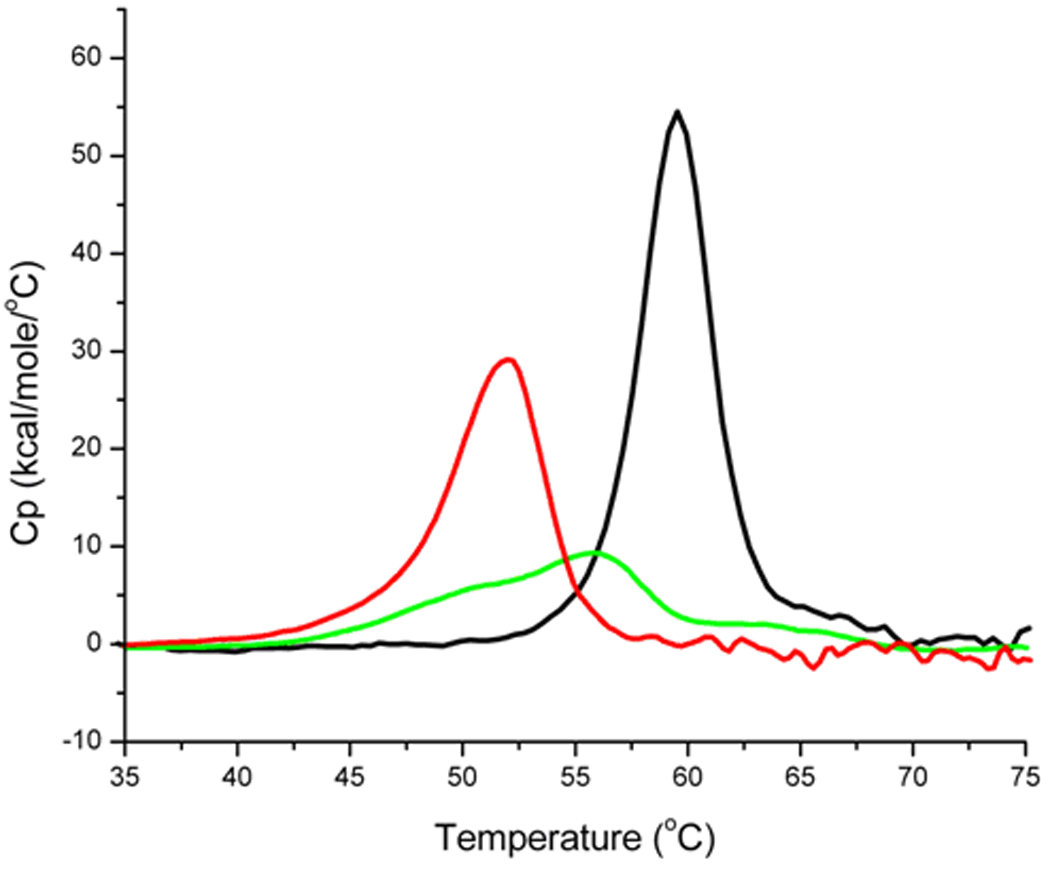
Differential scanning calorimetry profiles of apparent excess specific heat (Cp) vs temperature for (red) Y7I HCA II; (green) Y7F HCA II and (black) wild-type HCA II.
DISCUSSION
A notable result of this study of variants at residue 7 of HCA II is that the rate constants kcatexch/KeffCO2 for the first stage of catalysis (eqs 1, 3; Table 1) are unchanged. The substitutions of Tyr7 in wild type did not affect the ability of the protein to carry out the first stage of the catalysis. This appears to be a result of the amino acid substitutions being at least 7Å away from the zinc where the interconversion between CO2 and bicarbonate occurs. However, among the variants of Table 1, there is range of increases and no decreases in the rate constants kB for proton transfer from His64 to the zinc-bound hydroxide in the dehydration direction. The neutron diffraction structure of HCA II at pH 9.0 shows residue 7 as a tyrosinate ion [9]; the appearance of such an ion apparently has little influence on proton transfer since it can be replaced with a nonionic residue (Y7A) with no effect. In addition, the replacement of residue 7 caused decreases in thermal stability by up to 8 °C, and the single replacement of Tyr7 with Ile caused a major alteration in the conformation of the N-terminal chain in the Y7I structure (Figure 5). The amino terminal 11 residues were displaced with respect to their conformation in wild type with the side chain of Ile7 pointing away from the active site, different than for Tyr7 in wild type. The rate constant for proton transfer for Y7I HCA II was enhanced nearly 3-fold compared with wild type (Table 1).
Despite the large changes in the N-terminal region of Y7I HCA II, the structure of its active site is remarkably similar to that of the wild type enzyme including the network of ordered water molecules (Figures 1, 4), unlike Y7F HCAII in which water molecule W3a is not observed. In the crystal lattice, Ile 7 of Y7I rests in one of the crystal contact regions. Its amide nitrogen forms a hydrogen bond with the carboxyl side chain of Glu 238 and its side chain is in hydrophobic contact with Leu 240 (Figure S5). These interacting amino-acids are located in a single crystal-contact patch. It is possible that the altered orientation of the N-terminus of Y7I HCA II is a consequence of crystal contacts. It is interesting to note however, that this mutant crystallizes in the same space group as the wild type enzyme. After repeated attempts to crystallize other mutants listed in Table 1, only Y7I and Y7F HCA II have been successful. It is possible that mutations at Try 7 produce a disordered (or alternate) N-terminal conformation giving rise to structural heterogeneity in the samples, which is likely to deter crystal growth. Truncation of as many as 24 residues of the N-terminal end of HCA II does not prevent the remaining protein from folding correctly, and the structure of the N-terminus has been shown to form very late in folding [31].
A comparison of the characteristics of Y7I and Y7F HCA II reveals that they both have His64 in the inward orientation, both have values of ΔpKa (pKa ZnH2O – pKa His64) near 1.0, and both have nearly identical values of kcatexch/KeffCO2. However, they differ in their values of kB, the rate constant for proton transfer in the dehydration direction, as shown in Table 1. This difference is shown in a free energy plot based on kB in Figure 7. The open circles are rate constants for proton transfer during catalysis by H64A HCA II determined by enhancement of catalysis when proton donors are exogenous derivatives of imidazole and pyridine [13]. These data are fit by Marcus theory applied to proton transfer (eq 7)[26, 32], represented by the solid line of Figure 7. We assume this line represents the dependence of kB on ΔpKa within the active site. The significance of this fit is that these values of kB are for proton transfer from donors not attached to the enzyme through chemical bonds, free of many restraints. Interestingly, the values of kB for wild type HCA II and nearly all of the variants of Table 1, except Y7F HCA II, fall on or near this Marcus line (Figure 7).
Figure 7.
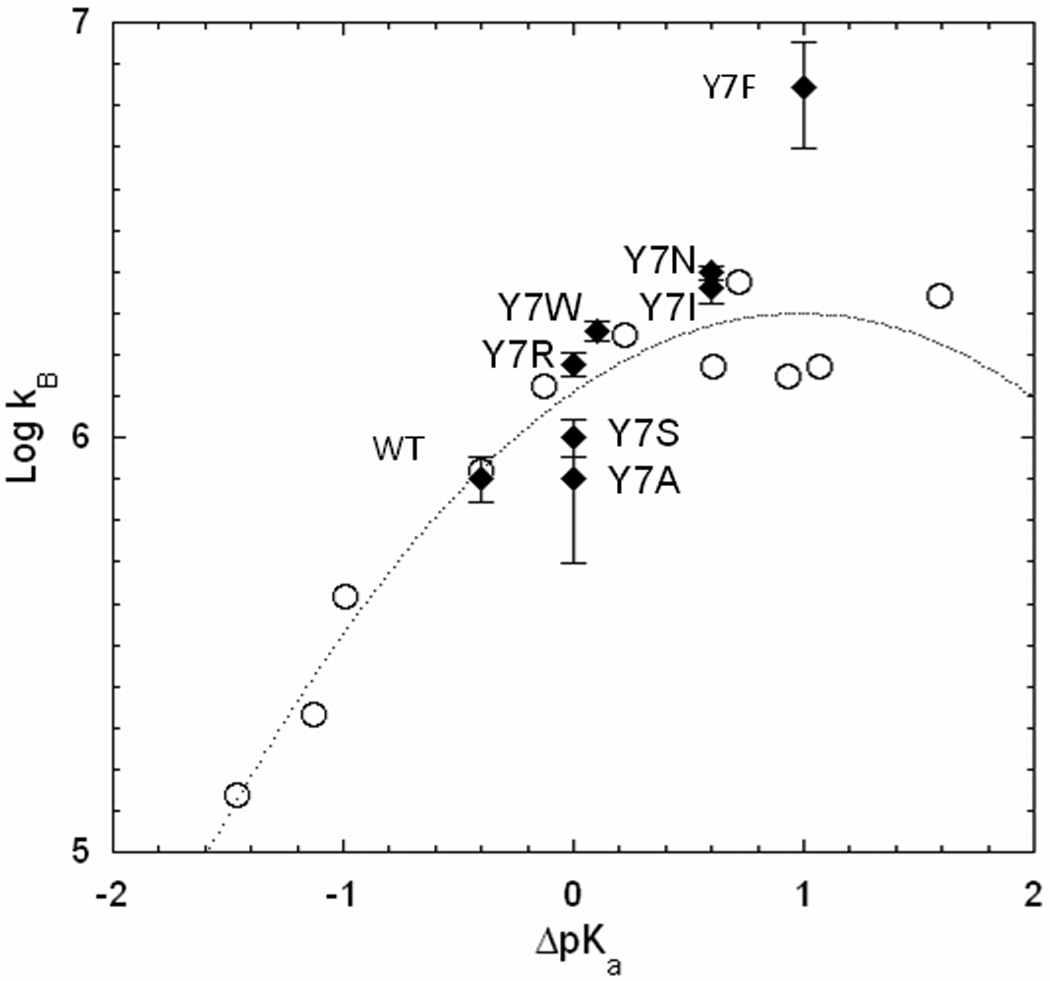
Free energy plot of the logarithm of the rate constant for proton transfer kB (s−1) versus ΔpKa (pKa ZnH2O – pKa His64) determined from the RH2O/[E] pH profiles for the wild type and the mutants of HCA II containing replacements of Tyr 7 identified on the plot (♦ filled symbols); and (○) for H64A HCA II from An et al. [13] with proton transfer provided predominantly by derivatives of imidazole and pyridine acting as exogenous proton donors with the solid line a best fit of Marcus Rate Theory.
We suggest that the reason the value of kB for Y7F lies considerably above the Marcus line of Figure 7 while Y7I and other mutants lie closer to the line is the abbreviated water structure of Y7F. A significant difference is that Y7F has an unbranched, hydrogen-bonded water structure in the active site cavity (Figures 1, 4) compared to the wild type and Y7I enzyme. In solution these water structures have a lifetime in the picosecond range; however, the ordered water in the crystal structures provides a clue to the more stable water structures in catalysis. Computational studies of the proton transfer step in catalysis by carbonic anhydrase show that water wires consisting of fewer molecules transfer protons more efficiently [33, 34]. Wild-type HCA II and Y7I have an identical water structure in the active-site cavity with a branched cluster of four ordered water molecules between His64 and the zinc bound water (Figures 1, 4). In contrast, Y7F has a smaller, unbranched cluster of three water molecules that is more stable and provides a proton transfer pathway of lower energy barrier than wild type [34]. This provides an explanation of why Y7I and wild type, as well as other mutants, lie on the line of Figure 7 but Y7F lies above it, other variables being equal.
It is interesting to speculate why Tyr7 is conserved when substitution can enhance the rate of maximal catalysis. Calorimetry showed that the replacements of Try7 in HCA II decreased the thermal stability of the protein by 7 – 10 °C, except for Y7F which was decreased about 4 °C (Table S1). This decrease indicates that Tyr 7 stabilizes the enzyme, although it is unclear how it does this since the side chain of Tyr 7 has no apparent interactions with other residues in the crystal structure. At any rate, this decreased stabilization may be a factor to explain the occurrence of Tyr7 in many of the carbonic anhydrases in the α class. Tyr7 also promotes folding of the N-terminal chain, which appears to have another role. A conserved N-terminus is consistent with this region of HCA II binding to the Cl−/bicarbonate anion exchange proteins (AE) [35]. Recent deletion and mutation studies have shown the numerous histidine residues (His3,His4, His10, His15 and His 17) found in the N-terminus of HCA II represent an acidic motif important for binding the C-terminus of AE1 and AE2 [35].
Supplementary Material
ACKNOWLEDGEMENT
This work was supported by a grant from the National Institutes of Health (GM 25154).
Footnotes
Publisher's Disclaimer: This is a PDF file of an unedited manuscript that has been accepted for publication. As a service to our customers we are providing this early version of the manuscript. The manuscript will undergo copyediting, typesetting, and review of the resulting proof before it is published in its final citable form. Please note that during the production process errors may be discovered which could affect the content, and all legal disclaimers that apply to the journal pertain.
SUPPLEMENTARY DATA
Supplementary data associated with this article can be found in the online version at ***
REFERENCES
- 1.Christianson DW, Fierke CA. Carbonic anhydrase: Evolution of the zinc binding site by nature and by design. Accounts of Chemical Research. 1996;29:331–339. [Google Scholar]
- 2.Lindskog S. Structure and mechanism of carbonic anhydrase. Pharmacol Ther. 1997;74:1–20. doi: 10.1016/s0163-7258(96)00198-2. [DOI] [PubMed] [Google Scholar]
- 3.Silverman DN, Lindskog S. The Catalytic Mechanism of Carbonic-Anhydrase - Implications of a Rate-Limiting Protolysis of Water. Accounts of Chemical Research. 1988;21:30–36. [Google Scholar]
- 4.Nair SK, Christianson DW. Unexpected pH-Dependent Conformation of His-64, the Proton Shuttle of Carbonic Anhydrase-II. Journal of the American Chemical Society. 1991;113:9455–9458. [Google Scholar]
- 5.Fisher SZ, Maupin CM, Budayova-Spano M, Govindasamy L, Tu C, Agbandje-McKenna M, Silverman DN, Voth GA, McKenna R. Atomic crystal and molecular dynamics simulation structures of human carbonic anhydrase II: Insights into the proton transfer mechanism. Biochemistry. 2007;46:2930–2937. doi: 10.1021/bi062066y. [DOI] [PubMed] [Google Scholar]
- 6.Tu CK, Silverman DN, Forsman C, Jonsson BH, Lindskog S. Role of histidine 64 in the catalytic mechanism of human carbonic anhydrase II studied with a site-specific mutant. Biochemistry. 1989;28:7913–7918. doi: 10.1021/bi00445a054. [DOI] [PubMed] [Google Scholar]
- 7.Steiner H, Jonsson BH, Lindskog S. Catalytic Mechanism of Carbonic-Anhydrase - Hydrogen-Isotope Effects on Kinetic-Parameters of Human C Isoenzyme. European Journal of Biochemistry. 1975;59:253–259. doi: 10.1111/j.1432-1033.1975.tb02449.x. [DOI] [PubMed] [Google Scholar]
- 8.Fisher SZ, Tu CK, Bhatt D, Govindasamy L, Agbandje-McKenna M, McKenna R, Silverman DN. Speeding up proton transfer in a fast enzyme: kinetic and crystallographic studies on the effect of hydrophobic amino acid substitution in the active site of human carbonic anhydrase II. Biochemistry. 2007;42:3803–3813. doi: 10.1021/bi602620k. [DOI] [PubMed] [Google Scholar]
- 9.Fisher SZ, Kovalevsky AY, Domsic JF, Mustyakimov M, McKenna R, Silverman DN, Langan PA. Neutron Structure of Human Carbonic Anhydrase II: Implications for Proton Transfer. Biochemistry. 2010;49:415–421. doi: 10.1021/bi901995n. [DOI] [PMC free article] [PubMed] [Google Scholar]
- 10.Liang ZW, Xue YF, Behravan G, Jonsson BH, Lindskog S. Importance of the Conserved Active-Site Residues Tyr7, Glu106 and Thr199 for the Catalytic Function of Human Carbonic Anhydrase-Ii. European Journal of Biochemistry. 1993;211:821–827. doi: 10.1111/j.1432-1033.1993.tb17614.x. [DOI] [PubMed] [Google Scholar]
- 11.Jackman JE, Merz KM, Jr, Fierke CA. Disruption of the active site solvent network in carbonic anhydrase II decreases the efficiency of proton transfer. Biochemistry. 1996;35:16421–16428. doi: 10.1021/bi961786+. [DOI] [PubMed] [Google Scholar]
- 12.Krebs JF, Ippolito JA, Christianson DW, Fierke CA. Structural and Functional Importance of a Conserved Hydrogen-Bond Network in Human Carbonic Anhydrase-Ii. Journal of Biological Chemistry. 1993;268:27458–27466. [PubMed] [Google Scholar]
- 13.An H, Tu C, Duda D, Montanez-Clemente I, Math K, Laipis PJ, McKenna R, Silverman DN. Chemical rescue in catalysis by human carbonic anhydrases II and III. Biochemistry. 2002;41:3235–3242. doi: 10.1021/bi0120695. [DOI] [PubMed] [Google Scholar]
- 14.Zheng JY, Avvaru BS, Tu C, McKenna R, Silverman DN. Role of Hydrophilic Residues in Proton Transfer during Catalysis by Human Carbonic Anhydrase II. Biochemistry. 2008;47:12028–12036. doi: 10.1021/bi801473w. [DOI] [PMC free article] [PubMed] [Google Scholar]
- 15.Maupin CM, Voth GA. Proton transport in carbonic anhydrase: Insights from molecular simulation. Biochimica Et Biophysica Acta-Proteins and Proteomics. 2010;1804:332–341. doi: 10.1016/j.bbapap.2009.09.006. [DOI] [PMC free article] [PubMed] [Google Scholar]
- 16.Maupin CM, McKenna R, Silverman DN, Voth GA. Elucidation of the Proton Transport Mechanism in Human Carbonic Anhydrase II. Journal of the American Chemical Society. 2009;13:7598–7608. doi: 10.1021/ja8091938. [DOI] [PMC free article] [PubMed] [Google Scholar]
- 17.Riccardi D, Konig P, Guo H, Cui Q. Proton transfer in carbonic anhydrase is controlled by electrostatics rather than the orientation of the acceptor. Biochemistry. 2008;47:2369–2378. doi: 10.1021/bi701950j. [DOI] [PubMed] [Google Scholar]
- 18.Braun-Sand S, Strajbl M, Warshel A. Studies of proton translocations in biological systems: simulating proton transport in carbonic anhydrase by EVB-based models. Biophys J. 2004;87:2221–2239. doi: 10.1529/biophysj.104.043257. [DOI] [PMC free article] [PubMed] [Google Scholar]
- 19.Hewett-Emmett D, Tashian RE. Functional diversity, conservation, and convergence in the evolution of the alpha-, beta-, and gamma-carbonic anhydrase gene families. Molecular Phylogenetics and Evolution. 1996;5:50–77. doi: 10.1006/mpev.1996.0006. [DOI] [PubMed] [Google Scholar]
- 20.Khalifah RG, Strader DJ, Bryant SH, Gibson SM. C-13 Nuclear Magnetic-Resonance Probe of Active-Site Ionizations in Human Carbonic-Anhydrase B. Biochemistry. 1977;16:2241–2247. doi: 10.1021/bi00629a031. [DOI] [PubMed] [Google Scholar]
- 21.Silverman DN. Carbonic anhydrase: oxygen-18 exchange catalyzed by an enzyme with rate-contributing proton-transfer steps. Methods Enzymol. 1982;87:732–752. doi: 10.1016/s0076-6879(82)87037-7. [DOI] [PubMed] [Google Scholar]
- 22.Tu CK, Swenson ER, Silverman DN. Membrane inlet for mass spectrometric measurement of nitric oxide. Free Radical Biology and Medicine. 2007;43:1453–1457. doi: 10.1016/j.freeradbiomed.2007.07.026. [DOI] [PubMed] [Google Scholar]
- 23.Simonsson I, Jonsson BH, Lindskog S. C-13 NMR study of carbon dioxide-bicarbonate exchange catalyzed by human carbonic anhydrase-C at chemical-equilibrium. European Journal of Biochemistry. 1979;93:409–417. doi: 10.1111/j.1432-1033.1979.tb12837.x. [DOI] [PubMed] [Google Scholar]
- 24.Marcus RA. Theoretical Relations among Rate Constants Barriers and Bronsted Slopes of Chemical Reactions. Journal of Physical Chemistry. 1968;72 891-&. [Google Scholar]
- 25.Silverman DN, Tu C, Chen X, Tanhauser SM, Kresge AJ, Laipis PJ. Rate-equilibria relationships in intramolecular proton transfer in human carbonic anhydrase III. Biochemistry. 1993;32:10757–10762. doi: 10.1021/bi00091a029. [DOI] [PubMed] [Google Scholar]
- 26.Kresge AJ, Silverman DN. Application of Marcus rate theory to proton transfer in enzyme-catalyzed reactions. Methods in Enzymology. 1999;308:276–297. doi: 10.1016/s0076-6879(99)08014-3. [DOI] [PubMed] [Google Scholar]
- 27.Verpoorte JA, Mehta S, Edsall JT. Esterase Activities of Human Carbonic Anhydrases B and C. Journal of Biological Chemistry. 1967;242:4221–4229. [PubMed] [Google Scholar]
- 28.Bruylants G, Wouters J, Michaux C. Differential scanning calorimetry in life science: Thermodynamics, stability, molecular recognition and application in drug design. Current Medicinal Chemistry. 2005;12:2011–2020. doi: 10.2174/0929867054546564. [DOI] [PubMed] [Google Scholar]
- 29.McPherson A. Preparation and Analysis of Protein Crystals. New York: Wiley; 1982. [Google Scholar]
- 30.Otwinowski Z, Minor W. Processing of X-ray Diffraction Data Collected in Oscillation Mode. Methods Enzymol. 1997;276:307–326. doi: 10.1016/S0076-6879(97)76066-X. [DOI] [PubMed] [Google Scholar]
- 31.Aronsson G, Martensson LG, Carlsson U, Jonsson BH. Folding and Stability of the N-Terminus of Human Carbonic-Anhydrase-Ii. Biochemistry. 1995;34:2153–2162. doi: 10.1021/bi00007a008. [DOI] [PubMed] [Google Scholar]
- 32.Marcus RA. H and other transfers in enzymes and in solution: Theory and computations, a unified view. 2. Applications to experiment and computations. Journal of Physical Chemistry B. 2007;111:6643–6654. doi: 10.1021/jp071589s. [DOI] [PubMed] [Google Scholar]
- 33.Cui Q, Karplus M. Is a "proton wire" concerted or stepwise? A model study of proton transfer in carbonic anhydrase. Journal of Physical Chemistry B. 2003;107:1071–1078. [Google Scholar]
- 34.Maupin CM, Saunders MG, Thorpe IF, McKenna R, Silverman DN, Voth GA. Origins of enhanced proton transport in the Y7F mutant of human carbonic anhydrase II. Journal of the American Chemical Society. 2008;130:11399–11408. doi: 10.1021/ja802264j. [DOI] [PMC free article] [PubMed] [Google Scholar]
- 35.Vince JW, Carlsson U, Reithmeier RAF. Localization of the Cl-/HCO3- anion exchanger binding site to the amino-terminal region of carbonic anhydrase II. Biochemistry. 2000;39:13344–13349. doi: 10.1021/bi0015111. [DOI] [PubMed] [Google Scholar]
Associated Data
This section collects any data citations, data availability statements, or supplementary materials included in this article.


