Abstract
Upon binding to estrogens, the ERα nuclear receptor acts as a transcription factor and mediates a multitude of cellular functions central to health and disease. Herein, using isothermal titration calorimetry (ITC) and circular dichroism (CD) in conjunction with molecular modeling (MM), we analyze the effect of symmetric introduction of single nucleotide variations within each half-site of the estrogen response element (ERE) on the binding of ERα nuclear receptor. Our data reveal that ERα exudes remarkable tolerance and binds to all genetic variants in the physiologically relevant nanomolar-micromolar range with the consensus ERE motif affording the highest affinity. We provide rationale for how genetic variations within the ERE motif may reduce its affinity for ERα by orders of magnitude at atomic level. Our data also suggest that the introduction of genetic variations within the ERE motif allows it to sample a much greater conformational space. Surprisingly, ERα displays no preference for binding to ERE variants with higher AT content, implying that any advantage due to DNA plasticity may be largely compensated by unfavorable entropic factors. Collectively, our study bears important consequences for how genetic variations within DNA promoter elements may fine-tune the physiological action of ERα and other nuclear receptors.
Keywords: Nuclear receptors, Estrogen receptor α, Estrogen response element, Isothermal titration calorimetry, Circular dichroism, Molecular modeling
INTRODUCTION
Nuclear receptors (NRs) act as ligand-modulated transcription factors and orchestrate a plethora of cellular functions central to health and disease [1–4]. Some notable examples of ~50 members of the NR family are the androgen receptor (AR), estrogen receptor α (ERα), glucocorticoid receptor (GR) and progesterone receptor (PR). All members of the NR family are evolutionarily related and share a core modular architecture comprised of a central DNA-binding (DB) domain flanked between an N-terminal trans-activation (TA) domain and a C-terminal ligand-binding (LB) domain [5–7]. A typical scenario for the activation of nuclear receptors involves the secretion of lipophilic messengers such as hormones and vitamins by appropriate tissues. Upon their diffusion through the cell membrane, the binding of these ligands to the LB domain culminates in a series of events involving the translocation of nuclear receptors into the nucleus and subsequent modulation of expression of target genes [8–10]. While the DB domain recognizes specific promoter response elements within target genes, the LB domain additionally serves as a platform for the recruitment of a multitude of cellular proteins, such as transcription factors, co-activators and co-repressors, to the site of DNA transcription and thereby allowing nuclear receptors to exert their action at genomic level in a concerted fashion [11, 12]. While the trans-activation function of the LB domain is ligand-dependent, the TA domain operates in an autonomous manner and it is believed to be responsive to growth factors acting through the MAPK signaling and thus it may further synergize the action of various co-activators and co-repressors recruited by the LB domain at the site of DNA transcription [13, 14]. In this manner, nuclear receptors mediate a diverse array of cellular functions from embryonic development to metabolic homeostasis and their aberrant function has been widely implicated in disease [15–19, 7].
ERα mediates the action of estrogens such as estradiol and its hyperactivation leads to the genesis of large fractions of breast cancer [20–26]. The DB domain of ERα binds as a homodimer with a two-fold axis of symmetry to the ERE motif, containing the AGGTCAnnnTGACCT consensus sequence, located within the promoters of target genes [27]. DNA-binding is accomplished through a pair of tandem C4-type Zinc fingers, with each finger containing a Zn2+ ion coordinated in a tetrahedral arrangement by four highly conserved cysteine residues [28, 29]. It is important to note that the DB domain contains two Zinc fingers. The first Zinc finger (ZF-I) within each monomer of DB domain recognizes the hexanucleotide sequence 5′-AGGTCA-3′ within the major groove at each end of the ERE duplex, whilst the second Zinc finger (ZF-II) is responsible for the homodimerization of DB domain upon DNA binding.
Although nuclear receptors recognize the target genes in a DNA-sequence-dependent manner, genetic variations within specific promoter response elements are extremely common within the eukaryotic genomes [27]. Given that the nucleotide sequence is a key determinant of the ability of DNA to behave as a flexible polymer and undergo physical phenomena such as bending, stretching, deformation and distortion coupled with its ability to exist in various structural conformations (such as the B-DNA, A-DNA and Z-DNA) [30–32], our knowledge of how genetic variations within the promoter elements influence the ability of nuclear receptors to bind and subsequently affect gene transcription remains largely elusive. Several lines of evidence indeed suggest that genetic variations within the cognate response elements play a key role in modulating the affinity and specificity of binding of AR, GR and PR nuclear receptors [33–36]. In an effort to build on these earlier studies, we set out here to investigate how single nucleotide variations within the estrogen response element (ERE) affect the plasticity and energetics of binding of DNA to the ERα nuclear receptor.
MATERIALS and METHODS
Protein preparation
The DB domain (residues 176–250) of human ERα (Expasy# P03372) was cloned into pET101 bacterial expression vector with a C-terminal polyhistidine (His)-tag, to aid in protein purification through Ni-NTA affinity chromatography, using Invitrogen TOPO technology. The protein was subsequently expressed in Escherichia coli BL21*(DE3) bacterial strain (Invitrogen) and purified on a Ni-NTA affinity column using standard procedures. Briefly, bacterial cells were grown at 20°C in TB media supplemented with 50μM ZnCl2 to an optical density of 0.5 at 600nm prior to induction with 0.5mM isopropyl β-D-1-thiogalactopyranoside (IPTG). The bacterial culture was further grown overnight at 20°C and the cells were subsequently harvested and disrupted using a BeadBeater (Biospec). After separation of cell debris at high-speed centrifugation, the cell lysate was loaded onto a Ni-NTA column and washed extensively with 20mM imidazole to remove non-specific binding of bacterial proteins to the column. The recombinant protein was subsequently eluted with 200mM imidazole and dialyzed against an appropriate buffer to remove excess imidazole. Further treatment on a Hiload Superdex 200 size-exclusion chromatography (SEC) column coupled in-line with GE Akta FPLC system led to purification of recombinant DB domain to apparent homogeneity as judged by SDS-PAGE analysis. The identity of recombinant protein was confirmed by MALDI-TOF mass spectrometry. Final yield was typically between 5–10mg protein of apparent homogeneity per liter of bacterial culture. Protein concentration was determined by the fluorescence-based Quant-It assay (Invitrogen) and spectrophotometrically using an extinction coefficient of 14,940 M−1cm−1 calculated for the recombinant DB domain using the online software ProtParam at ExPasy Server [37]. Results from both methods were in an excellent agreement.
DNA synthesis
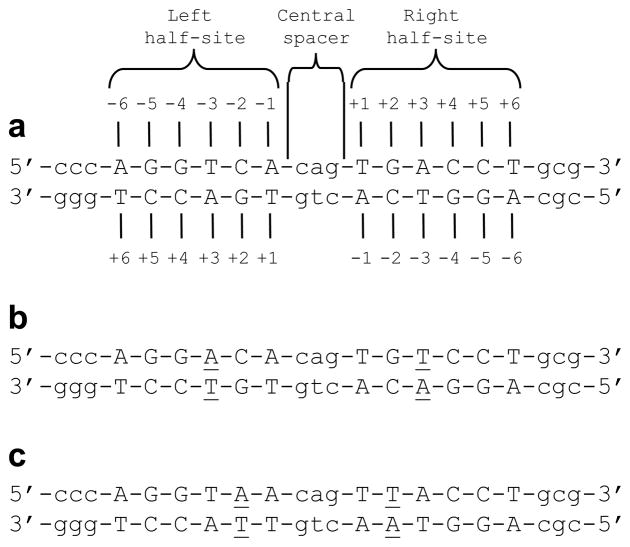
21-mer DNA oligos containing the consensus ERE motif (AGGTCAnnnTGACCT) and all possible symmetric single nucleotide variants were commercially obtained from Sigma Genosys. The design of such oligos and their numbering relative to the central 3-bp spacer is illustrated in Figure 1. Oligo concentrations were determined spectrophotometrically on the basis of their extinction co-efficients derived from their nucleotide sequences using the online software OligoAnalyzer 3.0 (Integrated DNA Technologies) based on the nearest-neighbor model [38]. Double-stranded DNA (dsDNA) oligos were generated as described earlier [39].
Figure 1.
Nucleotide sequence of dsDNA oligos. (a) Consensus ERE motif. The AGGTCA and TGACCT half-sites are clearly marked. The consensus nucleotides within each half-site are capitalized whilst the flanking nucleotides and the intervening nucleotides within the central spacer are shown in small letters. The numbering of various nucleotides within each half-site relative to the CAG central spacer in the sense (upper) and antisense (lower) strands are indicated. (b) Am3Tp3 motif, wherein adenine and thymine are respectively substituted at −3 and +3 positions within the sense strand in a symmetric manner within each half-site. The variant nucleotides relative to the consensus ERE motif in both strands are underlined. (c) Am2Tp2 motif, wherein adenine and thymine are respectively substituted at −2 and +2 positions within the sense strand in a symmetric manner within each half-site. The variant nucleotides relative to the consensus ERE motif in both strands are underlined.
ITC measurements
Isothermal titration calorimetry (ITC) experiments were performed on a Microcal VP-ITC instrument and data were acquired and processed using fully automized features in Microcal ORIGIN software. All measurements were repeated at least three times. Briefly, protein and DNA samples were prepared in 50mM Sodium phosphate containing 5mM β-mercaptoethanol at pH 7.0 and de-gassed using the ThermoVac accessory for 5min. The experiments were initiated by injecting 25 × 10μl aliquots of 50–200μM of a dsDNA oligo containing the ERE motif, or a variant thereof, from the syringe into the calorimetric cell containing 1.8ml of 5–10μM of DB domain of ERα at 25°C. The change in thermal power as a function of each injection was automatically recorded using Microcal ORIGIN software and the raw data were further processed to yield binding isotherms of heat release per injection as a function of molar ratio of dsDNA oligo to dimer-equivalent DB domain. The heats of mixing and dilution were subtracted from the heat of binding per injection by carrying out a control experiment in which the same buffer in the calorimetric cell was titrated against the dsDNA oligo in an identical manner. Control experiments with scrambled dsDNA oligos generated similar thermal power to that obtained for the buffer alone, implying that there was no non-specific binding of DB domain to non-cognate DNA. To extract various thermodynamic parameters, the binding isotherms were iteratively fit to a built-in one-site model by non-linear least squares regression analysis using the ORIGIN software as described previously [40, 39].
CD analysis
Circular dichroism (CD) measurements were conducted on a Bio-Logic MOS450/SFM400 spectropolarimeter thermostatically controlled with a water bath at 25°C. All data were acquired and processed using the Biokine software. Briefly, experiments were conducted on a 20μM of dsDNA oligos containing the ERE motif, or a variant thereof, in 50mM Sodium phosphate at pH 7.0. All experiments were conducted in a quartz cuvette with a 2-mm pathlength in the wavelength range 190–310nm. Data were recorded with a slit bandwidth of 2nm at a scan rate of 3nm/min. Data were normalized against reference spectra to remove the contribution of buffer. The reference spectra were obtained in a similar manner on a 50mM Sodium phosphate at pH 7.0. Each data set represents an average of at least four scans acquired at 1nm intervals. Data were converted to molar ellipticity, [θ], as a function of wavelength (λ) of electromagnetic radiation using the equation:
where Δε is the observed ellipticity in mdeg, c is the dsDNA concentration in μM and l is the cuvette pathlength in cm.
Molecular modeling
Molecular modeling (MM) was employed to generate 3D atomic models of the DB domain of ERα in complex with dsDNA oligos containing the consensus ERE motif and the variant Am2Tp2 motif using the MODELLER software based on homology modeling [41]. In each case, the crystal structure of the DB domain of ERα in complex with a dsDNA oligo containing the ERE motif but with varying flanking sequences was used as a template (PDB# 1HCQ). Additionally, for the atomic model of DB domain in complex with the Am2Tp2 motif, hydrogen bonding distance restraints were added between appropriate pairs of atoms to allow base pairing between A-2 and T+2 within each half-site. For each motif, a total of 100 atomic models were calculated and the structures with the lowest energy, as judged by the MODELLER Objective Function, were selected for further analysis. The atomic models were rendered using RIBBONS [42].
RESULTS and DISCUSSION
ERα tolerates genetic variations within the ERE motif at the expense of reduced affinities
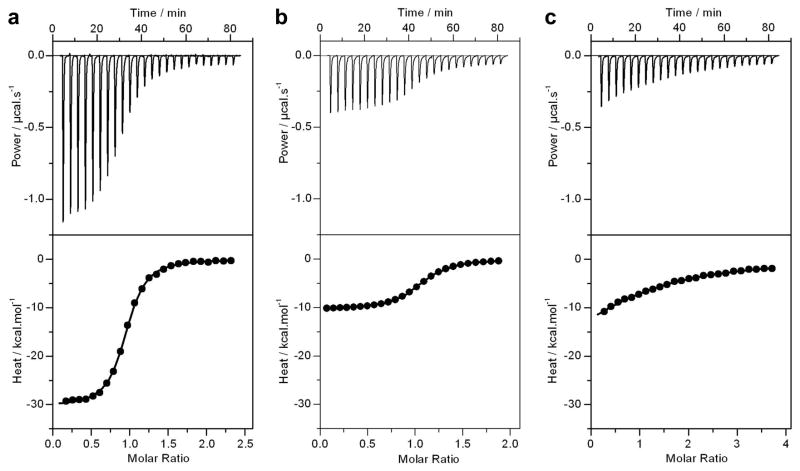
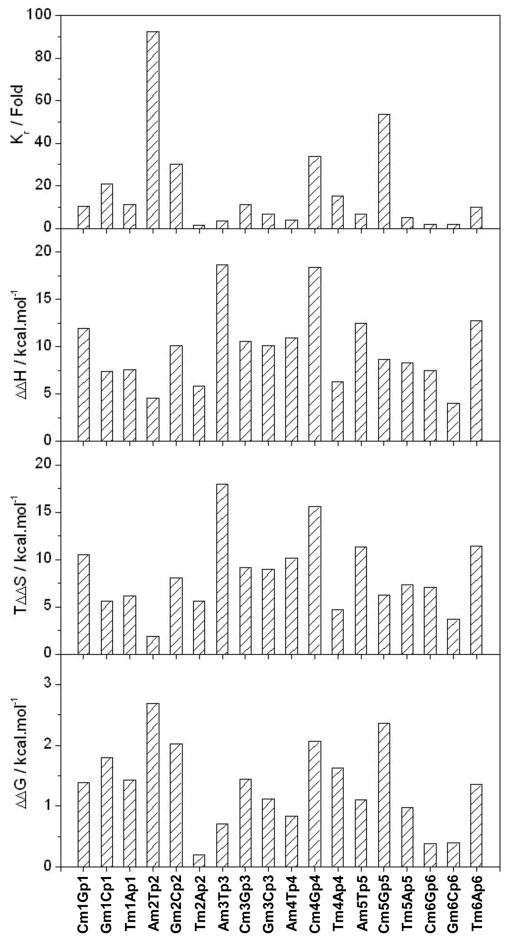
In order to assess the effect of genetic variations within the ERE motif on the binding of ERα, we analyzed the binding of DB domain of ERα to the consensus ERE motif and its genetic variants containing single nucleotide substitutions within each half-site in a symmetrical manner using ITC (Figure 2 and Table 1). Our analysis suggests that the DB domain not only tolerates such genetic variations but also binds in the physiologically relevant nanomolar-micromolar range, with the consensus ERE motif affording highest affinity. These findings are thus consistent with the knowledge that genetic variations within the estrogen-responsive genes can dramatically affect the affinity of ERα-DNA interactions [27]. Although these affinities vary over nearly two orders of magnitude, binding is universally driven by favorable enthalpic changes accompanied by unfavorable entropy. The favorable enthalpic changes observed here are consistent with the formation of an extensive network of hydrogen bonding and ion pairing of amino acid residues with the bases and backbone phosphates at the protein-DNA interface [29]. The unfavorable entropic changes most likely result from the loss of conformational degrees of freedom that both the protein and DNA experience upon complexation. Given that the DNA undergoes bending upon binding to the DB domain [43], the entropic penalty observed here may also in part be attributed to such physical distortion of DNA necessary for it to wrap around the protein so as to attain a close molecular fit. A comparative analysis of thermodynamic properties of variant motifs relative to the consensus ERE motif for binding to the DB domain reveals that the variant motifs exhibit remarkable thermodynamic versatility (Figure 3). Thus, while the binding of Am3Tp3 variant motif to the DB domain is only weaker by about three-fold relative to the consensus ERE motif, its underlying enthalpic and entropic contributions to the free energy are remarkably different. The much smaller entropic penalty incurred upon the binding of Am3Tp3 motif to the DB domain underscores how genetic variations within the ERE motif may dictate the underlying thermodynamics of protein-DNA interactions. On the other hand, the Am2Tp2 motif binds to the DB domain with an affinity that is nearly two orders of magnitude weaker relative to the ERE motif, yet both motifs share very similar underlying thermodynamic signatures. Taken together, our data presented above suggest strongly that genetic variations within the ERE motif modulate the energetics of binding of DB domain of ERα to DNA. Accordingly, genetic variations within the ERE motif at the promoters of target genes may play a key role in gauging the transcriptional output of ERα in response to estrogens. The genetic variations within the ERE motif may have thus evolved to provide a differential response to the expression of estrogen-responsive genes. Additionally, the genetic variations within the ERE motif may exert their effect by modulating the affinity of protein-DNA interactions through fine-tuning the contributions of the underlying thermodynamic forces to the free energy. In a related study from our laboratory, we demonstrated that genetic variations within the DNA response element of Jun-Fos heterodimeric transcription factor modulate its orientation [44]. Given that ERα also cooperates with ERβ in binding as a heterodimer to the promoters of target genes [45], it is conceivable that genetic variations within the ERE motif may also dictate the orientation of ERα-ERβ heterodimeric transcription factor. Such an orientation may in turn be an important determinant of the nature of other interacting cellular partners being recruited to the site of DNA transcription and thereby may play a key role in further modulating gene expression.
Figure 2.
Representative ITC isotherms for the binding of DB domain of ERα to dsDNA oligos containing the consensus ERE motif (a), the variant Am3Tp3 motif (b) and the variant Am2Tp2 motif (c). The upper panels show the raw ITC data expressed as change in thermal power with respect to time over the period of titration. In the lower panels, change in molar heat is expressed as a function of molar ratio of corresponding dsDNA oligos to dimer-equivalent DB domain. The solid lines in the lower panels represent the fit of data to a one-site model, based on the binding of a ligand to a macromolecule assuming the law of mass action, using the ORIGIN software [40, 39].
Table 1.
Thermodynamic parameters for the binding of DB domain of ERα to dsDNA oligos containing the consensus ERE (cERE) motif and single nucleotide symmetrical variants thereof obtained from ITC measurements
| Motif | Sequence | Kd/μM | ΔH/kcal.mol−1 | TΔS/kcal.mol−1 | ΔG/kcal.mol−1 | Gene promoter |
|---|---|---|---|---|---|---|
| cERE | AGGTCAcagTGACCT | 0.08 ± 0.01 | −30.15 ± 0.28 | −20.42 ± 0.23 | −9.73 ± 0.05 | Cell cycle kinase CDK5 |
| Cm1Gp1 | AGGTCCcagGGACCT | 0.79 ± 0.01 | −18.25 ± 0.25 | −9.91 ± 0.25 | −8.34 ± 0.01 | Signaling protein WISP2 |
| Gm1Cp1 | AGGTCGcagCGACCT | 1.58 ± 0.05 | −22.76 ± 0.28 | −14.83 ± 0.26 | −7.93 ± 0.02 | Hemoprotein CYP1B1 |
| Tm1Ap1 | AGGTCTcagAGACCT | 0.85 ± 0.06 | −22.59 ± 1.08 | −14.29 ± 1.08 | −8.30 ± 0.04 | Transctiption factor HNF3A |
| Am2Tp2 | AGGTAAcagTTACCT | 7.02 ± 0.04 | −25.57 ± 0.03 | −18.53 ± 0.03 | −7.04 ± 0.01 | Nuclear receptor ERα |
| Gm2Cp2 | AGGTGAcagTCACCT | 2.31 ± 0.11 | −20.06 ± 0.22 | −12.35 ± 0.19 | −7.70 ± 0.03 | Mitotic protein PRCC |
| Tm2Ap2 | AGGTTAcagTAACCT | 0.11 ± 0.01 | −24.36 ± 0.42 | −14.83 ± 0.45 | −9.53 ± 0.02 | Nuclear receptor SHP |
| Am3Tp3 | AGGACAcagTGTCCT | 0.26 ± 0.08 | −11.48 ± 0.53 | −2.47 ± 0.35 | −9.01 ± 0.18 | Protease inhibitor CST5 |
| Cm3Gp3 | AGGCCAcagTGGCCT | 0.86 ± 0.04 | −19.58 ± 0.28 | −11.29 ± 0.30 | −8.28 ± 0.03 | Cytoskeletal protein TNS1 |
| Gm3Cp3 | AGGGCAcagTGCCCT | 0.50 ± 0.02 | −20.06 ± 0.44 | −11.45 ± 0.41 | −8.61 ± 0.02 | Retinoblastoma protein RBL2 |
| Am4Tp4 | AGATCAcagTGATCT | 0.31 ± 0.01 | −19.20 ± 0.17 | −10.30 ± 0.14 | −8.89 ± 0.01 | Skeletal muscle protein MYOT |
| Cm4Gp4 | AGCTCAcagTGAGCT | 2.56 ± 1.01 | −11.77 ± 0.41 | −4.85 ± 0.20 | −7.66 ± 0.24 | Cytoskeletal protein EPS8 |
| Tm4Ap4 | AGTTCAcagTGAACT | 1.17 ± 0.04 | −23.87 ± 0.68 | −15.76 ± 0.66 | −8.10 ± 0.02 | GTPase Rab7L1 |
| Am5Tp5 | AAGTCAcagTGACTT | 0.50 ± 0.15 | −17.70 ± 0.49 | −9.08 ± 0.31 | −8.62 ± 0.18 | Cytokine IL20 |
| Cm5Gp5 | ACGTCAcagTGACGT | 4.09 ± 0.19 | −21.51 ± 0.20 | −14.15 ± 0.17 | −7.36 ± 0.03 | DNA helicase RecQ4 |
| Tm5Ap5 | ATGTCAcagTGACAT | 0.40 ± 0.01 | −21.86 ± 0.87 | −13.12 ± 0.88 | −8.75 ± 0.01 | MDR protein MRP5 |
| Cm6Gp6 | CGGTCAcagTGACCG | 0.14 ± 0.01 | −22.69 ± 0.52 | −13.34 ± 0.54 | −9.35 ± 0.02 | Transcription factor PROP1 |
| Gm6Cp6 | GGGTCAcagTGACCC | 0.15 ± 0.01 | −26.10 ± 0.20 | −16.76 ± 0.17 | −9.34 ± 0.03 | Caspase CASP7 |
| Tm6Ap6 | TGGTCAcagTGACCA | 0.75 ± 0.07 | −17.38 ± 0.36 | −9.00 ± 0.31 | −8.37 ± 0.05 | Secretory protein TFF1 |
Note that the DNA sequence shown for all motifs corresponds to the sense strand only and the flanking nucleotides have been omitted for clarity (see Figure 1). The symmetrically-substituted nucleotides within each half-site relative to the cERE motif are underlined. One example of an estrogen-responsive gene promoter that contains at least one of the substitutions within the corresponding ERE motif is provided for physiological relevance [63–65]. The values for the affinity (Kd) and enthalpy change (ΔH) accompanying the binding of DB domain of ERα to dsDNA oligos were obtained from the fit of a one-site model, based on the binding of a ligand to a macromolecule using the law of mass action, to the corresponding ITC isotherms as described earlier [40, 39]. Free energy of binding (ΔG) was calculated from the relationship ΔG=RTlnKd, where R is the universal molar gas constant (1.99 cal/mol/K) and T is the absolute temperature (K). Entropic contribution (TΔS) to binding was calculated from the relationship TΔS=ΔH−ΔG. Binding stoichiometries generally agreed to within ±10%. Errors were calculated from at least three independent measurements. All errors are given to one standard deviation.
Figure 3.
Analysis of the binding of DB domain of ERα to variant motifs relative to the consensus ERE motif in terms of relative binding affinity (Kr), relative enthalpic contribution (ΔΔH) and relative entropic contribution (TΔΔS) to the relative free energy (ΔΔG). Kr is defined as Kr=Kv/Kc, where Kv and Kc are respectively the binding affinities of the variant and consensus ERE motifs to the DB domain (Table 1). ΔΔH is defined as ΔΔH=ΔHv−Hc, where ΔHv and ΔHc are respectively the enthalpy changes observed for the variant and consensus ERE motifs upon binding to the DB domain (Table 1). TΔΔS is defined as TΔΔS=TΔSv−TΔSc, where TΔSv and TΔSc are respectively the entropic contributions observed for the variant and consensus ERE motifs upon binding to the DB domain (Table 1). ΔΔG is defined as ΔΔG=ΔGv−ΔGc, where ΔGv and ΔGc are respectively the free energy changes observed for the variant and consensus ERE motifs upon binding to the DB domain (Table 1).
Binding of ERE motif and its genetic variants thereof to ERα is enthalpy-entropy compensated
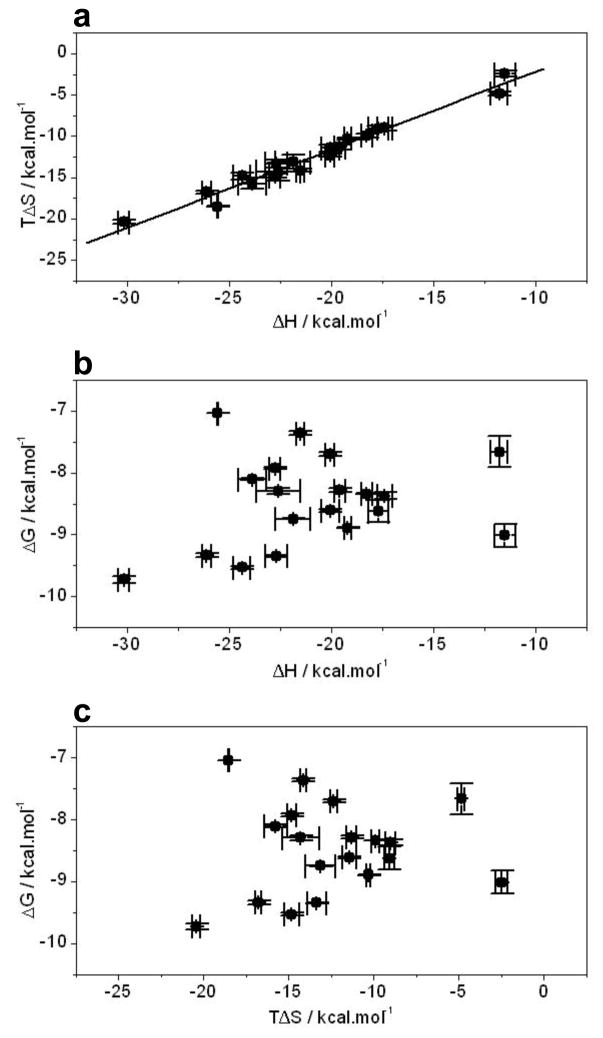
Macromolecular interactions are often governed by enthalpy-entropy compensation phenomenon, whereby favorable enthalpic changes are largely compensated by unfavorable entropic factors, and vice versa, such that there is little or no gain in the overall free energy of binding. In an effort to test whether the binding of ERE motif and its variants thereof to the DB domain of ERα is also subject to enthalpy-entropy compensation, we generated the enthalpy-entropy plot (Figure 4a). Evidently, the binding of ERE motif and its variants thereof to the DB domain indeed appears to be enthalpy-entropy compensated. Consistent with these observations, it is also important to note that the enthalpic (ΔH) and entropic (TΔS) contributions for the binding of ERE motif and its variants thereof to the DB domain show poor correlation with the overall free energy (ΔG) (Figures 4b and 4c). For example, an increase in favorable ΔH or a decrease in unfavorable TΔS does not necessarily lead to an increase in ΔG and vice versa. In light of the knowledge that the binding of proteins to major grooves within the DNA is under enthalpic control [46–52], the negative contribution of entropic penalty to the free energy appears to be an equally important regulator of such protein-DNA interactions. Taken together, these salient observations bear important consequences for the rationale design of novel drugs in that attempts to improve the efficacy of drugs through optimizing drug-target interactions may prove futile due to enthalpy-entropy compensation. Nevertheless, a better understanding of protein-ligand interactions in thermodynamic terms is a pre-requisite for the development of thermodynamic rules that may ultimately guide the design of novel drugs harboring greater efficacy coupled with low toxicity. It should also be noted here that although optimization of favorable ΔH in drug design appears to be more intuitive than minimizing unfavorable TΔS, enthalpically-optimized drugs may not necessarily be effective universally and that entropically-optimized drugs may offer a viable alternative.
Figure 4.
Interdependence of enthalpic (ΔH) and entropic (TΔS) contributions to the free energy (ΔG) for the binding of DB domain of ERα to dsDNA oligos containing the consensus ERE and variant motifs. (a) TΔS vs ΔH plot. (b) ΔG vs ΔH plot. (c) ΔG vs TΔS plot. Note that the solid line in (a) represents linear fit to the data. Error bars were calculated from at least three independent measurements. All errors are given to one standard deviation.
Effect of genetic variations within the ERE motif on the binding of ERα is governed by both the chemical nature of the substituted nucleotide and position of substitution
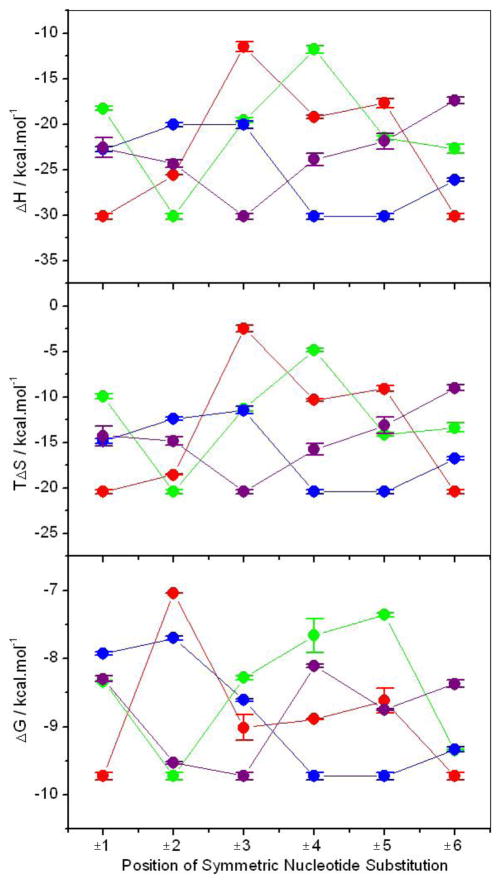
To test how the chemistry of the substituted nucleotide is coupled to the position at which it is substituted within the ERE motif in dictating the binding of DB domain of ERα, we generated the plots shown in Figure 5. It is important to note that there are four possible symmetric pairs of nucleotide substitutions within the ERE motif. These include the −A/+T, −C/+G, −G/+C and −T/+A symmetric pairs, where the − and + signs respectively indicate symmetric substitution of corresponding nucleotides within the left and right half-sites of the sense strand at a given position. Our data suggest that the introduction of these symmetric pairs of nucleotide substitutions within the ERE motif is highly position-dependent and that substitutions at certain positions are less tolerable than others. Thus, for example, the substitution of −A/+T and −G/+C symmetric pairs are least tolerable at ±2 positions, while −C/+G and −T/+A symmetric pairs are least tolerable at ±5 and ±4 positions, respectively. In contrast, the ±1, ±3 and ±6 positions within the ERE motif seem to be most tolerable for nucleotide substitutions. These salient observations are consistent with the crystal structure of the DB domain of ERα in complex with ERE duplex [29], wherein nucleotides at the ±2, ±4 and ±5 positions engage in closer intermolecular contacts with the protein in comparison with those at the ±1, ±3 and ±6 positions. It is note worthy that the optimal contribution of underlying enthalpic and entropic contributions to the overall free energy does not correlate with the least and most tolerable positions within the ERE motif. Thus, for example, the substitution of −A/+T symmetric pair is least tolerable at ±2 position, but the least favorable enthalpic contribution for this pair occurs at ±3 position. However, the ±3 position is also the most preferred position for the −A/+T symmetric pair in terms of encountering the least entropic penalty, implying that this position is reasonably tolerant for the substitution of −A/+T symmetric pair despite a significant loss in favorable enthalpic contribution. Of particular interest is also the observation that the most preferred positions for the −A/+T, −C/+G, −G/+C and −T/+A symmetric pairs are consistent with their positions within the consensus ERE motif, which displays the highest affinity for the DB domain compared to all other variants (Table 1). In other words, the nucleotides within the consensus AGGTCAnnnTGACCT motif are energetically the most preferred in their corresponding positions. Furthermore, the nucleotides within the consensus AGGTCAnnnTGACCT motif are also the most preferred in their corresponding positions in terms of enthalpic contributions to the free energy, implying that the consensus ERE motif is enthalpically-optimized. But is it also entropically-optimized? Close scrutiny of data presented in Figure 5 reveals that the nucleotides with least unfavorable entropic contributions to the overall free energy at each position within the ERE motif conform to the TACAGCnnnGCTGTA motif, implying that none of the nucleotides within the consensus ERE motif are entropically-optimized. In short, our data suggest strongly that the effect of genetic variations within the ERE motif on the energetics of binding of DB domain of ERα are strongly dependent upon both the chemistry of the substituted nucleotide and the position at which it is substituted.
Figure 5.
Dependence of free energy (ΔG) and the underlying enthalpic (ΔH) and entropic (TΔS) contributions on the position of symmetric nucleotide substitution within both half-sites of the consensus ERE and variant motifs for the binding of DB domain of ERα. The changes in various thermodynamic parameters upon the introduction of −A/+T (red), −C/+G (green), −G/+C (blue) and −T/+A (purple) are color-coded and connected by solid lines for clarity, where the − and + signs respectively indicate symmetric substitution of corresponding nucleotides within the left and right half-sites of the sense strand at the specified position. Error bars were calculated from at least three independent measurements. All errors are given to one standard deviation.
ERα shows no preference for binding to ERE variants rich in AT content
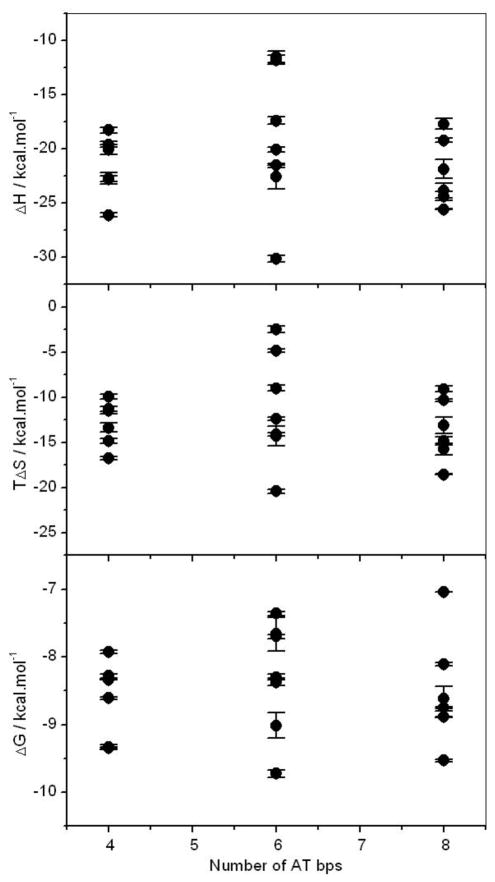
It is widely believed that AT sequences within DNA account for its intrinsic conformational flexibility such as bending and curvature [30, 53, 31, 54–58]. Such intrinsic propensity of AT sequences to undergo bending is believed to be largely due to increased propeller twist of these sequences by virtue of the fact that A-T base pairs are held together by only two hydrogen bonds in lieu of three formed between G-C base pairs. Given that the binding of DB domain of ERα to the ERE motif results in the bending of DNA [43], the AT content of ERE motif may therefore play an important role in modulating this protein-DNA interaction. In an attempt to analyze how the AT content of the ERE motif and its variants thereof correlates with the energetics of binding of the DB domain of ERα, we generated thermodynamic plots shown in Figure 6. To our surprise, the increase in AT content of ERE variants neither correlates with an increase in favorable enthalpic contribution nor unfavorable entropic contribution with the net result that the increased DNA flexibility does not result in enhanced binding to ERα. Thus, although the conformational plasticity such as the ability of ERE variants to bend and wrap around the DB domain so as to attain a close molecular fit may be critical for high-affinity binding, the unfavorable entropy arising from DNA becoming more constrained upon the binding of more flexible AT-rich variants relative to more rigid GC-rich variants may override such conformational advantage.
Figure 6.
Dependence of free energy (ΔG) and the underlying enthalpic (ΔH) and entropic (TΔS) contributions on the total number of AT bps within both half-sites of the consensus ERE and variant motifs for the binding of DB domain of ERα.
Genetic variations within the ERE motif allow it to sample much greater conformational space
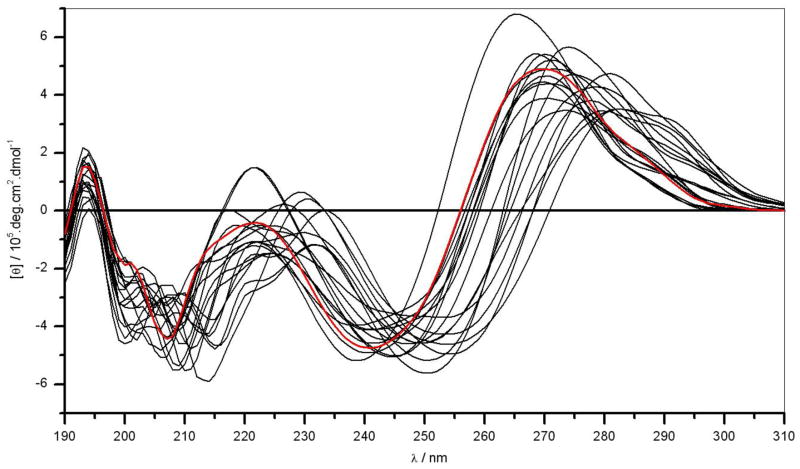
As discussed above, the nucleotide sequence is a key determinant of the ability of DNA to behave as a flexible polymer and undergo physical phenomena such as bending and curvature [30–32]. In an effort to further test how the introduction of genetic variations within the ERE motif modulates its conformational flexibility, we next conducted CD analysis (Figure 7). As expected, the CD spectra of ERE motifs and its variants thereof exhibit features characteristic of a right-handed double-stranded B-DNA with bands centered around 195nm, 220nm and 280nm. It is important to note that while the 195-nm and 220-nm bands arise from secondary structural DNA features, the 280-nm band probes the 3D conformation of DNA and therefore it is highly sensitive to physical changes in DNA such as bending and curvature. Accordingly, it is evident that the CD spectra of the variant motifs do not superimpose upon the CD spectrum of the consensus ERE motif but rather fluctuate around it and fan out forming a cluster of closely related optical spectra. Additionally, the wavelength maxima of the spectral bands centered around 220nm and 280nm show remarkable heterogeneity and lie as much as more than 10nm apart for some variant motifs relative to the consensus ERE motif. These salient observations imply that the introduction of single nucleotide substitutions within the ERE motif tightly governs its conformational flexibility and that the varying flexibility is likely to be an integral feature of their ability to bind to DB domain of ERα with distinct underlying energetics (Table 1). We also note that while the wavelength maximum and the intensity of the 280-nm band are related to the overall 3D conformation of DNA, such optical properties are not easily interpretable in structural terms such as bending and curvature. Nonetheless, our CD data indicate that the introduction of genetic variations within the ERE motif allows it to sample a much greater conformational space that might be a key feature of the ability of its variants to bind to ERα at distinct promoters in a selective manner.
Figure 7.
Representative CD spectra of dsDNA oligos containing the consensus ERE and variant motifs. The spectrum of consensus ERE motif (red) is superimposed onto spectra of variant motifs (black).
Atomic models provide the physical basis of how genetic variations within the ERE may gauge its binding affinity toward ERα
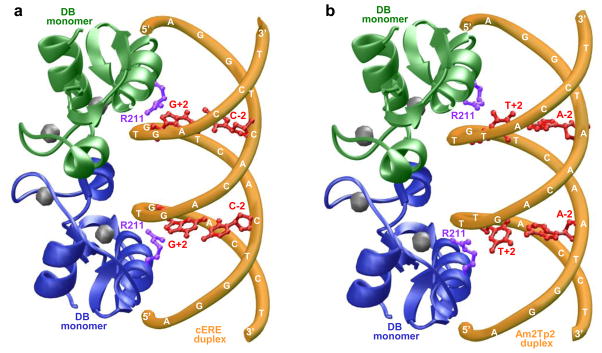
Our thermodynamic analysis presented here suggests strongly that genetic variations within the ERE motif can modulate its affinity to the DB domain of ERα by orders of magnitude. In an attempt to rationalize such a broad spectrum of binding affinities, we modeled and compared 3D structures of the DB domain in complex with the consensus ERE motif and the Am2Tp2 variant motif (Figure 8). It should be noted that the Am2Tp2 motif binds to the DB domain by nearly two orders of magnitude weaker than the consensus ERE motif (Table 1). Our modeled structures provide an exquisite explanation for such dramatic differences in the binding affinities of these two motifs. As shown in the crystal structure [29], the DB domain binds as a homodimer with a two-fold axis of symmetry within the major grooves of DNA duplex. One monomer contacts the antisense strand within the first half-site of the DNA duplex, while the other monomer contacts the sense strand within the second half-site. The key amino acid residue within each monomer involved in making differential contacts with the consensus ERE motif relative to the Am2Tp2 motif is R211. In the case of consensus ERE duplex, the guanidino moiety of R211 hydrogen bonds to a nitrogen atom with a lone pair of electrons in the G+2 base within both the antisense and sense strands. In the Am2Tp2 motif, the G+2 base is substituted to T+2 base. Of the all four DNA bases, thymine stands out for its unique hydrophobic character due to the presence of a methyl group. Thus, the introduction of a thymine at +2 positions within both strands of Am2Tp2 not only imparts hydrophobicity but, unlike guanine at this position, thymine can no longer serve as a hydrogen bonding partner for the guanidino moiety of R211 due to the lack of an available nitrogen atom with a lone pair of electrons. Additionally, our 3D atomic models reveal that the hydrophobic methyl group of T+2 bases would be highly destabilizing for subsequent protein-DNA contacts due to its close proximity to the charged guanidino moiety of G+2 bases. Accordingly, the sidechain of R211 must undergo a rotation to minimize contact with the methyl group of T+2 bases upon the binding of DB domain to Am2Tp2 motif. Additionally, the small size of thymine base compared to a much bulkier guanine may also result in the formation of cavities and subsequent entrapment of water molecules at the protein-DNA interface. In sum, our 3D atomic models suggest that the loss of key hydrogen bonding contacts at two critical points coupled with a number of other destabilizing factors could significantly weaken the binding of DB domain of ERα to Am2Tp2 motif relative to consensus ERE motif in agreement with our thermodynamic data reported here.
Figure 8.
3D atomic models of the DB domain of ERα in complex with dsDNA oligos containing the consensus ERE motif (a) and the variant Am2Tp2 motif (b). Note that the DB domain binds to DNA as a homodimer with a two-fold axis of symmetry. One monomer of the DB domain is shown in green and the other in blue. The Zn2+ divalent ions within each DB monomer are depicted as gray spheres and the sidechain moieties of R211 within each DB monomer are colored purple. The DNA backbone is shown in yellow and the bases at −2 and +2 positions within each motif are colored red.
CONCLUSIONS
The ability of ERα to serve as a transcription factor is largely dependent upon its ability to recognize the promoters of target genes. Although it is generally believed that ERα recognizes the ERE motif containing the consensus AGGTCAnnnTGACCT sequence, the promoters of a vast majority of estrogen-responsive genes are comprised of unusual elements that are related to the consensus ERE motif but differ in one or more nucleotides [27]. Despite the knowledge that such genetic variations within the promoters of target genes modulate the transcriptional activity of nuclear receptors [33–36], deciphering the underlying protein-DNA interactions in quantitative terms has remained a daring challenge for the past two decades or so. Herein, we have provided a detailed ITC analysis of how genetic variations within the ERE motif may affect the binding of ERα nuclear receptor and hence its transcriptional output in response to estrogens. Our data suggest strongly that genetic variations can modulate the binding of ERα by orders of magnitude and that such modulation may or may not involve drastic changes in the contribution of underlying thermodynamic forces driving subtle protein-DNA interactions. Furthermore, the binding of ERE motif and its variants thereof to ERα faithfully obeys the enthalpy-entropy compensation phenomenon, arguing strongly that thermodynamic considerations should form an integral part of rationale drug design. Although it is widely believed that AT sequences within DNA account for its intrinsic conformational flexibility such as bending and curvature [30, 53, 31, 54–58], our data presented here suggest a poor correlation between DNA flexibility and its binding to ERα. To account for such a discrepancy, we argue that although the conformational plasticity such as the ability of ERE variants to bend and wrap around ERα so as to attain a close molecular fit may be critical for high-affinity binding, the unfavorable entropy arising from DNA becoming more constrained upon the binding of more flexible AT-rich variants relative to more rigid GC-rich variants may override such conformational advantage. Nevertheless, our CD analysis shows that the introduction of genetic variations within the ERE motif allows it to sample a much greater conformational space that might be a key feature of the ability of its variants to bind to ERα at distinct promoters in a selective manner. Our atomic models also provide structural basis of how the symmetrical introduction of A−2/T+2 nucleotide pair within both half-sites of ERE can result in the reduction of binding of DB domain by nearly two orders of magnitude. Likewise, we postulate that the introduction of nucleotides at other positions within the ERE motif is likely to result in the loss of hydrogen bonding and other stabilizing interactions due to the rearrangement of amino acid sidechains in the DB domain. Finally, it should be noted that the genetic variations within the ERE motif may not necessarily act alone but rather in concert with other factors to regulate the transcriptional activity of ERα within the milieu of the cell. It has been previously reported that the nucleotides flanking the ERE motif affect the transcription activity of ERα [59–62]. Additionally, many estrogen-responsive genes contain the ERE motif in tandem or as composite elements containing an ERE motif and the binding site for another transcription factor. All these scenarios thus could dictate how genetic variations within the ERE motif at a given promoter might influence the overall transcriptional activity of ERα. Taken together, our study bears important consequences for how genetic variations within DNA promoter elements may fine-tune the physiological action of ERα and other nuclear receptors.
Acknowledgments
This work was supported by funds from the National Institutes of Health (Grant# R01-GM083897) and the USylvester Braman Family Breast Cancer Institute to AF. CBM is a recipient of a postdoctoral fellowship from the National Institutes of Health (Award# T32-CA119929). BJD and AF are members of the Sheila and David Fuente Graduate Program in Cancer Biology at the Sylvester Comprehensive Cancer Center of the University of Miami.
ABBREVIATIONS
- AR
Androgen receptor
- CD
Circular dichroism
- DB
DNA-binding
- ERα
Estrogen receptor α
- ERE
Estrogen response element
- GR
Glucocorticoid receptor
- ITC
Isothermal titration calorimetry
- LB
Ligand-binding
- MAPK
Mitogen-activated protein kinase
- MM
Molecular modeling
- NMR
Nuclear magnetic resonance
- NR
Nuclear receptor
- PR
Progesterone receptor
- SEC
Size-exclusion chromatography
- TA
Trans-activation
- TB
Terrific broth
- Trx
Thioredoxin
- XRC
X-ray crystallography
- ZF
Zinc finger
Footnotes
Publisher's Disclaimer: This is a PDF file of an unedited manuscript that has been accepted for publication. As a service to our customers we are providing this early version of the manuscript. The manuscript will undergo copyediting, typesetting, and review of the resulting proof before it is published in its final citable form. Please note that during the production process errors may be discovered which could affect the content, and all legal disclaimers that apply to the journal pertain.
References
- 1.Evans RM. Science. 1988;240:889–95. doi: 10.1126/science.3283939. [DOI] [PMC free article] [PubMed] [Google Scholar]
- 2.Thornton JW. Proc Natl Acad Sci U S A. 2001;98:5671–6. doi: 10.1073/pnas.091553298. [DOI] [PMC free article] [PubMed] [Google Scholar]
- 3.Escriva H, Bertrand S, Laudet V. Essays Biochem. 2004;40:11–26. doi: 10.1042/bse0400011. [DOI] [PubMed] [Google Scholar]
- 4.McKenna NJ, Cooney AJ, DeMayo FJ, Downes M, Glass CK, Lanz RB, Lazar MA, Mangelsdorf DJ, Moore DD, Qin J, Steffen DL, Tsai MJ, Tsai SY, Yu R, Margolis RN, Evans RM, O’alley BW. Mol Endocrinol. 2009;23:740–6. doi: 10.1210/me.2009-0135. [DOI] [PMC free article] [PubMed] [Google Scholar]
- 5.Kumar R, Thompson EB. Steroids. 1999;64:310–9. doi: 10.1016/s0039-128x(99)00014-8. [DOI] [PubMed] [Google Scholar]
- 6.Barnett P, Tabak HF, Hettema EH. Trends Biochem Sci. 2000;25:227–8. doi: 10.1016/s0968-0004(00)01579-6. [DOI] [PubMed] [Google Scholar]
- 7.McEwan IJ. Methods Mol Biol. 2009;505:3–18. doi: 10.1007/978-1-60327-575-0_1. [DOI] [PubMed] [Google Scholar]
- 8.Green S, Chambon P. Trends Genet. 1988;4:309–14. doi: 10.1016/0168-9525(88)90108-4. [DOI] [PubMed] [Google Scholar]
- 9.Egea PF, Klaholz BP, Moras D. FEBS Lett. 2000;476:62–7. doi: 10.1016/s0014-5793(00)01672-0. [DOI] [PubMed] [Google Scholar]
- 10.Claessens F, Gewirth DT. Essays Biochem. 2004;40:59–72. doi: 10.1042/bse0400059. [DOI] [PubMed] [Google Scholar]
- 11.Ham J, Parker MG. Curr Opin Cell Biol. 1989;1:503–11. doi: 10.1016/0955-0674(89)90012-4. [DOI] [PubMed] [Google Scholar]
- 12.Darimont BD, Wagner RL, Apriletti JW, Stallcup MR, Kushner PJ, Baxter JD, Fletterick RJ, Yamamoto KR. Genes Dev. 1998;12:3343–56. doi: 10.1101/gad.12.21.3343. [DOI] [PMC free article] [PubMed] [Google Scholar]
- 13.Kato S, Endoh H, Masuhiro Y, Kitamoto T, Uchiyama S, Sasaki H, Masushige S, Gotoh Y, Nishida E, Kawashima H, Metzger D, Chambon P. Science. 1995;270:1491–4. doi: 10.1126/science.270.5241.1491. [DOI] [PubMed] [Google Scholar]
- 14.Warnmark A, Treuter E, Wright AP, Gustafsson JA. Mol Endocrinol. 2003;17:1901–9. doi: 10.1210/me.2002-0384. [DOI] [PubMed] [Google Scholar]
- 15.Brzozowski AM, Pike AC, Dauter Z, Hubbard RE, Bonn T, Engstrom O, Ohman L, Greene GL, Gustafsson JA, Carlquist M. Nature. 1997;389:753–8. doi: 10.1038/39645. [DOI] [PubMed] [Google Scholar]
- 16.Gottlieb B, Beitel LK, Wu J, Elhaji YA, Trifiro M. Essays Biochem. 2004;40:121–36. doi: 10.1042/bse0400121. [DOI] [PubMed] [Google Scholar]
- 17.Gurnell M, Chatterjee VK. Essays Biochem. 2004;40:169–89. doi: 10.1042/bse0400169. [DOI] [PubMed] [Google Scholar]
- 18.Noy N. Biochemistry. 2007;46:13461–7. doi: 10.1021/bi7018699. [DOI] [PubMed] [Google Scholar]
- 19.Sonoda J, Pei L, Evans RM. FEBS Lett. 2008;582:2–9. doi: 10.1016/j.febslet.2007.11.016. [DOI] [PMC free article] [PubMed] [Google Scholar]
- 20.Jensen EV. Perspect Biol Med. 1962;6:47–59. doi: 10.1353/pbm.1963.0005. [DOI] [PubMed] [Google Scholar]
- 21.Jensen EV, Jacobson H. Recent Prog Horm Res. 1962;18:318–414. [Google Scholar]
- 22.Toft D, Gorski J. Proc Natl Acad Sci U S A. 1966;55:1574–81. doi: 10.1073/pnas.55.6.1574. [DOI] [PMC free article] [PubMed] [Google Scholar]
- 23.Toft D, Shyamala G, Gorski J. Proc Natl Acad Sci U S A. 1967;57:1740–3. doi: 10.1073/pnas.57.6.1740. [DOI] [PMC free article] [PubMed] [Google Scholar]
- 24.Kumar V, Green S, Stack G, Berry M, Jin JR, Chambon P. Cell. 1987;51:941–51. doi: 10.1016/0092-8674(87)90581-2. [DOI] [PubMed] [Google Scholar]
- 25.Jensen EV, Jordan VC. Clin Cancer Res. 2003;9:1980–9. [PubMed] [Google Scholar]
- 26.Heldring N, Pike A, Andersson S, Matthews J, Cheng G, Hartman J, Tujague M, Strom A, Treuter E, Warner M, Gustafsson JA. Physiol Rev. 2007;87:905–31. doi: 10.1152/physrev.00026.2006. [DOI] [PubMed] [Google Scholar]
- 27.Klinge CM. Nucleic Acids Res. 2001;29:2905–19. doi: 10.1093/nar/29.14.2905. [DOI] [PMC free article] [PubMed] [Google Scholar]
- 28.Schwabe JW, Neuhaus D, Rhodes D. Nature. 1990;348:458–61. doi: 10.1038/348458a0. [DOI] [PubMed] [Google Scholar]
- 29.Schwabe JW, Chapman L, Finch JT, Rhodes D. Cell. 1993;75:567–78. doi: 10.1016/0092-8674(93)90390-c. [DOI] [PubMed] [Google Scholar]
- 30.Marini JC, Levene SD, Crothers DM, Englund PT. Proc Natl Acad Sci U S A. 1982;79:7664–7668. doi: 10.1073/pnas.79.24.7664. [DOI] [PMC free article] [PubMed] [Google Scholar]
- 31.Wu HM, Crothers DM. Nature. 1984;308:509–13. doi: 10.1038/308509a0. [DOI] [PubMed] [Google Scholar]
- 32.Munteanu MG, Vlahovicek K, Parthasarathy S, Simon I, Pongor S. Trends Biochem Sci. 1998;23:341–7. doi: 10.1016/s0968-0004(98)01265-1. [DOI] [PubMed] [Google Scholar]
- 33.Nordeen SK, Suh BJ, Kuhnel B, Hutchison CA., 3rd Mol Endocrinol. 1990;4:1866–73. doi: 10.1210/mend-4-12-1866. [DOI] [PubMed] [Google Scholar]
- 34.Lieberman BA, Bona BJ, Edwards DP, Nordeen SK. Mol Endocrinol. 1993;7:515–27. doi: 10.1210/mend.7.4.8388996. [DOI] [PubMed] [Google Scholar]
- 35.Nordeen SK, Ogden CA, Taraseviciene L, Lieberman BA. Mol Endocrinol. 1998;12:891–8. doi: 10.1210/mend.12.6.0118. [DOI] [PubMed] [Google Scholar]
- 36.Nelson CC, Hendy SC, Shukin RJ, Cheng H, Bruchovsky N, Koop BF, Rennie PS. Mol Endocrinol. 1999;13:2090–107. doi: 10.1210/mend.13.12.0396. [DOI] [PubMed] [Google Scholar]
- 37.Gasteiger E, Hoogland C, Gattiker A, Duvaud S, Wilkins MR, Appel RD, Bairoch A. In: The Proteomics Protocols Handbook. Walker JM, editor. Humana Press; Totowa, New Jersey, USA: 2005. pp. 571–607. [Google Scholar]
- 38.Cantor CR, Warshaw MM, Shapiro H. Biopolymers. 1970;9:1059–77. doi: 10.1002/bip.1970.360090909. [DOI] [PubMed] [Google Scholar]
- 39.Deegan BJ, Seldeen KL, McDonald CB, Bhat V, Farooq A. Biochemistry. 2010;49:5978–88. doi: 10.1021/bi1004359. [DOI] [PMC free article] [PubMed] [Google Scholar]
- 40.Wiseman T, Williston S, Brandts JF, Lin LN. Anal Biochem. 1989;179:131–137. doi: 10.1016/0003-2697(89)90213-3. [DOI] [PubMed] [Google Scholar]
- 41.Marti-Renom MA, Stuart AC, Fiser A, Sanchez R, Melo F, Sali A. Annu Rev Biophys Biomol Struct. 2000;29:291–325. doi: 10.1146/annurev.biophys.29.1.291. [DOI] [PubMed] [Google Scholar]
- 42.Carson M. J Appl Crystallogr. 1991;24:958–961. [Google Scholar]
- 43.Nardulli AM, Shapiro DJ. Mol Cell Biol. 1992;12:2037–42. doi: 10.1128/mcb.12.5.2037. [DOI] [PMC free article] [PubMed] [Google Scholar]
- 44.Seldeen KL, McDonald CB, Deegan BJ, Farooq A. Biochemistry. 2009;48:1975–1983. doi: 10.1021/bi802068s. [DOI] [PMC free article] [PubMed] [Google Scholar]
- 45.Klinge CM, Jernigan SC, Smith SL, Tyulmenkov VV, Kulakosky PC. Mol Cell Endocrinol. 2001;174:151–66. doi: 10.1016/s0303-7207(01)00382-3. [DOI] [PubMed] [Google Scholar]
- 46.Foguel D, Silva JL. Proc Natl Acad Sci U S A. 1994;91:8244–7. doi: 10.1073/pnas.91.17.8244. [DOI] [PMC free article] [PubMed] [Google Scholar]
- 47.Ladbury JE, Wright JG, Sturtevant JM, Sigler PB. J Mol Biol. 1994;238:669–681. doi: 10.1006/jmbi.1994.1328. [DOI] [PubMed] [Google Scholar]
- 48.Merabet E, Ackers GK. Biochemistry. 1995;34:8554–63. doi: 10.1021/bi00027a005. [DOI] [PubMed] [Google Scholar]
- 49.Petri V, Hsieh M, Brenowitz M. Biochemistry. 1995;34:9977–84. doi: 10.1021/bi00031a020. [DOI] [PubMed] [Google Scholar]
- 50.Berger C, Jelesarov I, Bosshard HR. Biochemistry. 1996;35:14984–91. doi: 10.1021/bi961312a. [DOI] [PubMed] [Google Scholar]
- 51.Milev S, Bosshard HR, Jelesarov I. Biochemistry. 2005;44:285–93. doi: 10.1021/bi048907n. [DOI] [PubMed] [Google Scholar]
- 52.Privalov PL, Dragan AI, Crane-Robinson C. Trends Biochem Sci. 2009;34:464–70. doi: 10.1016/j.tibs.2009.05.005. [DOI] [PubMed] [Google Scholar]
- 53.Arnott S, Chandrasekaran R, Hall IH, Puigjaner LC. Nucleic Acids Res. 1983;11:4141–55. doi: 10.1093/nar/11.12.4141. [DOI] [PMC free article] [PubMed] [Google Scholar]
- 54.Koo HS, Wu HM, Crothers DM. Nature. 1986;320:501–6. doi: 10.1038/320501a0. [DOI] [PubMed] [Google Scholar]
- 55.Alexeev DG, Lipanov AA, Skuratovskii I. Nature. 1987;325:821–3. doi: 10.1038/325821a0. [DOI] [PubMed] [Google Scholar]
- 56.Coll M, Frederick CA, Wang AH, Rich A. Proc Natl Acad Sci U S A. 1987;84:8385–9. doi: 10.1073/pnas.84.23.8385. [DOI] [PMC free article] [PubMed] [Google Scholar]
- 57.Nelson HC, Finch JT, Luisi BF, Klug A. Nature. 1987;330:221–6. doi: 10.1038/330221a0. [DOI] [PubMed] [Google Scholar]
- 58.DiGabriele AD, Sanderson MR, Steitz TA. Proc Natl Acad Sci U S A. 1989;86:1816–20. doi: 10.1073/pnas.86.6.1816. [DOI] [PMC free article] [PubMed] [Google Scholar]
- 59.Anolik JH, Klinge CM, Bambara RA, Hilf R. J Steroid Biochem Mol Biol. 1993;46:713–30. doi: 10.1016/0960-0760(93)90312-k. [DOI] [PubMed] [Google Scholar]
- 60.Anolik JH, Klinge CM, Hilf R, Bambara RA. Biochemistry. 1995;34:2511–20. doi: 10.1021/bi00008a015. [DOI] [PubMed] [Google Scholar]
- 61.Anolik JH, Klinge CM, Brolly CL, Bambara RA, Hilf R. J Steroid Biochem Mol Biol. 1996;59:413–29. doi: 10.1016/s0960-0760(96)00129-x. [DOI] [PubMed] [Google Scholar]
- 62.Driscoll MD, Sathya G, Muyan M, Klinge CM, Hilf R, Bambara RA. J Biol Chem. 1998;273:29321–30. doi: 10.1074/jbc.273.45.29321. [DOI] [PubMed] [Google Scholar]
- 63.Karolchik D, Baertsch R, Diekhans M, Furey TS, Hinrichs A, Lu YT, Roskin KM, Schwartz M, Sugnet CW, Thomas DJ, Weber RJ, Haussler D, Kent WJ. Nucleic Acids Res. 2003;31:51–4. doi: 10.1093/nar/gkg129. [DOI] [PMC free article] [PubMed] [Google Scholar]
- 64.Laganiere J, Deblois G, Lefebvre C, Bataille AR, Robert F, Giguere V. Proc Natl Acad Sci U S A. 2005;102:11651–6. doi: 10.1073/pnas.0505575102. [DOI] [PMC free article] [PubMed] [Google Scholar]
- 65.Hinrichs AS, Karolchik D, Baertsch R, Barber GP, Bejerano G, Clawson H, Diekhans M, Furey TS, Harte RA, Hsu F, Hillman-Jackson J, Kuhn RM, Pedersen JS, Pohl A, Raney BJ, Rosenbloom KR, Siepel A, Smith KE, Sugnet CW, Sultan-Qurraie A, Thomas DJ, Trumbower H, Weber RJ, Weirauch M, Zweig AS, Haussler D, Kent WJ. Nucleic Acids Res. 2006;34:D590–8. doi: 10.1093/nar/gkj144. [DOI] [PMC free article] [PubMed] [Google Scholar]


