Abstract
High [HCO3−] inhibits and low [HCO3−] stimulates bone resorption which mediates part of the effect of chronic acidosis or acid feeding on bone. Soluble adenylyl cyclase (sAC) is a bicarbonate sensor that can potentially mediate the effect of bicarbonate on osteoclasts. Osteoclasts were incubated in 0, 12, 24 mM HCO3− at pH 7.4 for 7–8 days and assayed for tartrate-resistant acid phosphatase (TRAP) and vacuolar-ATPase expression, and H+ accumulation. Total number and area of TRAP (+) multinucleated osteoclasts was decreased by HCO3− in a dose-dependent manner. V-ATPase expression and H+ accumulation normalized to cell cross-sectional area or protein were not significantly changed. The HCO3−-induced inhibition of osteoclast growth and differentiation was blocked by either 2-hydroxyestradiol, an inhibitor of sAC or sAC knock-down by sAC specific siRNA. The model of HCO3− inhibiting osteoclast via sAC was further supported by the fact that the HCO3− dose-response on osteoclasts is flat when cells were saturated with 8-bromo-cAMP, a permeant cAMP analog downstream from sAC thus simulating sAC activation. To confirm our in vitro findings in intact bone, we developed a one-week mouse calvaria culture system where osteoclasts were shown to be viable. Bone volume density (BV/TV) determined by micro-computed tomography (µCT), was higher in 24mM HCO3− compared to 12 mM HCO3− treated calvaria. This HCO3− effect on BV/TV was blocked by 2-hydroxyestradiol. In summary, sAC mediates the inhibition of osteoclast function by HCO3−, by acting as a HCO3− sensor.
Keywords: Soluble adenylyl cyclase (sAC), Bicarbonate, Osteoclast, Acid
Introduction
The relationship between acid-base status and bone is well established in humans and animals (Buclin et al., 2001; Bushinsky, 1995; Bushinsky, 1996; Bushinsky, 2001) (Goldhaber and Rabadjija, 1987; Kraut et al., 1986; Krieger et al., 1992). Patients with renal tubular acidosis receiving alkali therapy have increased radial bone mineral density (Preminger et al., 1985), increased bone formation markers, and decreased bone resorption markers (Osther et al., 1993). Alkali therapy in combination with thiazides exerts a positive effect on bone mineral density in kidney stone formers (Pak et al., 2003). Epidemiologic data have demonstrated an association of higher alkali content of the diet with higher bone density (New, 1999; New et al., 2000; Tucker et al., 1999). In general, high [HCO3−] and alkali pH inhibit, and low [HCO3−] and acidic pH stimulate bone resorption.
Bone resorption involves both recruitment and activation of osteoclasts (Rousselle and Heymann, 2002). Osteoclasts are hematopoietically-derived from monocyte lineage cells (Osdoby et al., 1982; Roodman, 1999). They differentiate and fuse to form multinucleated cells influenced by osteoblasts/stromal cells through the RANK (receptor activator of NF- κβ)/RANKL/OPG system (Khosla, 2001; Lacey et al., 1998; Simonet et al., 1997; Takahashi et al., 1999; Yasuda et al., 1998). To remove bone matrix, osteoclasts develop a tight junction on the bone surface and secrete H+ (via the vacuolar-ATPase or V-ATPase) and lysosomal enzymes onto the bone from the ruffled border (Roodman, 1999). Carbonic anhydrase II generates the H+ from metabolic CO2 and the HCO3− is extruded on the contralateral surface from osteoclasts into the blood. Ambient HCO3− can decrease H+-pumping by decreasing the chemical gradient for HCO3− exit or it can affect osteoclast function directly. Low [HCO3−] stimulates and high [HCO3−] inhibits osteoclastic activity (Arnett and Dempster, 1990; Goldhaber and Rabadjija, 1987; Kraut et al., 1986; Krieger et al., 1992). At least part of the regulation of osteoclast function by [HCO3−] is via biological means but the signaling pathway remains unclear (Bushinsky, 1996; Bushinsky, 2001).
The recent cloning of the soluble adenylyl cyclase (sAC) as a HCO3−-sensitive cyclase provided a way to transduce chemical concentrations of HCO3− ([HCO3−]) to the second messenger cyclic AMP (cAMP) (Buck et al., 1999; Chen et al., 2000). sAC was originally cloned from rat testis (Buck et al., 1999) and its importance in sperm motility was documented by sperm immotility in the sAC-null mouse (Esposito et al., 2004). Later, sAC was found in multiple tissues or cell lines (Geng et al., 2005; Zippin et al., 2003) and is considered as a HCO3− sensor in mammalian cells. The human ortholog of sAC (hsAC) was cloned independently as a candidate gene in a locus tightly linked to the phenotype of hyperabsorptive hypercalciuria and low bone mineral density (Reed et al., 1999; Zerwekh et al., 2002). Human sAC exhibits HCO3− sensitivity and is highly expressed in osteoclasts (Geng et al., 2005).
Although murine RAW264.7 cells have certain characteristics that are different from primary cultured osteoclasts (Srivastava et al., 2001; Wittrant et al., 2004) and as with all cell culture models do not exactly represent native osteoclasts in bone, they have been widely used for the study of osteoclasts (Beranger et al., 2006; Khosla, 2001; Lee et al., 2005; Yang et al., 2007) although it has In the presence of receptor activator of NF- κβ ligand (RANKL) and monocyte colony-stimulating factor (M-CSF), RAW264.7 cells can be transformed into multinucleated osteoclasts that exhibit resorptive function (Rhee et al., 2006). Using this in vitro system and cultured calvaria, we provide data to show that the inhibition of osteoclast function by HCO3− is mediated by sAC.
Materials and Methods
In vitro osteoclastogenesis
RAW264.7 cells derived from mouse monocytes were obtained from the American Type Culture Collection (Manassas, VA). About 8 ×10³ RAW264.8 cells per well were seeded into the 48-well culture plates or 1.6 × 10⁴ cells per well for 24-well culture plates in Dulbecco's modified Eagle's medium (DMEM) supplemented with 10% fetal bovine serum (FBS) at 37°C in humidified 5% CO2 in air and culture medium was replaced every 48 hours. Induction was achieved with 50 ng/ml RANKL and 5 ng/ml monocyte colony-stimulating factor (M-CSF). In addition, we also used a second system to confirm some key findings. Osteoclasts from bone marrow were harvested by the method of Kawano et al. (Kawano et al., 2003) with modifications by Wan et al. (Wan et al., 2007). Briefly, marrow was flushed out with culture medium and plated at 2 × 10⁶ cells/well in 12-well plate in alpha-MEM containing 10%FBS for 6–8 days (first 3 days with 20ng/ml MCSF, later 3–5 days with 20ng/ml MCSF and 100ng/ml RANKL) with media change every 3 days. TRAP positivity was confirmed by staining before usage.
HCO3−, 2-hydroxyestradiol, 8-bromo-cAMP treatment
To investigate the HCO3− effect we kept the media under isohydric conditions by simultaneously altering the HCO3− concentration and CO2 tension. Hepes-buffered HCO3−-free media were saturated with air bubbled through KOH and adjusted to a final pH of 7.4 for CO2-free conditions. For HCO3− experiments, cells were maintained in separated incubators containing the desired percentage of CO2 in air (24 mM HCO3− at 37°C in humidified 5% CO2 with pH of 7.4; 12 mM HCO3− at 37°C in humidified 2.5% CO2 in air with pH of 7.4). For pharmacologic sAC inhibition, 1 or 5 µM of 2-hydroxyestradiol (Sigma, St. Louis, MO) in DMSO was added into the media. Equal amount of DMSO (0.1% v:v) were added into the controls. For permeant cAMP analog treatment, 0.1 mM of 8-bromo-cAMP (Sigma, St. Louis, MO), +/− 5 µM of 2-hydroxyestradiol were added into the media. Culture media were replaced every 24 hours.
TRAP staining and activity
After 7–10 days in culture, cells were fixed and stained for tartrate-resistant acid phosphatase (TRAP) (Kamiya Biomedical, Seattle, WA) according to the manufacturer’s instructions. TRAP (+) cells with three or more nuclei were counted as multinucleated osteoclasts under light microscopy. For quantitative and statistical evaluation, cell counting was done using four randomly selected fields of view per well and pooled to represent the well. For quantitative TRAP activity assay, 100 µl of the cell culture media was collected on day 4 and day 5 post-RANKL-induction and TRAP activities were determined by the TRAP activity kit (Kamiya Biomedical, Seattle, WA).
Effects of sAC-specific siRNA on osteoclast function and differentiation
The 21-nucleotide small interfering RNA (siRNA) targeting sAC (sense, 5'-CAUCAUCACGGUGGUGAUUUU-3', and antisense, 5'-AAUCACCACCGUGAUGAUGUU-3', Ambion, Austin, TX) were annealed according to the manufacturer's instructions. Approximately 24 h before transfection, RAW264.7 cells were plated in 6-well plates at the appropriate cell density so that they were ~70% confluent the next day. For the complex formation and transfection, 6 µl of the TransIT-TKO transfection reagent (Mirus, Madison, WI) were mixed with 250 µl of serum-free medium and incubated at room temperature for 20 min, and then siRNA (100 nM) was added to the complex and incubated at room temperature for an additional 20 min. The mixture was applied to RAW264.7 cells containing 1.25 ml complete growth media (DMEM with 10% FBS). Cell culture medium was replaced every 24 h, and RAW264.7 cells were collected on day 3 post-transfection for immunoblot analysis. Silencer negative control #1 siRNA (Ambion, Austin, TX) was used for the control cells. On day 4 and day 5 of post RANKL induction, 100µl of the cell culture media were collected and the TRAP activity was determined. On day 7, cells were fixed and TRAP staining was performed.
V-ATPase and sAC immunoblotting
For immunoblots, cells were washed twice with ice-cold phosphate-buffered saline (PBS), scraped, suspended in 1 ml of lysis buffer (10 mmol/l Tris, pH 7.4, 1 mmol/l EDTA, 1% glycerol, 1 µg/ml leupeptin, 1 µg/ml pepstatin, 50 µg/ml aprotinin, and 0.5 mmol/l phenylmethylsulfonyl fluoride) on ice, and disrupted by two 10-s bursts from a Tekmar sonic disrupter (Fisher Scientific, Hampton, NH) at power setting 60. Protein concentrations were determined by a bicinchoninic acid protein assay (Pierce, Rockford, IL). Equal amounts of proteins were electrophoretically separated on 10% sodium dodecyl sulfate-polyacrylamide gel, transferred to nitrocellulose membrane, blocked (10% nonfat dry milk in PBS, pH 7.4), and labeled with primary antibody. After washing in PBS-Tween 20, membranes were incubated with a 1:5,000 dilution of goat anti-mouse IgG horseradish peroxidase-conjugated secondary antibody (Amersham, Piscataway, NJ) in PBS containing 5% nonfat dry milk. Reactive bands were visualized using enhanced chemiluminescence (Amersham, Piscataway, NJ). Monoclonal anti-hsAC antibody was custom manufactured (Promab Biotechnologies, Albany, CA) by using our purified catalytic domain of hsAC aa1-483 from Sf9 insect cells. The specificity of the anti-hsAC antibody was validated by a combination of methods: Reaction with purified hsAC, detection of overexpression of hsAC, competitive blocking with the purified hsAC protein, and knock-down with the hsAC-specific siRNA (data not show). Anti V-ATPase a3 antibody (Manolson et al., 2003) was kindly provided by Dr. Beth S. Lee (Ohio State University, Columbus, OH). Anti-β actin antibody was purchased commercially (Sigma, St. Louis, MO).
V-ATPase confocal immunofluorescent microscopy
After induction, osteoclasts were fixed with 3.7% paraformaldehyde for 10 min at room temperature, quenched with 100 mM glycine for 5 min at room temperature, permeabilized in 0.1–0.3% Triton X-100 for 5 min on ice, blocked with PBS-10% milk for 30 min at room temperature, incubated in anti-B subunit of the V-ATPase (“pan-B” antibody was kindly provided by Dr. Xiao-Song Xie, UT Southwestern, Dallas, TX) for 4°C overnight, and then incubated in FITC-labeled goat anti-rabbit IgG (Molecular Probes, Eugene, OR) for 30 min at room temperature. Immunofluorescence microscopy was performed with a Zeiss LSM 510 confocal microscope using a krypton/argon laser. Images were analyzed and quantitized for each osteoclast using LSM 5 Image software.
Acridine orange staining
RAW264.7 cells were seeded into six-well culture plates with bottom glass coverslips. At day 7–8, 10 µM of acridine orange (AO) (Sigma, St. Louis, MO) was added into the culture media and equilibrated with cells for 20 minutes. Extracellular acridine orange was then removed by washing three times with PBS solution. Live cell images were obtained with a Zeiss LSM510 confocal microscope using a krypton/argon laser (λex 488 nm, λem 510–540 nm for un-protonated AO that binds to DNA and RNA, λem 590–650 nm for protonated AO). A series of z stack images (z scaling 0.70 µm) were collected for each osteoclast. Images containing the acid granules were combined to determine the H+ accumulation. Quantization for the protonated AO from each osteoclast was measured individually. For comparison of fluorescent intensities, images were collected at identical optical settings for each independent experiment.
Mouse calvaria culture
A total of 32 calvaria from 10 male and 6 female C57Bl6 mice (Charles River Laboratories, Wilmington MA, age of 8–9 weeks old) were used. Mice were sacrificed and calvaria were dissected under sterile condition and soft tissue was removed as much as possible. Samples were rinsed with sterilized Hank's Buffered Salt Solution (HBSS) and placed into six-well culture plate containing 50 ng/ml RANKL, 5 ng/ml M-CSF, and 10% fetal bovine serum. Calvaria were paired into four groups: 12 mM vs. 24 mM HCO3− and with or without 5 µM 2-hydroxyestradiol. For each 12 vs. 24 mM HCO3− pair, one calvarium was used for the 12 mM HCO3− treatment, the other calvarium from the same mouse was used for the 24 mM HCO3− treatment. The ambient CO2 setting was identical to the osteoclast study. For 2-hydroxyestradiol treatment, 5 µM of 2-hydroxyestradiol in DMSO were added into the media. Equal amount of DMSO were added into the controls. Calvaria were cultured for seven days and culture media were replaced every 24 hours.
Calvaria histology
At the end of the seven days culture, calvaria were placed into 70% ethonol for 72 hours. The specimen was then dehydrated in a graded series of alcohol and processed undecalcified in methylmethacrylate as previously described (Zerwekh et al., 2002). Ten µm sections were obtained in the coronal plane and were stained with toluidine blue. The histological images were captured from an Aus Jena microscope with an Optiplex video camera attachment.
Micro-computed tomography (µCT) determination of bone mass
For µCT imaging, fixed calvaria were imaged and analyzed using a compact fan-beam-type tomograph (µCT 40, Scanco Medical AG, Brüttisellen, Switzerland) as previously described (Battaglino et al., 2007). Samples were located in an airtight cylindrical sample holder filled with formalin. The sample holders were marked with an axial alignment line to allow for consistent positioning of the specimens. The X-ray tube was operated at 50 kVp and 160 µA with an integration time set to 200 ms and projections were taken three times and then averaged (frame averaging). Scans were performed at an isotropic, nominal resolution of 8 µm (high resolution mode). For each sample, approximately 200 micro-tomographic slices were acquired, covering the entire width of the bone. A constrained 3D Gaussian filter (σ = 1.2, support of one voxel) was used to partly suppress the noise in the volumes and the mineralized tissue was segmented from soft tissues by a global thresholding procedure. The threshold was set to 40.0% of the maximum grayscale value. Three-dimensional analyses were performed to calculate morphometric indices including metric parameters such as total volume (TV), bone volume (BV), marrow volume (MV), bone surface (BS), and bone volume density (BV/TV). All indices were calculated using direct three-dimensional morphometry (Hildebrand et al., 1999).
Statistics
Data are presented as means ± SEM. Comparisons were performed using ANOVA followed by Student-Newmann-Keuls post-hoc analysis for all of the studies except the paired Student’s t-test for the calvaria studies. P < 0.05 was considered statistically significant in all analyses.
Results
HCO3− Inhibits osteoclast formation in vitro
In HCO3-free medium, 215 ± 43 TRAP(+) multinucleated osteoclasts formed and more than 25% were giant (> 50 nuclei per cell) TRAP(+) multinucleated osteoclasts (Fig. 1A, top panel; Fig. 1C, open bar). In contrast, 120 ± 14 TRAP (+) multinucleated osteoclasts were formed in 12 mM HCO3− media and less then 10% were giant TRAP (+) multinucleated osteoclasts (Fig. 1A, top panel; Fig. 1C open bar). In 24 mM HCO3− media, only 60 ± 17 TRAP(+) multinucleated osteoclasts were formed and no giant TRAP (+) multinucleated osteoclasts were observed (Fig. 1A, top panel; Fig. 1C open bar). Increasing [HCO3−] significantly reduced the total osteoclast area, 0.619 ± 0.06; 0.237 ± 0.012; 0.043 ± 0.004 mm2 per well for 0 mM; 12 mM; 24 mM HCO3− respectively (Fig. 1B, open bars).
Fig. 1. Effects of HCO3− and sAC inhibitor on osteoclast formation.
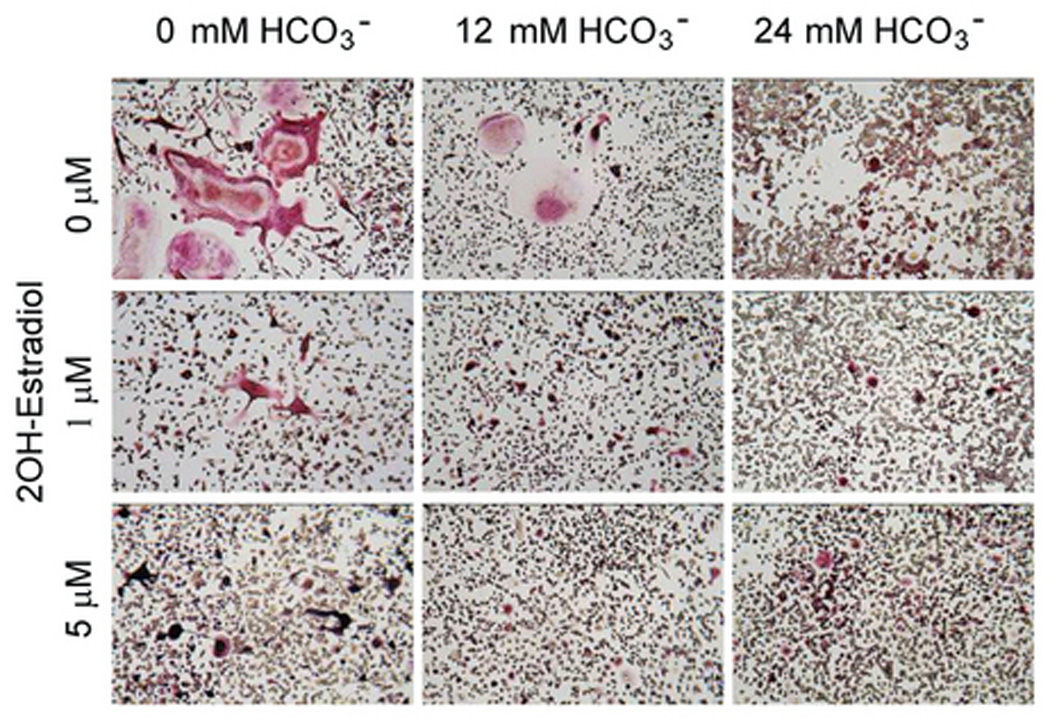
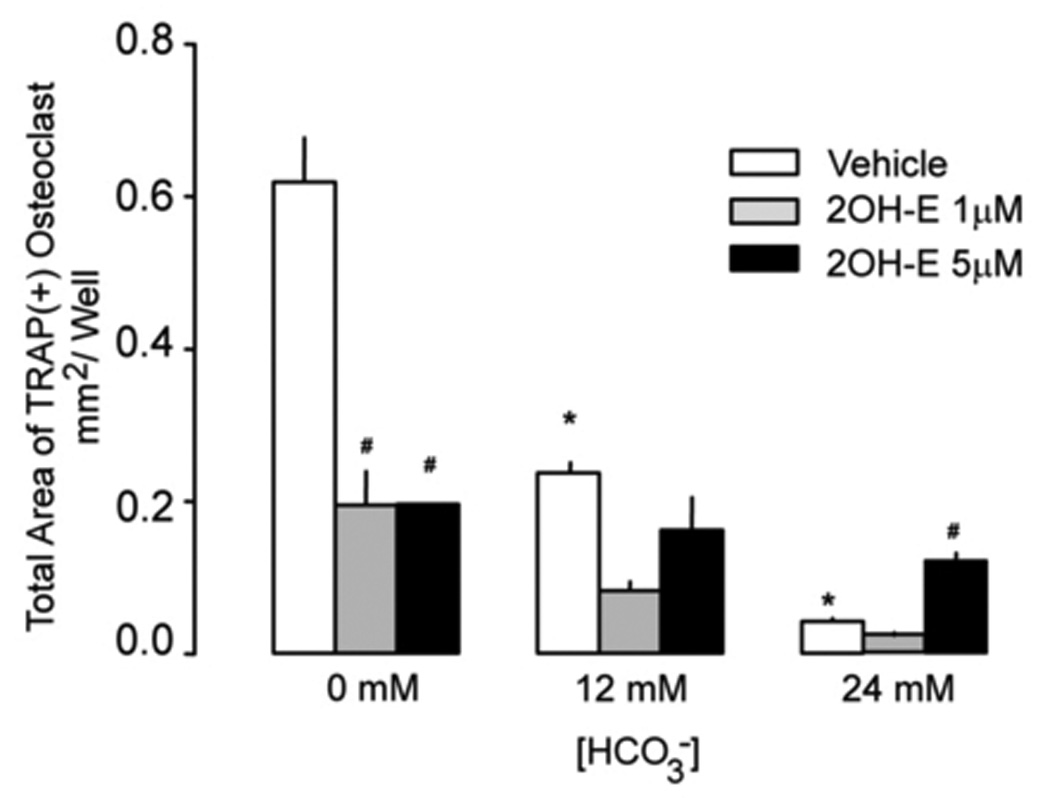
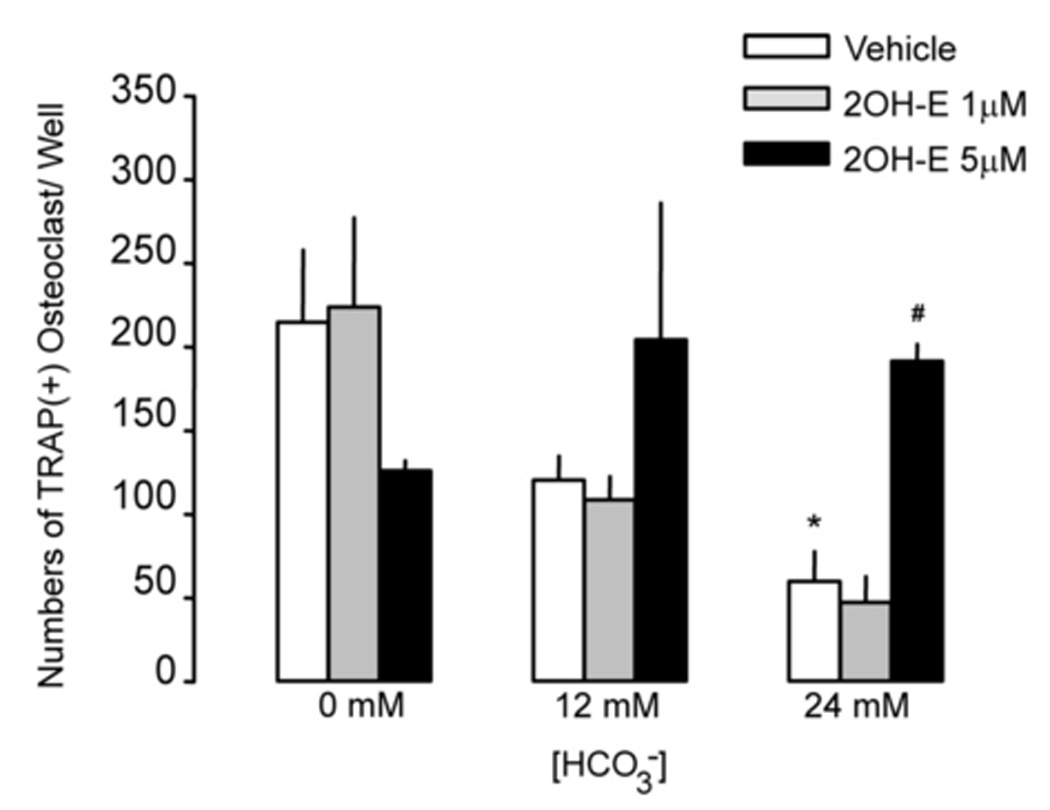
A: RAW264.7 cells were seeded into the 24-well cell culture plates in DMEM media containing 50ng/ml RANKL and 5ng/ml M-CSF for induction of osteoclast differentiation. 0 mM NaHCO3, 12mM NaHCO3, 24 mM NaHCO3, +/− 1 µM, and 5 µM 2-hydroxyestradiol (all pH 7.4) were added for 7 days and cells were fixed and stained for TRAP (pink). Images show representative field from one of a total of four independent experiments. B: Effects of HCO3− on osteoclast size with 0 µM (open bar), 1 µM (gray bar), and 5 µM (black bar) 2-hydroxyestradiol. Four independent experiments were performed and in each one, four areas from each well were randomly selected for imaging. The area of TRAP (+)-multinucleated osteoclasts was determined using Image J software. Bars and error bars represent Means ± SEM from four separate experiments. C: Effects of HCO3− on osteoclast number with 0 µM (open bar), 1 µM (gray bar), and 5 µM (black bar) 2-hydroxyestradiol. Four independent experiments were performed and in each one, four areas from each well were randomly selected for imaging and TRAP (+)-multinucleated osteoclasts were counted and added together. * Significant difference compared to 0 mM HCO3− treated cells (p<0.05). # Significant difference compared to non 2-hydroxyestradiol treated cells (p<0.05)
Inhibition of osteoclast formation by HCO3− is mediated by sAC
When 1 µM 2-hydroxyestradiol was added into cells in the absence of HCO3−, TRAP(+) osteoclasts still formed but the total area of the TRAP(+) multinucleated osteoclast was significantly decreased from 0.619 ± 0.06 to 0.195 ± 0.042 mm2 per well (Fig. 1B). The reduction in total TRAP (+) multinucleated osteoclast area with 5 µM 2-hydroxyestradiol is about the same as 1 µM (Fig. 1B). The effect of 2-hydroxyestradiol in the absence of HCO3− was somewhat surprising but was very consistent. Under the non-physiologic condition of absence of HCO3−, 2-hydroxyextradiol inhibited osteoclasts. Without 2-hydroxyestradiol, 12 mM and 24 mM HCO3− inhibited TRAP(+) multinucleated osteoclast by 61.65% and 93.11% respectively compared to 0 mM HCO3− (open bars Fig. 1B). With 1 µM 2-hydroxyestradiol, 12 mM and 24 mM HCO3− inhibited TRAP(+) multinucleated osteoclast by 57.42 % and 87.55% respectively (grey bars Fig. 1B). With 5 µM 2-hydroxyestradiol, 12 mM and 24 mM HCO3− inhibited TRAP(+) multinucleated osteoclast by only 17.22% and 37.52% respectively (black bars Fig. 1B). Overall, HCO3− retains some inhibitory effects on osteoclast formation even with sAC inhibition but the effects were very much blunted. Similar results were observed for total numbers of TRAP (+) multinucleated osteoclasts (Fig. 1C) but in contrast to TRAP (+) area, number of TRAP (+) osteoclasts was still inhibited by HCO3− at 1µM 2-hydroxyestradiol. However, the HCO3− inhibitory effect was blocked by 5 µM 2-hydroxyestradiol. To rule out whether the effect is simply due to reduction in number of cells, we measured protein content per plate. Under the following four experimental conditions, the protein content per well were: 80 ± 12 µg (12 mM HCO3−, 0 2OH-E) 75 ± 20 µg (24 mM HCO3−, 0 2OH-E) 71 ± 21 µg (12 mM HCO3−, 5µM 2OH-E) 84 ± 10 µg (24 mM HCO3−, 5 µM 2OH-E); mean ± SE, all non-significant by ANOVA. Normalization of study parameters per well or per protein yielded similar results (data not shown).
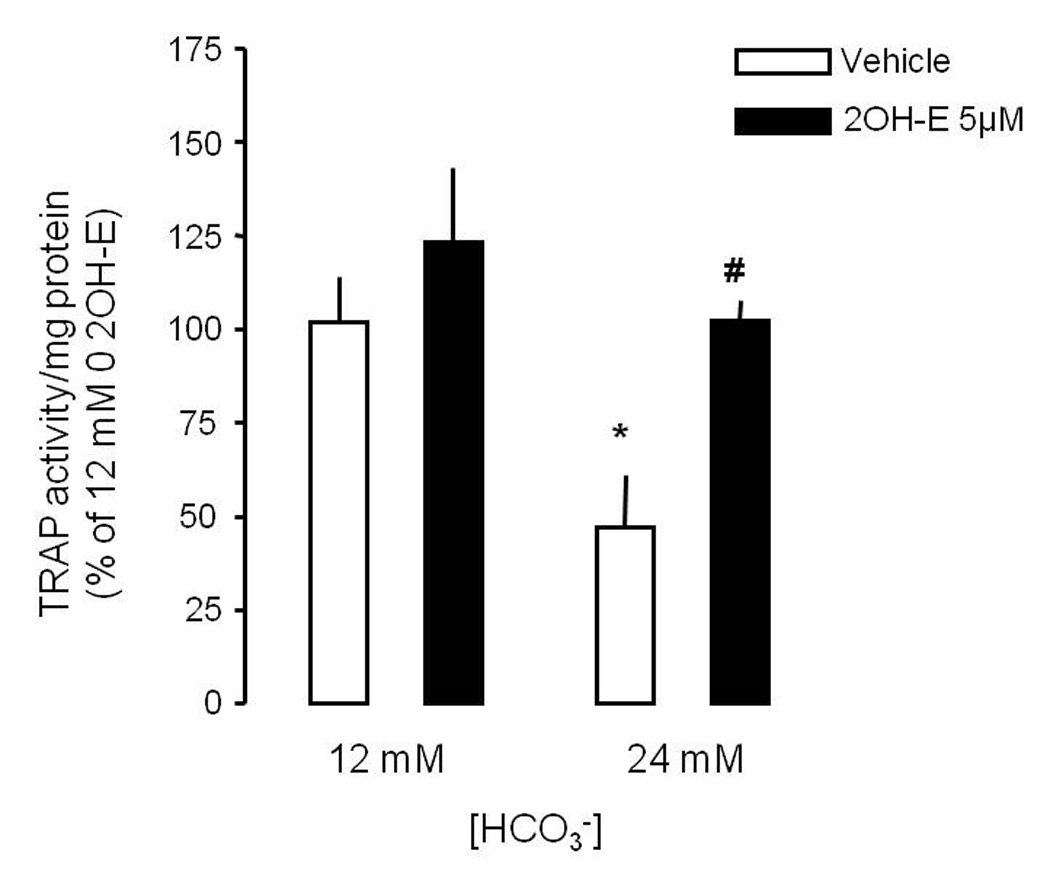
To confirm that the inhibition of osteoclast by HCO3− and reversal with sAC inhibition was tested in osteoclasts harvested and cultured from mouse bone marrow. TRAP activity was inhibited by 24 mM [HCO3−] compared to 12 mM and this effect was blocked by 5 µM 2-hydroxyestradiol.
Soluble AC-specific siRNA decreased sAC expression by about 70% in RAW264.7 cells (Fig. 2B). In 0 mM HCO3−, sAC siRNA decreased total TRAP (+) multinucleated osteoclast area (Fig. 2A) and TRAP activity (Fig. 2C) by about 60%. However, with sAC knock-down, osteoclast area and TRAP activity were not further decreased with 12 mM and 24 mM HCO3− treatment (black bars Fig. 2C). Therefore, knock-down of sAC completely blocked the effect of HCO3− inhibition.
Fig. 2. Effect of sAC siRNA on osteoclast formation.
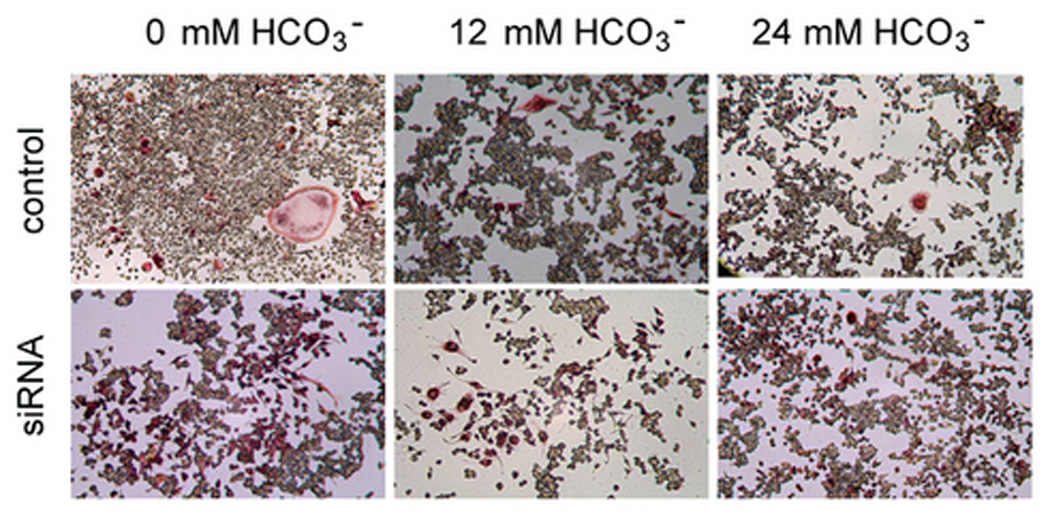
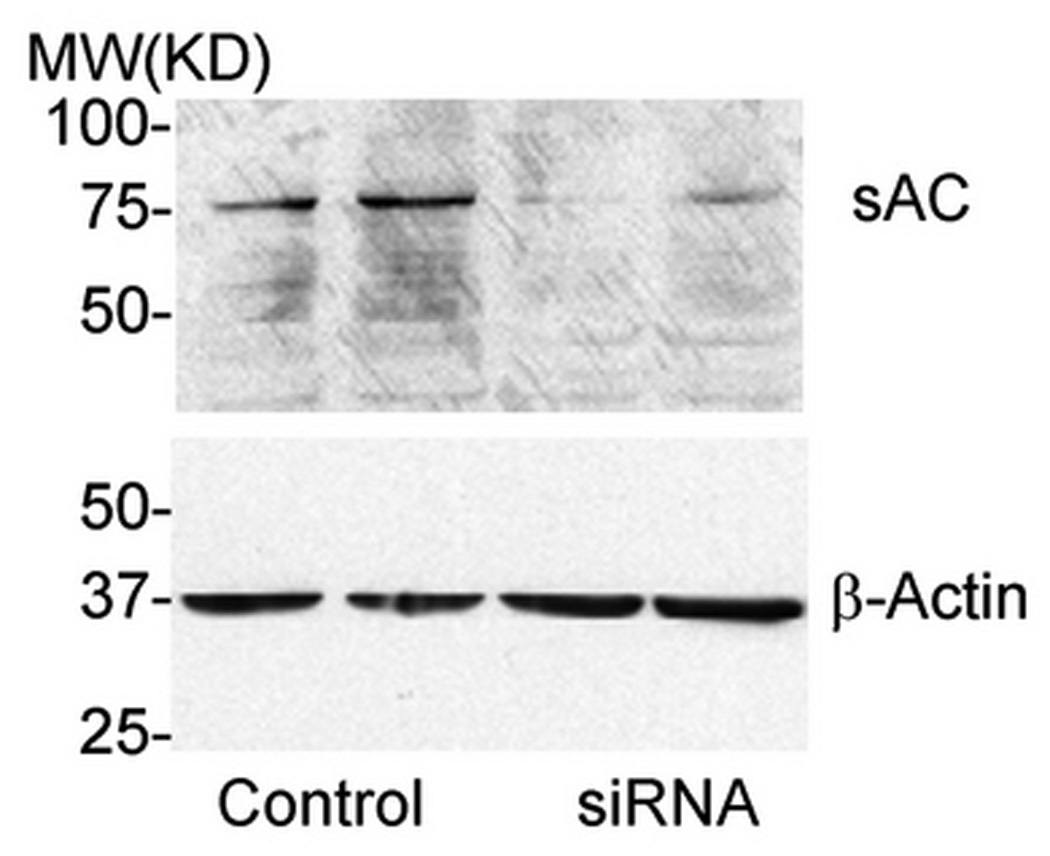
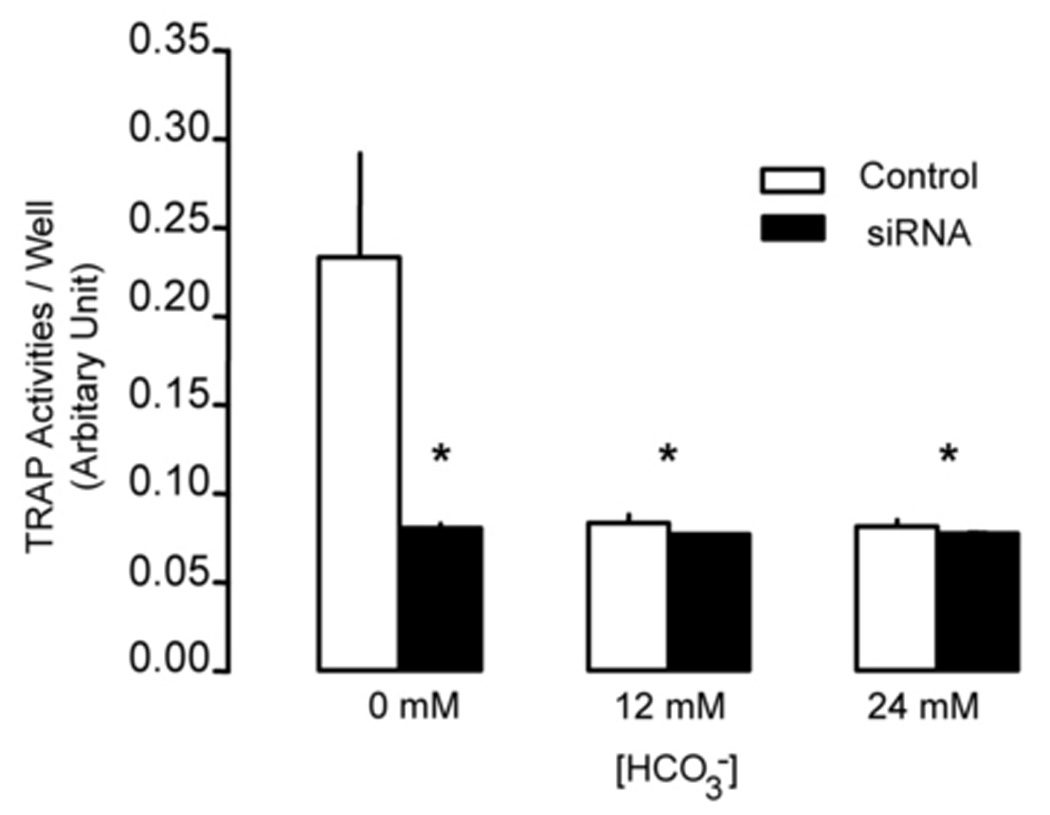
A: RAW264.7 cells were seeded into the 48-well cell culture plates in DMEM media containing 50ng/ml RANKL and 5ng/ml M-CSF for induction of osteoclast differentiation. Then 0 mM NaHCO3, 12mM NaHCO3, 24 mM NaHCO3 (all pH 7.4) were added into the media. On day 2, 100 nM of siRNA of sAC were transfected into the cells. 100 nM of the control siRNA were transfected into the control cells. Cells were cultured for 7 days and then fixed and stained for TRAP (pink). Images show representative cells collected from one of three independent experiments. B: Immunoblot validating siRNA treatment decreased sAC expression in RAW264.7 cells. RAW264.7 cells were transfected with 100nM of either control or sAC siRNA and equal amounts of total cell lysate from two separate wells were analyzed with anti-sAC antibody and the membrane was stripped and reprobed with anti β-actin antibody to verify equal loading. Two independent experiments showed identical results. C: Effect of control siRNA (open bar) and 100 nM siRNA of sAC (black bar) on TRAP activity in osteoclasts. RAW264.7 cells was induced and treated with siRNA on day 2. Cell culture media was collected on day 4 and day 5 and TRAP activity was determined. Bars and error bars represent means ± SEM of four independent experiments. * Significant difference compared to 0 mM HCO3− treated cells (p<0.05).
Effects of HCO3− and sAC on V-ATPase expression in osteoclast
V-ATPase expression in osteoclasts was quantified by both immunofluorescence with anti V-ATPase B subunit antibody in single osteoclast and immunoblot with anti-a3 subunit antibody in total cell lysate. No fluorescence was detected if B antibody was omitted (Fig. 3A, right panel, arrows, Fig. 3A, left panel). When [HCO3−] was increased from 0 to 24mM, cell size was significantly decreased (Fig. 3B, top panel). In the presence of 5 µM 2-hydroxyestradiol, there was no discernible difference from 12, 24 HCO3− (Fig. 3B. bottom panel), a finding consistent with the previous TRAP study (Fig. 1A). There was noticeable variation of the brightness of fluorescence in some osteoclasts. For example, stronger fluorescence was observed in the peripheral region (Top panel, left, Fig. 3B) or perinuclear region (Top panel, middle, Fig. 3B) in some giant osteoclasts. A total of 150 osteoclasts were randomly selected and the mean fluorescence intensity per µm2 area of osteoclast was determined. When [HCO3−] was increased from 0 to 24 mM, mean V-ATPase per µm2 cross-section area was not significantly altered (94.27 ± 12.04, 85.86 ± 12.77, 105.02 ± 22.97 arbitrary unit for 0, 12, 24 mM HCO3− respectively) (open bars Fig. 3C). When the cells were treated with 5 µM 2-hydroxyestradiol, mean V-ATPase per µm2 osteoclast area were not significantly different compared to non 2-hydroxyestradiol treated cells (black bars Fig. 3C). Osteoclasts induced from RAW264.7 cells usually consists of a mixture of multinucleated osteoclast and single RAW cells so lysates from a whole plate can be difficult to interpret. Nonetheless, we observed in total cell lysate a single band about 120 kD using the anti-a3 subunit antibody (Fig. 3D) which is consistent with previous publication (Manolson et al., 2003). Neither HCO3− nor 5 µM 2-hydroxyestradiol treatment had significantly altered the a3 protein level (Fig. 3D).
Fig. 3. sAC and HCO3− regulate V-ATPase on osteoclasts.
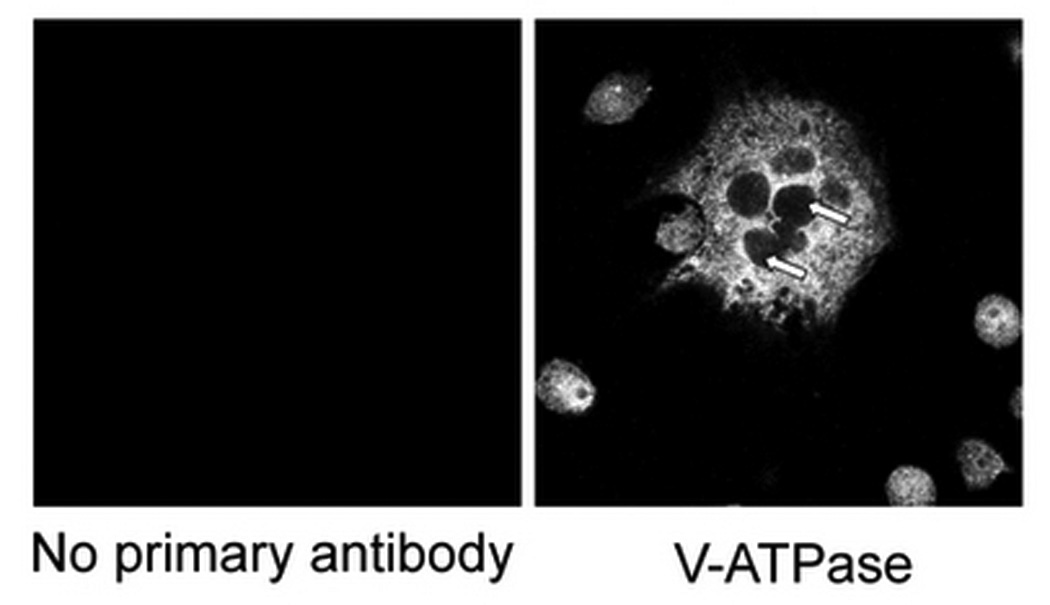
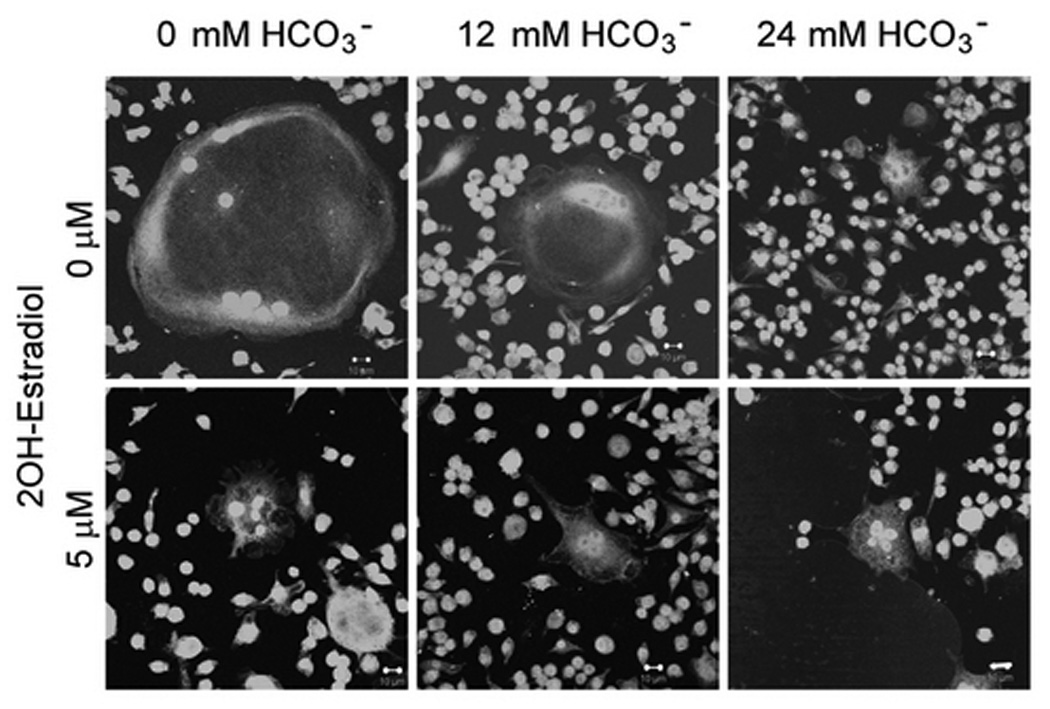
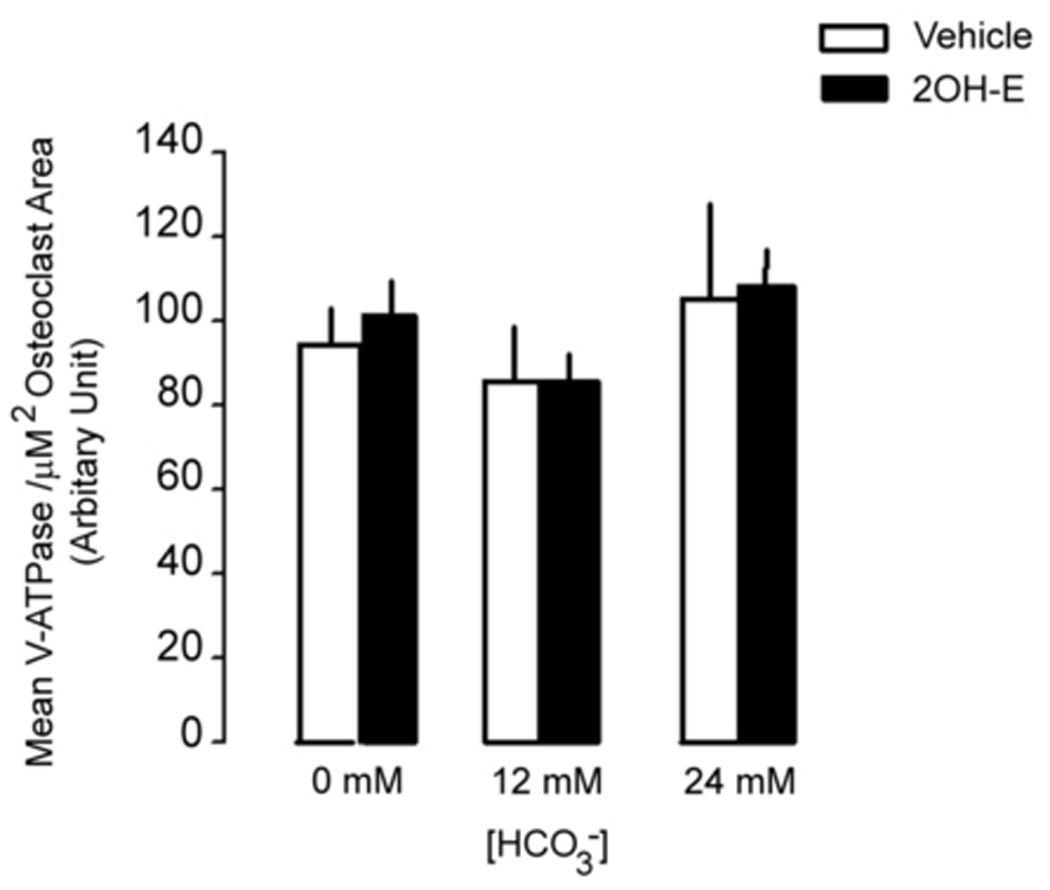
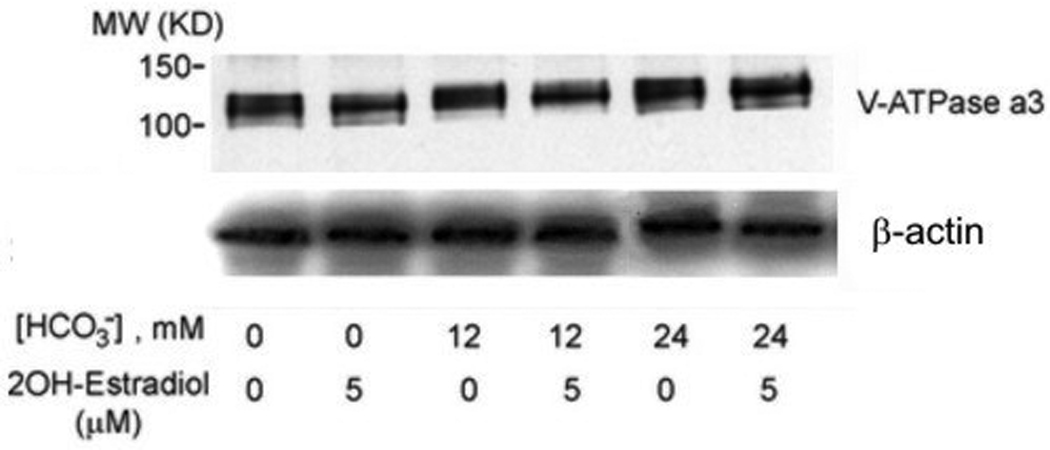
Osteoclasts were induced from RAW264.7 cells (50ng/ml RANKL and 5ng/ml M-CSF), fixed, permeablized, stained with anti-B subunit antibody, and visualized under confocal microscopy. A: V-ATPase is expressed throughout the cell in the cytosol but not in the nuclei (negative staining) of the multinucleated osteoclasts as well as the smaller RAW cells. No fluorescence signal was detected with secondary antibody alone (left panel). B: RAW264.7 cells were seeded into the cell culture plates with glass cover slips and induced with 50 ng/ml RANKL and 5 ng/ml M-CSF. 0 mM HCO3−, 12mM HCO3−, 24mM HCO3−, and +/− 5 µM 2-hydroxyestradiol were added into media for seven days. Cells were then fixed, permeabilized, stained with anti-B subunit antibody and visualized with confocal microscopy. Bar = 10 µm. C: Effects of HCO3− and 2-hydroxyestradiol on V-ATPase (B subunit) expression in single multinucleated osteoclast. Mean fluorescence intensity per µm2 area in osteoclasts was determined by Zeiss LSM image analyzer software. Bars and error bars represent means ± SEM. A total of 150 osteoclasts were randomly selected from 3 independent experiments. D: Effects of HCO3− and 2-hydroxyestradiol on osteoclast-specific a3 subunit expression in the total cell lysate of osteoclast. Induced osteoclasts were collected and 10 µg of total cell lysate was immunoblotted. β-actin served as loading control. One representative blot is shown; total of three showed similar results.
Effects of HCO3− and sAC on H+ accumulation in live osteoclast
H+ production in osteoclast was measured by acridine orange (AO) trapping in live osteoclast. Osteoclasts were visualized with a series z stack live cell images using laser confocal microscope. In Fig. 4A, a large multinucleated osteoclast in the middle of the image displayed polarized distribution of acid granules. Acid granules in orange color (arrows) mainly resided at the bottom part of the cells (left panel). Many hollow circles or irregular shape regions were seen. Multiple nuclei in green color (open arrows) were located from middle to top part of the cell (Fig. 4A, right panel). Several small RAW264.7 cells also contained some orange granules. We took advantage of the polarized distribution of the acid granules to visualize H+ accumulation in single live osteoclast by only measuring the stacks of x–y planes that contained the orange granules. These planes usually did not have nuclei that avoided the potential false positive results caused by RNA-bound AO. Increasing [HCO3−] from 0 to 24 mM did not significantly alter the density and brightness of the acid granules (Fig 4B. top panel). In the presence of 5 µM 2-hydroxyestradiol, there was no noticeable difference for the density and brightness of the acid granules (Fig. 4B, bottom panel). In the absence of 2-hydroxyestradiol, 12 mM and 24 mM HCO3− did not significantly change the mean H+ accumulation per µm2 osteoclast area (open bars Fig 4C). With 5 µM 2-hydroxyestradiol, 12 mM and 24 mM HCO3− inhibited mean H+ accumulation per µm2 osteoclast area by 35.65% and 28.20% respectively (black bars Fig. 4C) but it was not statistically significant.
Fig. 4. Effect of sAC and HCO3− on H+ accumulation in osteoclasts.
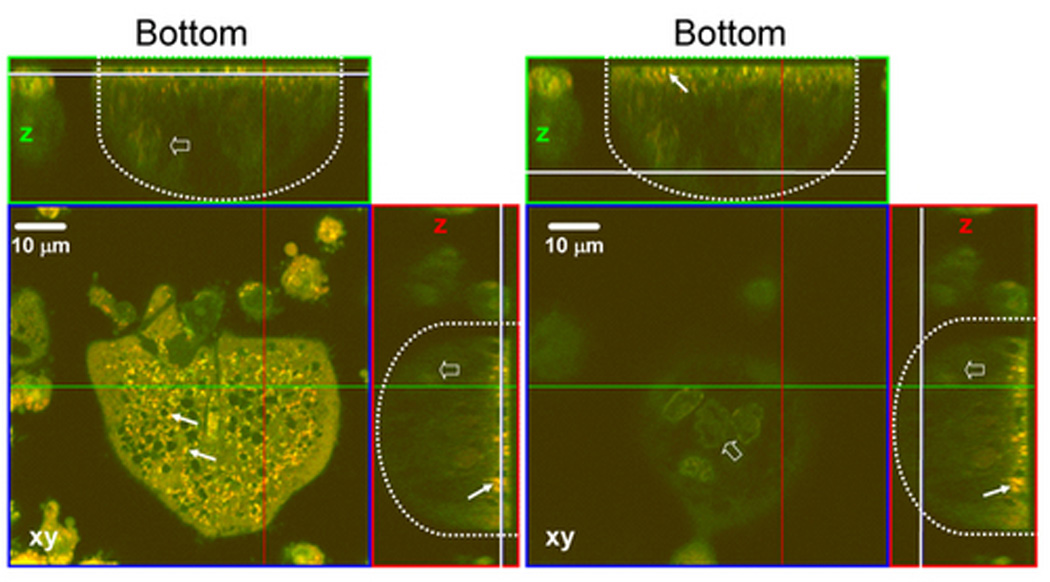
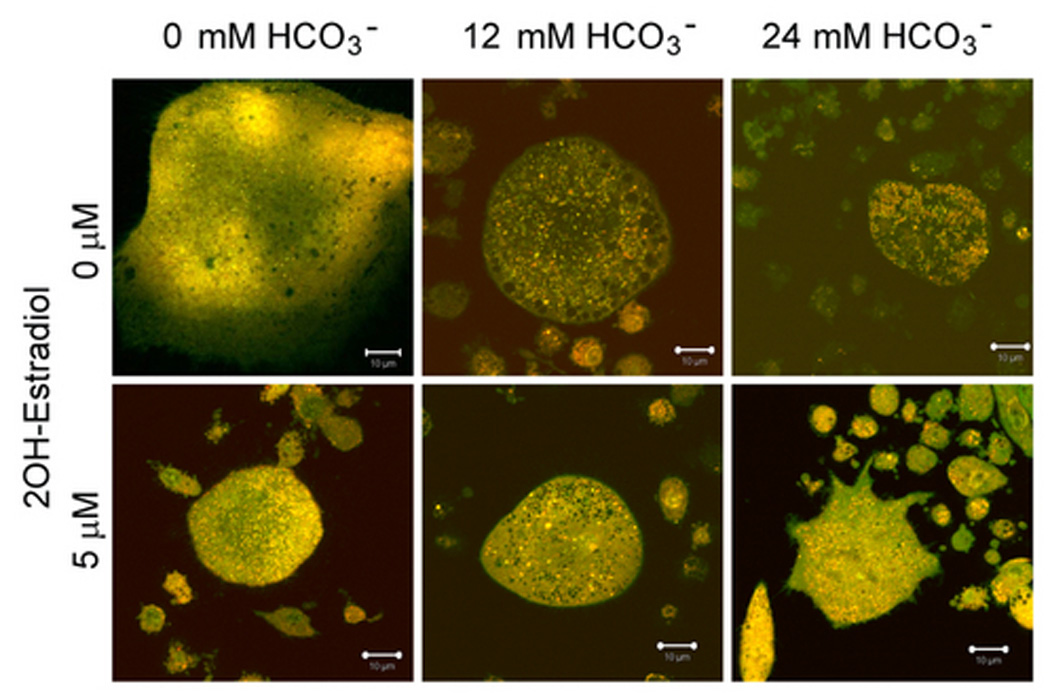
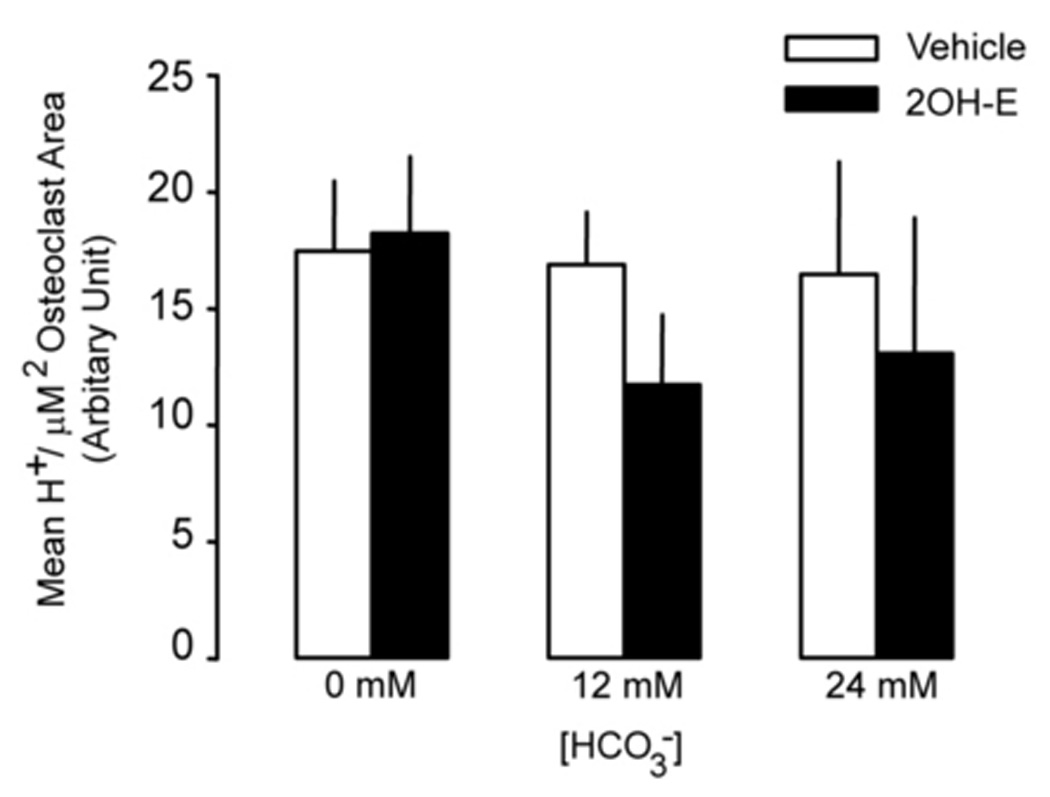
Osteoclasts were induced from RAW264.7 cells (50 ng/ml RANKL and 5 ng/ml M-CSF). Acridine orange was added into the culture media for 20 minutes, cells were washed with PBS, and live cell images were collected with a Zeiss LSM510 confocal microscope (krypton/argon laser λex 488nm, λem 510–540nm for un-protonated AO, λem 590–650nm for protonated AO). A: xy-plane of lower part of cell (left panel) and upper part of cell (right panel) of a typical osteoclast. Proton granules (arrows in z cut) in orange are mainly located in the lower part of the cell. xy, x–y section; z, z section; dotted line outlines the osteoclast; white line, position for x–y plane; green line, z section for the top panel; red line, z section for the right panel. B: RAW264.7 cells were exposed to 0 mM HCO3−, 12 mM HCO3−, and 24 mM HCO3− and +/− 5 µM 2-hydroxyestradiol. Cells took up acridine orange and live z-stack confocal images were collected of the proton granules. Bar = 10 µm. C: Quantitation of protonated AO. Bars and error bars represent means ± SEM for the effects of HCO3− (open bar) and 2-hydroxyestradiol (solid bar) on H+ per osteoclast from three separate experiments. A total of 90 osteoclasts were randomly selected and analyzed from each of three independent experiments.
Effects of cAMP on osteoclast function and differentiation
sAC converts ATP to cyclic adenosine monophosphate (cAMP) that serves as the second messenger to downstream effectors. If the inhibitory effect of HCO3− on osteoclast is mediated by sAC, it is reasonable to assume that cAMP is involved in this pathway. To test this hypothesis, we studied the effects of 8-bromo-cAMP, a cell permeant cAMP analog, on osteoclast function and differentiation. The effects of increasing [HCO3−] (open bars Fig. 5B) and 5 µM 2-hydroxyestradiol (light gray bar Fig. 5B) were similar to that described in the previous experiment. When 0.1mM 8-bromo-cAMP was added in the absence of HCO3−, total area of the TRAP (+) multinucleated osteoclast was significantly decreased from 0.345 ± 0.024 to 0.059 ± 0.013 (black bar Fig. 5B). When both 5 µM 2-hydroxyestradiol and 0.1 mM 8-bromo-cAMP was added into cells in the absence of HCO3−, total area of the TRAP(+) multinucleated osteoclast was significantly decreased from 0.345 ± 0.024 to 0.024 ± 0.003 (dark gray bar Fig. 5B) so sAC inhibition did not block the inhibitory effect of cAMP. For total cell numbers of the TRAP (+) osteoclasts, we saw a trend that cell numbers were reduced by increasing the [HCO3−] from 0 to 24 mM. This effect was blocked by 8-bromo-cAMP (data not shown). These results are compatible with the model of cAMP being downstream of sAC and the sAC mediates the effect of HCO3− on osteoclasts.
Fig. 5. Effects of 8-bromo-cAMP on osteoclasts.
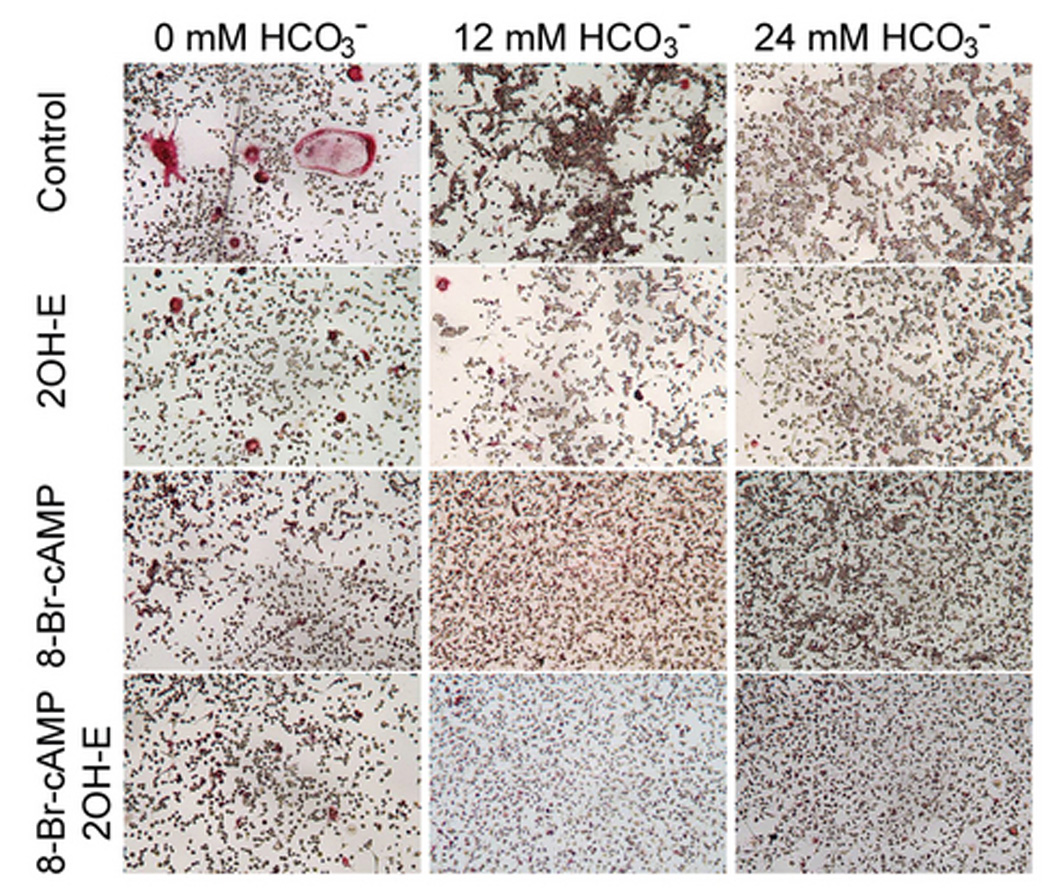
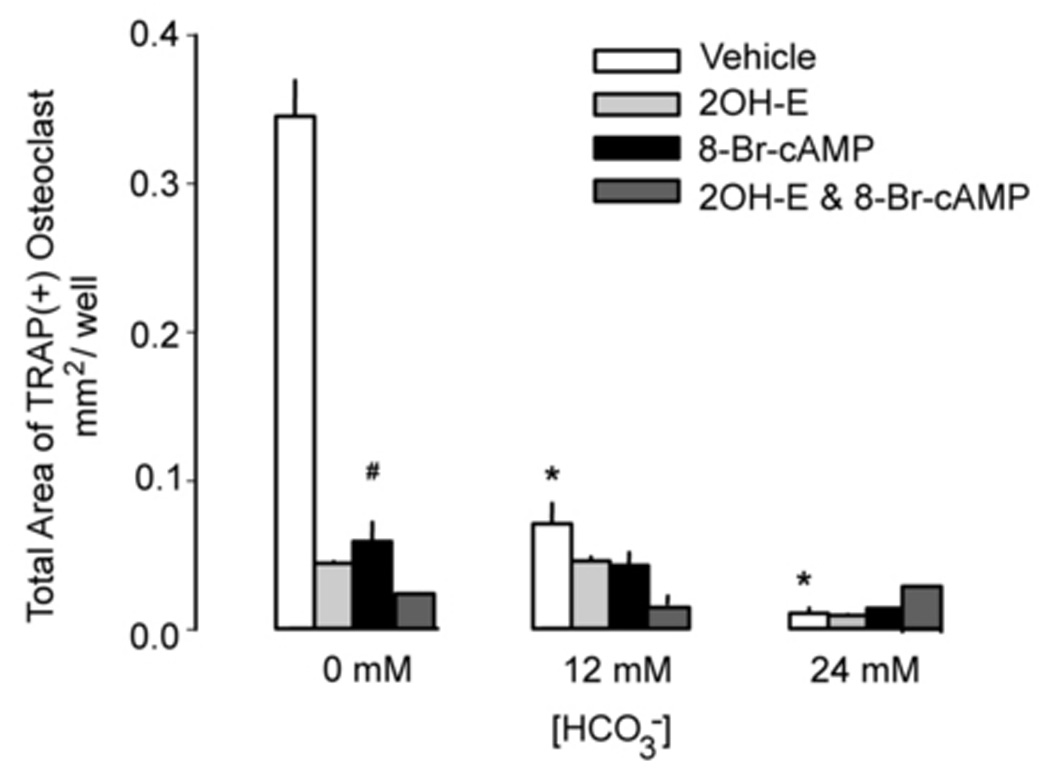
RAW264.7 cells were seeded into the 48-well cell culture plates and induced with 50ng/ml RANKL and 5ng/ml M-CSF. Three variables were examined- [HCO3−] (0, 12, and 24 mM), 2-hydroxyestradiol (5 µM) and 8-Br-cAMP (0.1 mM) A. Cells were cultured for 7 days, fixed and stained for TRAP (pink). Images show representative cells collected from one of four independent experiments. B: Effects of HCO3− on osteoclast size in the background of vehicle (open), 5 µM 2-hydroxyestradiol (light gray), 0.1 mM 8-bromo-cAMP (black), 5 µM 2-hydroxyestradiol & 0.1 mM 8-bromo-cAMP (dark gray). Four images from each well were randomly selected from each of four independent experiments. The area of each TRAP(+)-multinucleated osteoclast was determined using ImageJ software. Bars and error bars represent means ± SEM. * Significant difference compared to 0 mM HCO3− treated cells (p<0.05).
HCO3− effect on calvaria bone mass in vitro
To confirm the in vitro cell culture effect is reproducible in intact bone, we used a one week mouse calvaria culture system. To minimize the inter-individual variation, we used paired calvaria from the same mouse for comparison of two different ambient HCO3− concentrations. Following one week culture, multinucleated osteoclasts were observed attached to the trabecular bone surface in the non-decalcified and toluidine blue stained bone section (Fig. 6A arrows) indicating viability. Total volume (TV), bone volume (BV), marrow volume (MV), bone surface (BS), and bone volume density (BV/TV) were measured by µCT analysis. Parameters for trabecular bone such as trabecular bone thickness, trabecular space, trabecular bone volume could not be determined due to under-developed trabecular bone in these young mice (Fig. 6B). BV/TV of the 24mM HCO3− treated calvaria (80.49 ± 3.64%) was higher than BV/TV of 12mM HCO3− treated calvaria (75.18 ± 4.89%) (Fig. 6C left panel). In this group, seven out of nine pairs of calvaria in 24mM HCO3− treated group had higher BV/TV (Fig. 6C left panel). One pair of calvaria had significantly low BV/TV likely due to the much younger age and smaller body mass. Nevertheless, it still demonstrated higher BV/TV with 24 mM HCO3−. In the presence of 2-hydroxyestradiol, BV/TV of the 24mM HCO3− treated calvaria (84.54 ± 2.21%) was not significantly different from that of 12mM HCO3− treated calvaria (85.45 ± 1.25%) (Fig. 6C, right panel). In this group, there was no consistent difference between 12 and 24 mM HCO3−. This data suggest that inhibition of bone resorption by HCO3− is dependent on intact sAC.
Fig. 6. Effect of HCO3− and sAC on bone mass in cultured mouse calvaria.
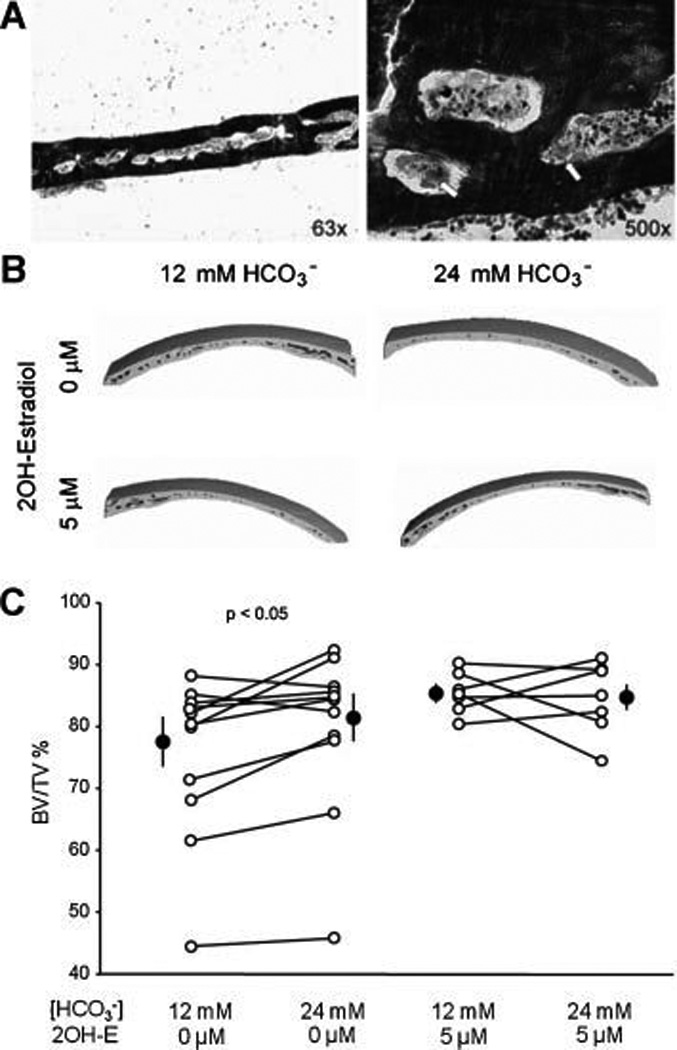
A: Toluidine blue staining of coronal section of mouse calvaria at low (left panel) and high (right panel) magnification from 8–9 week old mouse following one week culture. Osteoclasts (arrow) are attached to the trabecular bone surface. Image is one representative from eight calvaria analyzed. B: Three dimensional reconstructions of the partial mouse calvaria from µCT. Calvaria are cultured with 12mM or 24 mM HCO3− +/− 2-hydroxyestradiol for one week, then fixed with ethanol and µCT was performed. Images are representative of 16 mice. C: Line graphs summarize the HCO3− effect on the BV/TV% of mouse calvaria without (left panel) and with 2-hydroxyestradiol (right panel). Each line connects the two paired calvaria from the same mouse. Solid circles: mean ± SEM. P value is from paired t test.
Discussion
Osteoclasts are formed by fusion of precursors into multinucleated large cells under the control of RANK/RANKL/OPG system (Khosla, 2001; Lacey et al., 1998; Simonet et al., 1997; Takahashi et al., 1999; Yasuda et al., 1998). Osteoclast-mediated bone resorption starts with attachment to bone surface, formation of ruffled border and sealing zone, H+ and lysosomal enzymes secretion, and resorption of bone matrix (Roodman, 1999). V-ATPase provides the primary H+-translocation mechanism on the ruffled border of the osteoclast to deliver H+ to the bone surface (Roodman, 1999). Generation of H+ and HCO3− is catalyzed by carbonic anhydrase II and HCO3−/Cl− exchange mediates HCO3− exit. Whereas ambient [HCO3−] can theoretically regulate osteoclast H+ secretion by a kinetic effect on the base exit step, another possibility is a direct effect on osteoclast formation and function.
We demonstrated that reducing [HCO3−] from 24 towards 0 mM, osteoclast number and size significantly increased. In 0 mM [HCO3−], there were clearly larger cells with more nuclei in the large multinucleated osteoclasts likely due to more precursors fused together rather then osteoclast spreading. Increased precursor fusion would result in larger osteoclasts covering a larger area of the bone matrix and results in higher bone resorption (Rhee et al., 2006). Mean V-ATPase per µm2 area of osteoclast or mg cell protein and mean H+ accumulation per µm2 area of osteoclast were not changed indicating that once an osteoclast is formed, HCO3− does not directly regulate V-ATPase expression, distribution, or activity. It appears that total V-ATPase expression and its activity are simply proportional to the size of the osteoclast. This observation in osteoclasts is quite different from the finding in epithelial cells from rat cauda epididymidis where sAC mediates the V-ATPase (Pastor-Soler et al., 2003). sAC co-localizes with V-ATPase in the clear cells of the rat testis and the intercalated cells of the rat kidney The HCO3−-regulated V-ATPase recycling between intracellular vesicles and apical membrane was blocked by sAC inhibitor (Pastor-Soler et al., 2003). This represents a fundamental difference in sAC action between these organs. In the osteoclast, sAC mediates a more chronic effect of HCO3− on osteoclast size whereas in the testis and collecting duct, it mediates the acute effects of HCO3− on H+ translocation and pumping by the V-ATPase.
Using a sAC inhibitor, 2-hydroxyestradiol (Pastor-Soler et al., 2003), and sAC-specific siRNA, we showed that sAC is involved in the regulation of osteoclast formation and function by HCO3−. Increasing [HCO3−] isohydrically from 0 to 24 mM decreased the osteoclast number and size. Both sAC-specific inhibitor and sAC-specific siRNA blocked most but not all of the HCO3− effect. In addition, 8-bromo-cAMP, a permeable analog of cAMP representing a downstream effector of sAC, inhibited osteoclasts to a similar degree as HCO3−. Moreoever, in the presence of 8-bromo-cAMP, neither HCO3− nor sAC inhibition has much effect on TRAP. In the calvaria culture system, lowering [HCO3−] from 24 to 12 mM decreased the bone mass that was also blocked by sAC inhibitor. It is important to note that in whole organ culture, the change in bone mass can be due to osteoclast or osteoblast effects. These findings in concert strongly support that the effect of HCO3− on bone is through modulating osteoclast formation mediated by sAC.
An unexpected finding was that in the absence of HCO3−, inhibition of sAC by either 2-hydroxyestradiol or sAC knock-down significantly inhibited osteoclast formation. This is clearly not a HCO3−dependent effect of sAC. The significance of this effect is not clear because in physiologic conditions, osteoclasts never exist in total absence of ambient HCO3−. One possibility is that 2-hydroxyestradiol may have a direct inhibitory effect on osteoclast independent of sAC. However, the parallel finding of sAC siRNA suggests that sAC may have some functions other than HCO3−-stimulated cyclase activity on osteoclast and the zero HCO3− simply unmasked this effect. The sAC protein spans over 1610 amino acids and only the 483 amino acid N-terminal domains is required for HCO3− stimulated cyclase activity (11). It is conceivable that other functional domains exist that can potentially regulate osteoclast function.
In summary, low [HCO3−] can increase bone loss by physico-chemical effects on the bone matrix and by biologic pathways via bone forming and resorbing cells. One such mechanism is that low [HCO3−] activates osteoclast formation and function mediated largely by sAC.
Acknowledgements
This work was supported by National Institute of Health Grant P01-DK-20543, O’Brien Kidney Center (P30-DK079328), seed funds from the Charles & Jane Pak Center for Mineral Metabolism and Clinical Research, and the Simmons Family Foundation. We like to thank Dr. Beth S. Lee (Ohio State University, Columbus, OH) for providing anti V-ATPase a3 antibody, Dr. Xiao-Song Xie (UT Southwestern Medical Center, Dallas, TX) for providing anti V-ATPase pan-B antibody, and Dr. Yihong Wan (UT Southwestern Medical Center, Dallas, TX) for advising us on primary culture of osteoclasts.
References
- Arnett TR, Dempster DW. Protons and osteoclasts. J Bone Miner Res. 1990;5(11):1099–1103. doi: 10.1002/jbmr.5650051102. [DOI] [PubMed] [Google Scholar]
- Battaglino R, Vokes M, Schulze-Spate U, Sharma A, Graves D, Kohler T, Muller R, Yoganathan S, Stashenko P. Fluoxetine treatment increases trabecular bone formation in mice. J Cell Biochem. 2007;100(6):1387–1394. doi: 10.1002/jcb.21131. [DOI] [PubMed] [Google Scholar]
- Beranger GE, Momier D, Rochet N, Quincey D, Guigonis JM, Samson M, Carle GF, Scimeca JC. RANKL treatment releases the negative regulation of the poly(ADP-ribose) polymerase-1 on Tcirg1 gene expression during osteoclastogenesis. J Bone Miner Res. 2006;21(11):1757–1769. doi: 10.1359/jbmr.060809. [DOI] [PubMed] [Google Scholar]
- Buck J, Sinclair ML, Schapal L, Cann MJ, Levin LR. Cytosolic adenylyl cyclase defines a unique signaling molecule in mammals. Proceedings of the National Academy of Sciences of the United States of America. 1999;96(1):79–84. doi: 10.1073/pnas.96.1.79. [DOI] [PMC free article] [PubMed] [Google Scholar]
- Buclin T, Cosma M, Appenzeller M, Jacquet AF, Decosterd LA, Biollaz J, Burckhardt P. Diet acids and alkalis influence calcium retention in bone. Osteoporos Int. 2001;12(6):493–499. doi: 10.1007/s001980170095. [DOI] [PubMed] [Google Scholar]
- Bushinsky DA. Stimulated osteoclastic and suppressed osteoblastic activity in metabolic but not respiratory acidosis. Am J Physiol. 1995;268(1 Pt 1):C80–C88. doi: 10.1152/ajpcell.1995.268.1.C80. [DOI] [PubMed] [Google Scholar]
- Bushinsky DA. Metabolic alkalosis decreases bone calcium efflux by suppressing osteoclasts and stimulating osteoblasts. Am J Physiol. 1996;271(1 Pt 2):F216–F222. doi: 10.1152/ajprenal.1996.271.1.F216. [DOI] [PubMed] [Google Scholar]
- Bushinsky DA. Acid-base imbalance and the skeleton. Eur J Nutr. 2001;40(5):238–244. doi: 10.1007/s394-001-8351-5. [DOI] [PubMed] [Google Scholar]
- Chen Y, Cann MJ, Litvin TN, Iourgenko V, Sinclair ML, Levin LR, Buck J. Soluble adenylyl cyclase as an evolutionarily conserved bicarbonate sensor. Science. 2000;289(5479):625–628. doi: 10.1126/science.289.5479.625. [DOI] [PubMed] [Google Scholar]
- Esposito G, Jaiswal BS, Xie F, Krajnc-Franken MA, Robben TJ, Strik AM, Kuil C, Philipsen RL, van Duin M, Conti M, Gossen JA. Mice deficient for soluble adenylyl cyclase are infertile because of a severe sperm-motility defect. Proceedings of the National Academy of Sciences of the United States of America. 2004;101(9):2993–2998. doi: 10.1073/pnas.0400050101. [DOI] [PMC free article] [PubMed] [Google Scholar]
- Geng W, Wang Z, Zhang J, Reed BY, Pak CY, Moe OW. Cloning and characterization of the human soluble adenylyl cyclase. Am J Physiol Cell Physiol. 2005;288(6):C1305–C1316. doi: 10.1152/ajpcell.00584.2004. [DOI] [PubMed] [Google Scholar]
- Goldhaber P, Rabadjija L. H+ stimulation of cell-mediated bone resorption in tissue culture. Am J Physiol. 1987;253(1 Pt 1):E90–E98. doi: 10.1152/ajpendo.1987.253.1.E90. [DOI] [PubMed] [Google Scholar]
- Hildebrand T, Laib A, Muller R, Dequeker J, Ruegsegger P. Direct three-dimensional morphometric analysis of human cancellous bone: microstructural data from spine, femur, iliac crest, and calcaneus. J Bone Miner Res. 1999;14(7):1167–1174. doi: 10.1359/jbmr.1999.14.7.1167. [DOI] [PubMed] [Google Scholar]
- Kawano H, Sato T, Yamada T, Matsumoto T, Sekine K, Watanabe T, Nakamura T, Fukuda T, Yoshimura K, Yoshizawa T, Aihara K, Yamamoto Y, Nakamichi Y, Metzger D, Chambon P, Nakamura K, Kawaguchi H, Kato S. Suppressive function of androgen receptor in bone resorption. Proc Natl Acad Sci U S A. 2003;100(16):9416–9421. doi: 10.1073/pnas.1533500100. [DOI] [PMC free article] [PubMed] [Google Scholar]
- Khosla S. Minireview: the OPG/RANKL/RANK system. Endocrinology. 2001;142(12):5050–5055. doi: 10.1210/endo.142.12.8536. [DOI] [PubMed] [Google Scholar]
- Kraut JA, Mishler DR, Singer FR, Goodman WG. The effects of metabolic acidosis on bone formation and bone resorption in the rat. Kidney Int. 1986;30(5):694–700. doi: 10.1038/ki.1986.242. [DOI] [PubMed] [Google Scholar]
- Krieger NS, Sessler NE, Bushinsky DA. Acidosis inhibits osteoblastic and stimulates osteoclastic activity in vitro. Am J Physiol. 1992;262(3 Pt 2):F442–F448. doi: 10.1152/ajprenal.1992.262.3.F442. [DOI] [PubMed] [Google Scholar]
- Lacey DL, Timms E, Tan HL, Kelley MJ, Dunstan CR, Burgess T, Elliott R, Colombero A, Elliott G, Scully S, Hsu H, Sullivan J, Hawkins N, Davy E, Capparelli C, Eli A, Qian YX, Kaufman S, Sarosi I, Shalhoub V, Senaldi G, Guo J, Delaney J, Boyle WJ. Osteoprotegerin ligand is a cytokine that regulates osteoclast differentiation and activation. Cell. 1998;93(2):165–176. doi: 10.1016/s0092-8674(00)81569-x. [DOI] [PubMed] [Google Scholar]
- Lee FY, Kim DW, Karmin JA, Hong D, Chang SS, Fujisawa M, Takayanagi H, Bigliani LU, Blaine TA, Lee HJ. mu-Calpain regulates receptor activator of NF-kappaB ligand (RANKL)-supported osteoclastogenesis via NF-kappaB activation in RAW 264.7 cells. The Journal of biological chemistry. 2005;280(33):29929–29936. doi: 10.1074/jbc.M414600200. [DOI] [PubMed] [Google Scholar]
- Manolson MF, Yu H, Chen W, Yao Y, Li K, Lees RL, Heersche JN. The a3 isoform of the 100-kDa V-ATPase subunit is highly but differentially expressed in large (>or=10 nuclei) and small (<or= nuclei) osteoclasts. The Journal of biological chemistry. 2003;278(49):49271–49278. doi: 10.1074/jbc.M309914200. [DOI] [PubMed] [Google Scholar]
- New SA. Bone health: the role of micronutrients. Br Med Bull. 1999;55(3):619–633. doi: 10.1258/0007142991902501. [DOI] [PubMed] [Google Scholar]
- New SA, Robins SP, Campbell MK, Martin JC, Garton MJ, Bolton-Smith C, Grubb DA, Lee SJ, Reid DM. Dietary influences on bone mass and bone metabolism: further evidence of a positive link between fruit and vegetable consumption and bone health? Am J Clin Nutr. 2000;71(1):142–151. doi: 10.1093/ajcn/71.1.142. [DOI] [PubMed] [Google Scholar]
- Osdoby P, Martini MC, Caplan AI. Isolated osteoclasts and their presumed progenitor cells, the monocyte, in culture. J Exp Zool. 1982;224(3):331–344. doi: 10.1002/jez.1402240306. [DOI] [PubMed] [Google Scholar]
- Osther PJ, Bollerslev J, Hansen AB, Engel K, Kildeberg P. Pathophysiology of incomplete renal tubular acidosis in recurrent renal stone formers: evidence of disturbed calcium, bone and citrate metabolism. Urol Res. 1993;21(3):169–173. doi: 10.1007/BF00590032. [DOI] [PubMed] [Google Scholar]
- Pak CY, Heller HJ, Pearle MS, Odvina CV, Poindexter JR, Peterson RD. Prevention of stone formation and bone loss in absorptive hypercalciuria by combined dietary and pharmacological interventions. J Urol. 2003;169(2):465–469. doi: 10.1097/01.ju.0000047341.55340.19. [DOI] [PubMed] [Google Scholar]
- Pastor-Soler N, Beaulieu V, Litvin TN, Da Silva N, Chen Y, Brown D, Buck J, Levin LR, Breton S. Bicarbonate-regulated adenylyl cyclase (sAC) is a sensor that regulates pH-dependent V-ATPase recycling. The Journal of biological chemistry. 2003;278(49):49523–49529. doi: 10.1074/jbc.M309543200. [DOI] [PMC free article] [PubMed] [Google Scholar]
- Preminger GM, Harvey JA, Pak CY. Comparative efficacy of "specific" potassium citrate therapy versus conservative management in nephrolithiasis of mild to moderate severity. J Urol. 1985;134(4):658–661. doi: 10.1016/s0022-5347(17)47371-x. [DOI] [PubMed] [Google Scholar]
- Reed BY, Heller HJ, Gitomer WL, Pak CY. Mapping a gene defect in absorptive hypercalciuria to chromosome 1q23.3-q24. J Clin Endocrinol Metab. 1999;84(11):3907–3913. doi: 10.1210/jcem.84.11.6155. [DOI] [PubMed] [Google Scholar]
- Rhee EJ, Oh KW, Lee WY, Kim SY, Jung CH, Kim BJ, Sung KC, Kim BS, Kang JH, Lee MH, Kim SW, Park JR. The differential effects of age on the association of KLOTHO gene polymorphisms with coronary artery disease. Metabolism. 2006;55(10):1344–1351. doi: 10.1016/j.metabol.2006.05.020. [DOI] [PubMed] [Google Scholar]
- Roodman GD. Cell biology of the osteoclast. Exp Hematol. 1999;27(8):1229–1241. doi: 10.1016/s0301-472x(99)00061-2. [DOI] [PubMed] [Google Scholar]
- Rousselle AV, Heymann D. Osteoclastic acidification pathways during bone resorption. Bone. 2002;30(4):533–540. doi: 10.1016/s8756-3282(02)00672-5. [DOI] [PubMed] [Google Scholar]
- Simonet WS, Lacey DL, Dunstan CR, Kelley M, Chang MS, Luthy R, Nguyen HQ, Wooden S, Bennett L, Boone T, Shimamoto G, DeRose M, Elliott R, Colombero A, Tan HL, Trail G, Sullivan J, Davy E, Bucay N, Renshaw-Gegg L, Hughes TM, Hill D, Pattison W, Campbell P, Sander S, Van G, Tarpley J, Derby P, Lee R, Boyle WJ. Osteoprotegerin: a novel secreted protein involved in the regulation of bone density. Cell. 1997;89(2):309–319. doi: 10.1016/s0092-8674(00)80209-3. [DOI] [PubMed] [Google Scholar]
- Srivastava S, Toraldo G, Weitzmann MN, Cenci S, Ross FP, Pacifici R. Estrogen decreases osteoclast formation by down-regulating receptor activator of NF-kappa B ligand (RANKL)-induced JNK activation. The Journal of biological chemistry. 2001;276(12):8836–8840. doi: 10.1074/jbc.M010764200. [DOI] [PubMed] [Google Scholar]
- Takahashi N, Udagawa N, Suda T. A new member of tumor necrosis factor ligand family, ODF/OPGL/TRANCE/RANKL, regulates osteoclast differentiation and function. Biochem Biophys Res Commun. 1999;256(3):449–455. doi: 10.1006/bbrc.1999.0252. [DOI] [PubMed] [Google Scholar]
- Tucker KL, Hannan MT, Chen H, Cupples LA, Wilson PW, Kiel DP. Potassium, magnesium, and fruit and vegetable intakes are associated with greater bone mineral density in elderly men and women. Am J Clin Nutr. 1999;69(4):727–736. doi: 10.1093/ajcn/69.4.727. [DOI] [PubMed] [Google Scholar]
- Wan Y, Chong LW, Evans RM. PPAR-gamma regulates osteoclastogenesis in mice. Nat Med. 2007;13(12):1496–1503. doi: 10.1038/nm1672. [DOI] [PubMed] [Google Scholar]
- Wittrant Y, Theoleyre S, Couillaud S, Dunstan C, Heymann D, Redini F. Relevance of an in vitro osteoclastogenesis system to study receptor activator of NF-kB ligand and osteoprotegerin biological activities. Experimental cell research. 2004;293(2):292–301. doi: 10.1016/j.yexcr.2003.10.016. [DOI] [PubMed] [Google Scholar]
- Yang JH, Amoui M, Lau KH. Targeted deletion of the osteoclast protein-tyrosine phosphatase (PTP-oc) promoter prevents RANKL-mediated osteoclastic differentiation of RAW264.7 cells. FEBS letters. 2007;581(13):2503–2508. doi: 10.1016/j.febslet.2007.04.063. [DOI] [PubMed] [Google Scholar]
- Yasuda H, Shima N, Nakagawa N, Yamaguchi K, Kinosaki M, Mochizuki S, Tomoyasu A, Yano K, Goto M, Murakami A, Tsuda E, Morinaga T, Higashio K, Udagawa N, Takahashi N, Suda T. Osteoclast differentiation factor is a ligand for osteoprotegerin/osteoclastogenesis-inhibitory factor and is identical to TRANCE/RANKL. Proceedings of the National Academy of Sciences of the United States of America. 1998;95(7):3597–3602. doi: 10.1073/pnas.95.7.3597. [DOI] [PMC free article] [PubMed] [Google Scholar]
- Zerwekh JE, Reed-Gitomer BY, Pak CY. Pathogenesis of hypercalciuric nephrolithiasis. Endocrinol Metab Clin North Am. 2002;31(4):869–884. doi: 10.1016/s0889-8529(02)00028-2. [DOI] [PubMed] [Google Scholar]
- Zippin JH, Chen Y, Nahirney P, Kamenetsky M, Wuttke MS, Fischman DA, Levin LR, Buck J. Compartmentalization of bicarbonate-sensitive adenylyl cyclase in distinct signaling microdomains. Faseb J. 2003;17(1):82–84. doi: 10.1096/fj.02-0598fje. [DOI] [PubMed] [Google Scholar]


