

Abstract
Several aspects of insulin-dependent diabetes mellitus are analyzed, including the glucose metabolic system, diabetes complications, and previous and ongoing research aimed at controlling glucose in diabetic patients. An expert review of various models and control algorithms developed for the glucose homeostasis system is presented, along with an analysis of research towards the development of a polymeric insulin infusion system. Recommendations for future directions in creating a true closed-loop glucose control system are presented, including the development of multivariable models and control systems to more accurately describe and control the multi-metabolite, multi-hormonal system, as well as in vivo assessments of implicit closed-loop control systems.
Keywords: Glucose, Insulin, Diabetes, Hydrogels, Pharmacokinetics, Drug Delivery
Introduction
An important aspect of diabetes management is the improvement of our understanding of how homeostasis is affected by external disturbances. From an engineering point of view homeostasis denotes the steady state of a biological system with disturbances leading to dynamic behavior characterized by instability issues. Thus, in order to provide homeostatic control with respect to the body’s plasma glucose levels, several processes must be analyzed and understood.
First among them is how a healthy patient is able to regulate his or her glucose levels, both throughout the day and in response to non steady-state conditions. Second, the differences between the diabetic patient and the healthy patient must be understood in order to establish which system elements need to be controlled, what constraints exist, and which manipulated variables can be used in developing a control scheme. Finally, it is important to evaluate previous work performed in the area of glucose control, with respect to modeling, explicit closed-loop control, and implicit closed-loop devices.
Glucose Metabolism
Discussions on glucose metabolism and complications associated with glucose control can provide significant understanding of the diabetes management process [1– 5]. It is well known that for adenosine triphosphate (ATP) synthesis, the body uses glucose. Therefore, glucose is the primary metabolite required for the body to function properly.
In a healthy individual, the basal glucose level is approximately 80–90 mg/dL. Although there is usually an abrupt concentration increase associated with ingesting a meal, especially one high in carbohydrates, the plasma glucose levels of a healthy individual seldom go over about 120–140 mg/dL. If the plasma levels are higher than homeostatic levels, the excess glucose is taken into liver and muscle cells and stored as glycogen. However, there is an upper limit on the amount of glycogen that can be stored, and additional glucose is usually converted to fat.
When the glucose concentration is below the basal level, the liver produces glucose endogenously through glycogenolysis, in which the stored glycogen of the liver is catabolized to form glucose and gluconeogenesis, in which amino acids and fatty acids stored in the liver are converted to glucose. Hormones play a major role in nearly every significant glucose metabolic process. The primary hormones, including insulin, glucagon, epinephrine, and certain gastrointestinal hormones, of which glucagon-like peptide-one (GLP-1) is the most important, all play significant roles in allowing the healthy individual to maintain glucose at basal levels.
Insulin is primarily responsible for two effects. First, insulin binding to muscle and liver cells results in an order of magnitude increase in glucose uptake into those cells. Second, insulin is primarily responsible for the conversion of glucose in excess of that required for maximum glycogen storage into fat. Furthermore, insulin is responsible for the uptake of amino acids and fatty acids into the liver cells, which allows the liver cells to have enough starting materials to produce glucose via gluconeogenesis.
Insulin is produced in the beta cells of the pancreas. The basal insulin secretion is approximately 25 ng/min/kg body weight. As glucose ingestion causes the plasma glucose concentration to increase, the secretion rate of insulin is increased. The secretion rate usually is increased by an order magnitude with 3–5 minutes of glucose elevation.
Glucagon is primarily responsible for providing the counter-regulatory response in glucose control. As glucose levels descend to below the basal level, usually a result of either fasting or exercise, glucagon binds to liver cells to stimulate glycogenolysis and gluconeogenesis. The binding of glucagon to liver cells also increases the uptake of amino acids and fatty acids, resulting in increased glucose production via gluconeogensis. Finally, glucagon binding to adipose cells results in the endogenous production of fatty acids to be used in glucose production. Like insulin, glucagon is produced in the pancreas. Glucagon is released during exercise and during episodes of hypoglycemia [1].
Like glucagon, the secretion of epinephrine results in increased gluconeogenesis. It also results in the increased mobilization of fatty acids for use in gluconeogenesis. However, unlike glucagon, epinephrine, combined with norepinephrine, constricts the size of blood vessels and dramatically decreases the flow of blood to other tissues. This results in decreasing the uptake of glucose into the other cells. The secretion of both glucagon and epinephrine/norepinephrine is increased in response to exercise. Epinephrine and norepinephrine are also secreted in high stress situations and when the plasma glucose concentration decreases well below the threshold level for glucagon release.
For reasons not completely understood, incretin hormones, of which GLP-1 is the most significant, are released in response to a meal. The incretin effect results in an increase in both pancreatic insulin production and secretion. This results in an increase in plasma insulin even before hyperglycemia is observed. In addition, the incretin effect also plays a direct role in regulating plasma glucose levels, independent of any role it has in increasing insulin levels.
Diabetes Mellitus
Diabetes mellitus is characterized by a breakdown in the glucose metabolic process. Of more interest to this research is Type I diabetes, in which the pancreas is unable to provide the necessary level of insulin to control plasma glucose levels. Type I diabetes is an autoimmune disease in which the body destroys its pancreatic beta cells. This autoimmune process normally occurs early in a person’s life, with later cases normally occurring when a person is in his or her early to mid 20’s. For Type I diabetic patients and a large number of Type II diabetic patients, insulin must be provided from a source other than the pancreas.
For a Type I diabetic patient, the insulin levels will be based entirely on the quality of control that is being provided. If the amount of insulin provided is not enough, more glucose will be produced in the liver than what can be taken up into cells, resulting in hyperglycemia. If the hyperglycemic state is maintained for an extended period of time, the diabetic patient will suffer many consequences [1]. First, the increased level of glucose in the blood changes the osmotic balance of the body, resulting in the loss of water from and ultimately the dehydration of many of the body’s cells. Second, as the glucose levels increase in the body beyond a threshold of approximately 200 mg/dL, glucose is no longer able to be reabsorbed in the kidneys and begins to be passed in urine. The high levels of glucose in urine result in changes in the osmotic balance of urinary fluid, resulting in the passing of other fluids and electrolytes not normally passed. The presence of high glucose itself in the body can actually destroy tissue walls, including the walls of blood vessels, kidneys, eyes, and limbs. Diabetic patients are at higher risk for heart failure and kidney failure. In addition, it is not uncommon for diabetic patients to suffer blindness, and they often must have limbs removed because of the development of gangrene. As a final effect of frequent hyperglycemia, the inability of the body to use glucose as fuel results in the body’s switching to fat metabolism and protein metabolism. This can result in the body’s pH dropping to dangerous levels that can result in death from acidosis, or in the body’s consuming the proteins of its tissues, also resulting in death.
While hyperglycemia could perhaps be prevented by purposely providing more insulin than required for glucose utilization, hypoglycemia would result from providing too much insulin. The amount of insulin available in the blood has a direct effect on the amount of glucose being taken into the cells of the liver and muscle cells. As the insulin availability increases, so does the uptake of glucose into the liver and muscle cells, regardless of the needs of other cells. This is problematic because glucose is the only nutrient that can be used by certain cells in sufficient quantity to allow them to sufficiently perform their metabolic processes.
The most important of these include the brain and the retina. If the brain is unable to get the necessary glucose to perform its metabolic functions, death will result. Adding to the severity of the problem is that if the pancreas is regularly increasing its glucagon output to increase the glucose levels in response to hypoglycemia, it will eventually become insensitive to the low glucose levels, and eventually hypoglycemia will not result in the production of glucagon. Because the central nervous system is responsible for the production of epinephrine, this low level of hypoglycemia will result in the secretion of epinephrine as well. Therefore, to maintain healthy basal conditions, it is very important that a diabetic patient be able to exercise tight glucose control by using carefully determined insulin dosages.
When a diabetic patient eats a meal, the outcome again strongly depends on the quality of insulin therapy. Specifically, the patient’s glucose levels will depend on both the amount of insulin administered and the time of administration. If insulin levels are too low, two dramatic effects will result in extreme hyperglycemia. First, there will not be enough insulin to allow the glucose to be taken into the liver and peripheral cells. Second, the low insulin levels will result in relatively high glucagon levels, which will actually result in even higher levels of glucose in the blood.
In addition to the amount of insulin administered for a meal, the time of administration plays a major role in maintaining normoglycemic conditions. This time usually corresponds with the production of the GI hormones associated with the meal. If the administration is too early, the result will be the onset of hypoglycemia before the meal is absorbed and hyperglycemia near the end of the meal, as there will not be sufficient insulin to allow the glucose infusion from the end of the meal to be utilized. If the insulin is administered too late, hyperglycemia will result at the beginning of the meal and hypoglycemia will result at the end of the meal or shortly after.
During exercise, if too much insulin is present in the body prior to exercise, the result will be an increase in glucose uptake in the liver and periphery and the inhibition of both glucose and fatty acid production. Because fatty acid levels do not increase, the glucose utilization by the cells increases. The consequence of all of these effects is the onset of hypoglycemia, a common occurrence during exercise for diabetic patients.
When too little insulin is present during exercise, the result will be hyperglycemia. This is not a problem during exercise, as the increased glucose levels provide additional fuel that can be used. However, once exercise has been completed, the patient now has higher glucose levels than normal, and there is no effort by the body to restore the levels to normal.
As the previous paragraphs discussed, diabetes can result in very serious consequences for both hyper- and hypoglycemia. The ability to live a life of nearly the same quality as a healthy patient largely depends on the ability of the patient to provide the right amount of insulin at the right time. In order to achieve this optimal type of administration, several insulin delivery methods have been proposed and developed.
Review of Insulin Delivery Techniques
To effectively control glucose in Type I and some Type II diabetic patients, insulin must be administered in such a way that neither hyper- nor hypoglycemic episodes are regularly experienced. Several different insulin administration techniques have been studied. Several other methods have been proposed and are the focus of current research. Each method can be classified by the type of control provided and by the site at which insulin is delivered. Each will be discussed below.
Open Loop Methods
Open loop methods of insulin delivery focus on a patient administering insulin to his or herself at different times of the day. The purpose here is to briefly describe open loop methods of control. Any interested reader is directed to reference [6] for a more thorough review of the open loop route.
The most common method of open loop insulin delivery is the subcutaneous insulin injection. Patients will often inject a slow acting insulin formulation in the morning to provide the basal insulin requirement throughout the day. This analog, known as insulin glargine, is developed by modifying certain amino acids on the different insulin chains [6]. Once altered, it is able to provide a steady release of insulin all day. In addition to the basal requirement, patients will inject insulin into subcutaneous tissue prior to meals. The amount of insulin to inject will depend on both a measurement of glucose and on an estimate of the amount of food that is about to be eaten. To provide rapid insulin during this situation, a fast acting insulin formulation such as insulin aspart or insulin lispro is used. This method suffers from the requirement of three or more daily injections into a layer of subcutaneous tissue. In addition, because the injected insulin must diffuse through the subcutaneous tissue in order to be absorbed into the bloodstream, and because some of this insulin may be degraded in the subcutaneous tissue during this diffusion, not all of the injected insulin will be available for in the body. Also, the diffusion across the subcutaneous layer will create an additional time delay in addition to the delay associated with insulin binding to mediate glucose uptake. Finally, because the insulin will go straight from the subcutaneous layer to the bloodstream, the first pass effect, in which approximately 40% of insulin secreted from the pancreas is degraded in the liver before reaching the bloodstream, will not occur. This will result in increased uptake into the muscle cells and decreased uptake into the liver relative to a healthy patient.
An improvement to the insulin injection is the externally worn insulin pump. The pump is always attached to the diabetic patient, and a basal amount of insulin is provided throughout the day. When the patient is going to modify his or her insulin delivery because of a meal or exercise, the insulin infusion rate can be modified. Pumps have recently been developed to determine the bolus size for a given situation [7]. The patient must input his or her blood glucose levels and an estimate of the size of the load (meal size or exercise load) and the change in infusion will be determined. This type of administration has two primary advantages over injections. First, because the pump has a catheter that is always in contact with the patient, multiple insertions will not be required, increasing the quality of life for the patient. The exception for this is when the catheter is periodically changed, but his is still a significant improvement to the three or more injections usually required. The second advantage is ease in which a change in the insulin infusion can be made. If a patient is was to eat a different amount of food than projected, or were to exercise for a different duration, the insulin rate can be adjusted to account for this. However, the disadvantages associated with subcutaneous delivery still exist. Furthermore, the patient is required to wear a bulky device at the abdominal area. Such a device would definitely be noticeable and would have a definite impact on the quality of life for the patient.
In addition to subcutaneous delivery, other open loop methods have been proposed that take advantage of other administration sites. Recently, the Food and Drug Administration has approved the use of Exuberant®, an inhaled form of insulin, to be used by insulin dependent diabetic patients [8]. The biggest advantage of such a technique is the increase in patient compliance, as a result of no longer having to receive injections or having to wear an external pump. However, several disadvantages exist. First, the bioavailability of inhaled insulin is less than that of a subcutaneous infusion. In addition, a slow releasing insulin analog has not been developed in an inhaled form, so basal administration is still necessary. Finally, because the absorption rate of insulin via the lungs can vary significantly for circumstances such as if a patient smokes or develops a cold, the dose must be carefully determined. Over-absorption of insulin can easily result in severe hypoglycemia [6].
In addition to inhalation, NIH funding is currently being applied toward the development of oral insulin delivery. Like the inhalation route, the oral route would in theory prevent the patient from having to receive multiple daily injections. However, there do exist a few drawbacks to oral delivery. The first disadvantage of the oral route is the difficulty in maintaining the integrity of insulin in the harsh environment of the stomach. Insulin must be able to pass through the stomach and into the intestines for absorption into the bloodstream. However, the acidic gastric environment will degrade insulin, requiring a protective vehicle to allow the insulin to pass safely to the small intestine. Peppas [9] has developed a biomaterial for oral delivery of proteins that protects them in the harsh stomach environment and releases them in the higher pH environment of the small intestine. While protein degradation is one main cause of low bioavailability for protein delivery, another disadvantage of oral delivery is the low bioavailability associated with poor absorption from the intestine into bloodstream [10]. Ongoing research in many labs, including the Peppas laboratory, is currently focused on improving the transport of insulin across the intestinal epithelium.
In addition to oral and inhaled insulin delivery, other proposed methods include delivery via the eyes, skin, and nasal passages [6]. All open loop delivery systems require some level of patient or doctor involvement in the insulin administration. This will require a blood glucose measurement, an estimate of the meal to be consumed, and a calculation in order determine an empirical estimate of the insulin requirement. With the exception of the insulin pump, the open loop method requires a patient to live a predictable lifestyle, one in which his or her meal is prepared specifically for the given insulin bolus and exercise must be performed only in accordance with the insulin received.
Closed-Loop Delivery
An effective alternative to open loop insulin delivery is closed-loop delivery, in which the involvement of the patient in maintaining glucose control is minimal. Such a system would be able to determine the insulin requirement in real time, regardless of the situation, and deliver the proper insulin dosage. It would be able to change the infusion as the patient’s activity changes and, ideally, would exist internally, eliminating the requirement of wearing external equipment. Such a system would also aim to significantly reduce the number of injections required or to eliminate them altogether.
The ideal method of closed loop delivery would be to repair the body’s natural ability to infuse insulin. One method to achieve this would be the pancreas transplant. Ideally, the transplantation of a healthy pancreas would enable a diabetic patient to produce insulin as a healthy patient. However, there are many shortcomings associated with this approach. First, this method depends strongly on the availability of a healthy pancreas for transplantation. Second, the body of a pancreas recipient often undergoes an immune response that ultimately rejects the foreign organ [6].
Another natural method would be to restore to the patient’s pancreas the ability to naturally secrete insulin as a healthy patient [11]. While such a method has promise, a great deal of research must be performed before this type of therapy can be useful to humans. A third method involves implanting encapsulated islet cells from a healthy pancreas, in the hopes that the immune response associated with the foreign pancreas can be avoided. At the same time, the islet beta cells will be able to produce insulin as a healthy pancreas would. This method is the subject of much ongoing research [6].
While natural pancreatic restoration methods are ideal, research must still be completed in order to determine the feasibility of these methods becoming reality. Perhaps a more realistic method of closed-loop control involves engineered solutions. First is the idea of explicit closed-loop control, in which a glucose sensor, an insulin infusion algorithm, and an insulin pump are used to form an artificial pancreas. Second is the idea of implicit-closed loop control, in which polymeric material is able to act as the sensor, control algorithm, and infusion system. To test the validity of such methods, simulations are performed by first developing a model of the infusion and then implementing the infusion model with a model of glucose dynamics within a diabetic patient. Patient modeling, explicit closed-loop control, and implicit closed-loop control will now be discussed.
Diabetic Patient Models
Models describing the important metabolite and hormone dynamics in diabetic patients have been developed since 1960 in order to gain understanding of the glucose homeostasis system and to simulate what effect certain therapies would have on the patient. This review covers different models developed during the last few decades. Others have written reviews on the models and described their various advantages and shortcomings. The interested reader is directed to Sorensen [12], Puckett [5], Parker and Doyle [13], and Steil [14] for more insight.
Patient models can be broken down into two main groups. On one side is the pharmacokinetic model, in which elimination and absorption kinetics are described for each species, and a theoretical number of compartments is determined based on elimination and absorption data [15]. The second type is the physiologically explanatory model, in which organ system is considered to be a compartment, and mass balances are written for each organ system by considering convection resulting from blood flow, diffusion from blood to within organ cells, and metabolic processes [16, 17]. Both types have been developed in the past. While the pharmacokinetic (PK) models have the advantage of being easier to identify from experimental data, Doyle [18] has shown that more complex models may be needed to provide the necessary accuracy for effective control studies.
The first known PK model for glucose regulation was developed by Bolie [19]. The model consisted of one linear equation for insulin and one for glucose. Elimination and absorption kinetics were described by first order rate equations. While developed for a healthy patient, assuming that insulin secretion was simply proportional to glucose, the diabetic patient can be described by setting the first order insulin secretion rate constant to zero. Ackerman et al. [20] modified the model by tying insulin and all other hormones involved in glucose regulation together as a single variable. The model form remained the same however. The main criticisms of these models are that they represent a clear oversimplification of the glucose regulatory system. Besides the fact that insulin or hormone secretion is more complex than a simple first order process, the use of a single insulin or hormone compartment has been criticized by multiple reviewers, including Sorensen [12], and Parker and Doyle [13].
Frost et al. [21] developed a two-compartment PK model for insulin in healthy and diabetic patients. For healthy patients, the insulin secretion rate is given as an exponential function of glucose. For diabetics the secretion is taken to zero. Insulin elimination was taken to be a nonlinear saturation function of insulin for healthy patients and a first order process for diabetic patients. Frost himself admits that this also is an oversimplification, but notes a strong fit to patient data. His two compartment model with nonlinear sinks is also an improvement over the earlier developed models.
Sherwin et al. [22] and Cerasi et al. [23] simultaneously developed a three-compartment PK model in which a central compartment is continuously exchanging insulin with two side compartments. While more complex with respect to the number of insulin compartments, insulin appearance and elimination from each compartment is modeled as first order elimination kinetics. The model of Cerasi also has six linear ordinary differential equations (ODE’s) to describe physiological insulin secretion. While the three insulin compartments are said to provide more physiological accuracy than the one compartment models previously used, the one compartment glucose model of Cerasi is likely inaccurate. Insel et al. [24] developed a three-compartment glucose model that included nonlinear terms to account for insulin effects on glucose uptake. However, the nonlinear term is effectively zero order with respect to insulin, and thus does not really effectively show accurate insulin effects in glucose consumption.
The majority of PK models developed since then have been modifications of the original PK models previously developed. Tranberg and Dencker [25] developed a two-compartment insulin model very much like that of Frost. Home et al. [26] and Kobayashi et al. [27] both used a one-compartment model to fit kinetic parameters from patient data. Hipszer et al. [28] recently used the one-, two-, and three-compartment insulin models to fit insulin data from diabetic patients, concluding that a single insulin compartment is all that is needed to describe insulin kinetics. Salszieder et al. [29] developed a one-compartment model for both insulin and glucose, but increased model complexity in two ways. First, they assumed that glucose production and uptake were best expressed as differential equations. Second, they assumed that insulin accumulation was a function both of the glucose concentration and the derivative of the glucose concentration, an assumption which, as discussed later, forms the basis of many of the control systems designed for glucose control. Parker and Doyle [13] indicated that this model was not able to accurately describe faster dynamic processes associated with glucose regulation.
Perhaps the most widely used PK model to describe glucose and insulin kinetics is the minimal model developed by Bergman and Cobelli [30]. The authors chose from seven different PK model structures, including some of the previously developed models, to select the model structure displaying both a strong representation of intravenous glucose tolerance test (IVGTT) data and physiological relevance. The model consists of a single glucose department and two insulin compartments. The pharmacokinetic diagram is given in Figure 1. Glucose elimination is considered to be a nonlinear function of both glucose and a term representing insulin that is bound to liver and peripheral cells. While originally developed based on animal studies, the model was later applied to human studies [31,32], to an oral glucose tolerance test (OGTT) [33], and to a mixed meal test [34].
Figure 1.

Pharmacokinetic diagram of the minimal model. Solid lines represent material appearance or disappearance, and dashed lines represent contributions toward the kinetic appearance or disappearance. The ki’s represent the rate coefficients for each term with respect to the kinetic process.
There have been several published studies displaying the shortcomings of the minimal model, including the work of Quon et al. [35] and Finegood and Tzur [36]. Both groups found that the minimal model does not accurately quantify the relative contributions of insulin and glucose with respect to glucose uptake. Quon et al., including Cobelli [37] later determined that the problem stemmed from the use of a single glucose compartment. This lead to efforts to develop an improved minimal model, beginning with a two-compartment glucose model by Cobelli et al. [38,39], and ultimately leading to the recently developed hot IVGTT two-compartment minimal model [40]. The model continues to be improved today [41].
More recently, control engineers have gained an interest in the PK model developed by Hovorka et al. [42, 43]. In a similar manner to Bergman and Cobelli with the minimal model, Hovorka et al. proposed a number of different models before deciding on the one that both best fit the data as well as corresponded to physiology. The model diagram is given in Figure 2. It uses two glucose compartments and three insulin-action compartments, describing the appearance and elimination of each species as a first order process. While there is only a single actual insulin compartment, three different types of insulin action are described and assumed to different with respect to their ability to affect glucose metabolism. This coincides well with the original claims of minimal model critics, which may have a lot to do with its rapid acceptance among control engineers. Hovorka et al. [44] recently improved upon the model to more accurately describe the kinetics associated with subcutaneous insulin delivery.
Figure 2.
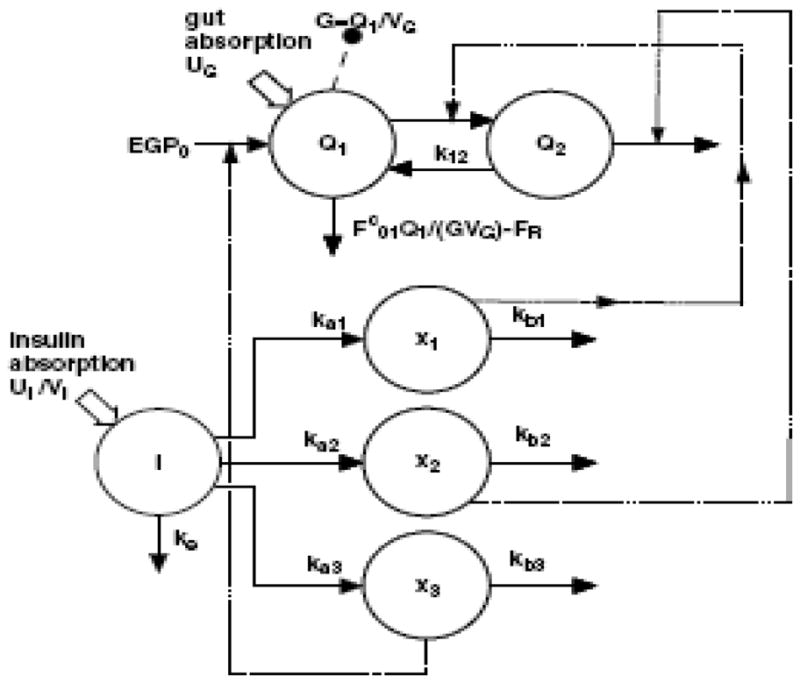
Pharmacokinetic diagram from Hovorka model [43]. Q1 and Q2 represent the mass of glucose in compartments 1 and 2, respectively. I represents plasma insulin, and x1, x2, and x3 represent insulin action toward glucose uptake, production, and exchange between the two compartments. Solid lines represent kinetic appearance or disappearance. Dashed lines represent action by insulin. Large solid arrows represent a single non-continuous source of either glucose or insulin.
The second major type of patient model are those that describe biochemical species dynamics at each significant organ site. These models are developed by selecting as the main compartments only those organs in which significant species appearance or disappearance occur, and writing mass balances accordingly [16]. The first model of this type was developed by Foster et al. [45] in 1973. This model assumed a glucose compartment for blood, muscle, and the liver, while assuming a single compartment each for insulin, glucagon, and fatty acids. Guyton et al., including Foster [46] increased the complexity of Foster’s model. A central organs compartment was added to the glucose model, insulin secretion from the pancreas was made more complex, and diffusion was included in the transport equations. Sorensen [12] improved Guyton’s work by dividing the central organs compartment into the brain and gut compartments and by including the counter-regulatory effects of glucagon. A model diagram of Sorensen’s glucose model is given in Figure 3. The model of Foster et al. is the only one to include fatty acid metabolism.
Figure 3.

Flow diagram of the Sorensen glucose model [12].
Other physiologically relevant models include the models of glucose [47] and insulin [48] of Tiran et al., the model of Cobelli et al. [49], and the model of Puckett [5]. The many parameters of Tiran’s models were estimated using dog data. The models also did not include the affects of glucagon. The models are also given in transfer function form, meaning that they represent linear representations of the systems. The model of Cobelli considers glucose to be a single subsystem, and contradicts his own minimal model improvements made years later. Puckett developed a model very similar to Sorensen’s, but did not include glucagon effects, and removed all transport terms besides the metabolic sources and sinks. In this way, her model represents a multi-compartment PK model. As such, any dynamics associated with other transport will not be captured by this model.
While Sorensen’s model has been the most widely used physiological model with respect to glucose control, it has been criticized for not accurately representing observed glucose behaviors in diabetic patients. Steil [14] has pointed out that the model underpredicts the threshold glucose concentration at which insulin action becomes saturated. He also mentions that the model poorly represents the glucose concentration of a patient with zero insulin and that the sharp drop in glucose that is experienced by patients whose insulin levels rise quickly is also not predicted. However, despite these shortcomings, it remains the most accurate physiologically accurate model developed to date.
In addition to the development of a model, the model parameters must be accurately estimated in order to ensure reasonable simulation results. While the assumed accuracy of physiological models relative to PK models makes them enticing for control simulations, they suffer from the drawback of having tens to hundreds of parameters that must be identified. Because specific patient metabolic rates cannot usually be measured, many different techniques have had to be used in order to estimate model parameters. Some authors, such as Bolie [19], Guyton et al. [46], Tiran [47, 48], and Sorensen [12], used average reported parameters, such as compartment volumes and blood flows. Sorensen and Bolie chose to extrapolate human parameters from reported dog and rat parameters, assuming a linear relationship based only on bodyweight. In other instances, specific data were acquired that allowed specific model parameters to be determined, such as most of the kinetic parameters of Sorensen’s mode and the diffusion terms of Tiran’s models. Most often, however, the model parameters were estimated by comparing model responses to glucose and insulin data, and selecting the parameter set that minimizing the sum of the squared residuals. It would appear that the lower order models have an advantage in that they can be estimated with a single set of glucose or insulin data, whereas the larger models will have to either assume average parameters values from literature or be able to use experimental data for a specific biochemical species in a specific tissue compartment. Finally, it should be noted that most average patient parameter values are given for a 70 kg adult male, independent of age, and that values for a human not matching this description would still have to be determined, either through experiment or approximation.
Explicit Closed-Loop Control
By utilizing the principles of process control, the body can be treated as a chemical process. Glucose metabolism can be simplified to the control of a single variable, glucose, through the use of a single manipulated variable, insulin. The effectiveness of such methods depends on the effective development of glucose sensors, insulin pumps, and control algorithms relating the insulin infusion to past, present, and predicted glucose values.
The development of improved glucose sensing methods is probably the most active component of research being applied toward the development of an explicit closed-loop system. Even without the pump and algorithm, the use of a glucose sensor that is able to give frequent blood glucose measurements in real time is a dramatic improvement to drawing blood via a fingerstick and measuring glucose directly. Joseph and Torjman [50] summarized the different types of sensors being developed, including sensor design and biological issues associated with each. Among the sensors discussed are those implanted in either the subcutaneous tissue or the bloodstream. Most invasive sensors are based on enzyme catalyzed glucose oxidation. One issue associated with implanted sensors is the immune response of the body to foreign species. This can reduce the life of the sensor and can also interfere with its ability to give accurate readings. Another issue is the frequency of measurements. Medtronic-Minimed (Minnapolis, MN) has developed external sensors capable of giving measurements less than five minutes apart [51]. However, the device is not implantable. Devices implanted in the subcutaneous tissue also have the issue of not reading the actual glucose values of blood. The diffusion of glucose from blood to the subcutaneous tissue can result in time delays of around 30 minutes. Schmidtke et al. [52] and Freeland and Bonnecaze [53] have worked on developing dynamic models so that blood glucose values can be inferred from subcutaneous values. Much research is still needed, however, in order to develop implantable devices that can frequently report accurate glucose values for long periods of time [54, 55]. In addition, the lack of developed sensor technology for the other biochemical species to be determined in real time severely limits the possibilities of control to be based on glucose measurements only.
The second mechanical component of the system is the insulin infusion pump. Insulin pumps currently developed by Medtronic-Minimed are able to provide rapid-acting insulin throughout the day either as a basal pulse or as a bolus for a meal [56]. With the patented “Bolus Wizard” the insulin bolus will be calculated based on the size of the meal and the current glucose measurement. However, implantation of such a device is still a work in progress. Many issues must be resolved, including the immune response of the body, the location of the device, and how often the pump’s insulin must be replaced. While Renard [57] argues that the pump should be placed within the peritoneum, a device planted under the skin may be easier to refill. However, such a device would likely be supplying insulin to the subcutaneous tissue, and delivery would not be like that of a healthy patient.
Parker and co-workers [58] reviewed many of the algorithms developed for glucose control prior to 2000. Bequette [59] also reviewed many of the older developments while also reviewing algorithms developed through 2005. The aim of this work is to summarize those reviews and to review algorithms developed since 2005.
The first algorithm of real significance with respect to the development of the artificial pancreas was proposed by Albisser [60]. This algorithm provided insulin when glucose was higher than the desired level and dextrose when glucose was lower than desired. The dextrose infusion rate was proportional to glucose infusion, and the insulin infusion rate was based on a nonlinear proportional plus derivative (PD) algorithm. The “Biostator” algorithms [61] improved upon Albisser’s work to try to improve the response of blood glucose to a meal. This algorithm suffered from many problems. First, the control algorithm consisted of many patient-dependent parameters, meaning the algorithm would have to be developed for a specific patient [58]. If patient parameters changed over time, the algorithm may also have to be reprogrammed. The second major problem is that the derivative was calculated using finite difference for the previous four measurements [59]. Because each measurement was one minute apart, the rate immediately after the beginning or end of a meal will inevitably suffer from a time lag before it is properly adjusted. In addition, measurement noise associated with any of the four points could also dramatically affect the infusion rate. Many authors [58] tried to create improvements to the Albisser’s algorithm, but no controllers were found to outperform the original nonlinear PD algorithm.
As validation that the PD algorithm is indeed the best representation, Nomura et al. [62] studied the response of beta cells of healthy rats to a step disturbance of glucose. Glucose was infused at a constant rate, and the insulin concentration was noted with time. A biphasic response was observed, and the time constants associated with each phase were estimated. The biphasic response of the pancreas is shown in Figure 4. Steil et al. [63] investigated Albisser’s algorithm and the algorithms of “Biostator” while also proposing a PID algorithm for insulin infusion. Controller effectiveness was studied by performing simulations using the model of Cobelli et al. [49]. For the simulation, the model was initially in the hyperglycemic state, and the ability of the controller to return glucose levels to normal was investigated. The algorithm has been implemented in the implantable pumps of Medtronic Minimed, and the ability to return glucose levels to normal in hyperglycemic diabetic dogs was observed. The pump was also implanted into human subjects, and the control algorithm was demonstrated to result both hyperglycemia after the consumption of a meal and hypoglycemia after the meal. An argument against the use of PID controllers to mimic the biphasic insulin profile is provided in reference [59]. The author argues that such a response can be the result of any control system in which integral action is present, and that internal model controllers can also have the same response. He also argues that integral control can result in hypoglycemia as a result of infusing too much insulin.
Figure 4.

Biphasic insulin response to step increase in glucose, as modeled by Nomura et al. [62]. At time zero the glucose concentration is increased from 80 mg/dL to 160 mg/dL and maintained at the new level. A basal insulin concentration of 15 mU/L was assumed, as the results of the model simulation are given as insulin levels above basal. At the time of the glucose change, a sharp spike in insulin occurs, known as first phase release. This response falls off rapidly, followed by a second delayed release phase that gradually increases to the steady state insulin value.
Many authors have studied control algorithms by performing simulations using the well known patient models. Furler et al. [64] investigated the use of a semiclosed-loop algorithm based only on current glucose levels by performing simulations with the minimal model. The ability to return glucose levels from hyperglycemia to normal was observed, but no attempt was made to prevent glucose levels from approaching hyperglycemia after consumption of a meal. Sorensen [12] developed on internal model controller, and simulations were performed using his developed patient model. The controller is able to keep glucose levels under 140 mg/dL during a 100 g oral glucose tolerance test (OGTT). Parker et al. argue in reference [58] that the effectiveness of the controller is highly parameter dependent and that changing the model parameters results in the controller no longer being able to reject the disturbance.
Recent efforts in algorithm development have focused on advanced control methods. Among the first advanced control systems were the optimal controllers developed by Ollerton [65] and Fisher [65]. Ollerton used optimal control to minimize the integral of the squares of the differences between a glucose measurement and the glucose set point. The minimal model was discretized with a 10 minute sampling interval, and the insulin infusion profile minimizing the objective function was chosen as the optimal profile. A 180 minute sampling time is also used, but such a long sampling time would be unable to correct for a meal disturbance that was present in between the samples. The author shows that the algorithm is able to return an initially hyperglycemic patient to normal levels, even in the present of a 100 g/day infusion of glucose. However, the algorithm is unconstrained with respect to the states, inputs, and outputs, and the optimal solution results in insulin levels below zero mU/L, which are not physically attainable. Even with negative insulin levels, the control system is unable to prevent the onset of hypoglycemia. Fisher also used the integral squared error objective function to apply optimal control to the minimal model, but chose three different semiclosed-loop insulin delivery systems to investigate. The first system was comprised of a basal infusion and injections when necessary, the second consisted of an infusion pump only that was optimized every hour, and the third system consisted of the optimal hourly infusion and the injection when needed. The optimal injection and pump infusion, where applicable, were determined using the objective function. Fisher shows that the best controllers consist of the optimal insulin injection, and that the optimal infusion alone will not be able to reject a meal disturbance without the onset of hypoglycemia.
Other methods of advanced control that have been applied include the application of H∞ control by Parker et al. [67]. The authors applied H∞ control to a modified version of Sorensen’s model in which model parameter uncertainty is considered. The control was applied after the model was reduced. Simulations showed that neither hyper- nor hypoglycemia are approached.
The most recent developments in closed-loop control focus on model predictive control (MPC) to provide the optimal control profile while considering constraints. Given measured outputs, model parameters are estimated using state estimation, and an objective function is solved based on the model prediction of the future glucose trajectory resulting from that particular insulin profile. Parker et al. [68] developed a model-based algorithm employing a linearized version of the Sorensen model, a Kalman filter, and a linear quadratic objective function. Like other methods applied to Sorensen’s model, neither hyper- nor hypoglycemia were approached. Bequette and Lynch [69] applied linear MPC to the Sorensen model by using the minimal model to determine the insulin infusion profile. The authors later applied MPC directly to the minimal model, showing that neither hyper- nor hypoglycemia are approached during a meal [70]. Hovorka et al. [43] applied nonlinear MPC to Hovorka’s original model. While the authors were able to show that NMPC used along with an injection at mealtime is able to reduce hyperglycemia and prevent hypoglycemia, no work was presented in which only the MPC controller was used.
Diaz et al. [71] applied predictive functional control Carson’s model. While able to simulate the reduction of hyperglycemia during a meal and the prevention of hypoglycemia, the results were achieved by utilizing insulin infusion rates that lead to hyperinsulinism [1]. Finally, Cinar et al. [72] developed an online simulation tool employing MPC to control a patient using Puckett’s model as both model and patient.
Implicit Closed-Loop Control
The development of an effective explicit closed-loop control system depends on the ability of engineers to develop an effective sensor for each output, an effect control algorithm that allows the controlled variables to be maintained at normal levels during many different conditions, and an effective infusion pump. The pump and the sensor must be able to be implanted and they must be able to respond quickly to the changing environment.
An alternative that removes the necessity of developed equipment is the implicit-closed loop control system, in which a chemical system is acting as all three components of the control system. The system, which contains insulin, is able to modify its insulin release profile in response to a change in the local environment. By mechanically changing in response to its environment, the system acts as a sensor. By releasing insulin through natural transport processes, the device acts as the infusion system. By being optimally designed to release the right amount of insulin for each condition, the device development is the control algorithm.
Because the required stimulus is the state of the local environment, a logical candidate to serve as such a device is the environmentally responsive hydrogel. Hydrogels are cross-linked hydrophilic polymer networks that are able to absorb large amounts of water [73]. The functional groups of the polymer backbone can be modified to allow the hydrogel to swell or deswell in response to many different stimuli, including pH and temperature.
To be used as glucose sensors, Albin et al. [74], as well as Peppas et al. [75–77], have incorporated enzyme-catalyzed glucose oxidation into the hydrogels by immobilizing glucose oxidase into the gel network. Because one of the reaction products is gluconic acid, it is logical to develop the gels to be pH-responsive. Because the release of insulin should increase in response to increased glucose, it is also natural that the hydrogel system be designed to swell in response to an increase in acid concentration, or a pH decrease.
Hydrogel systems that are responsive to pH changes can be divided into two groups. The first are the anionic hydrogels the swell in response to a high pH. These gels contain acid groups that deprotonate at a high pH. This ionization results in repulsions among functional groups within the chains. Examples of anionic hydrogels include the poly(methacrylic acid-graft-ethylene glycol) gels developed by Peppas et al. [9] for oral delivery, and the poly(N-isopropylacrylamide-co-methacrylic acid) gels developed Siegel et al. to serve as a chemomechanical oscillator [78, 79].
Cationic hydrogels are hydrogels that swell in response to a decrease in pH. These gels contain basic functional groups, such as methacrylates. Below the pK of the functional group, the functional groups become protonated, which results in a change in hydrophilicity of the network, causing an increase in water uptake into the gel [76]. This results in increased swelling at the pH below the pK of the functional groups.
Many people have studied the swelling and release characteristics of pH-sensitive cationic hydrogels. Firestone and Siegel [80] investigated the swelling kinetics of copolymer gels of methacrylic acid and dimethylaminoethyl methacrylate, poly(MMA-co-DMAEM) as a function of pH, ionic strength, and temperature, showing that these systems can take in as much as 8 times their collapsed weight in water. Siegel et al. [81] showed that the pK of the buffer solution has a strong effect on the swelling of these gel systems. Firestone and Siegel [82] showed that these systems are able to demonstrate oscillatory swelling and deswelling and that successive pH increases with time resulted in successive deswelling to a specific swelling ratio. Cornejo-Bravo and Siegel [83] studied water sorption for copolymers of diethylaminoethyl methacrylate and methyl methacrylate (poly(DEAEM-co-MMA)), but no dynamic swelling or release results were given. Finally, Siegel et al. [84] investigated the release of caffeine from a hydrogel disk approximately 13 mm in diameter and 0.33 mm thick, and the effects of buffers on release [85]. At a pH of 3, the loaded disk no longer released caffeine at approximately 100 minutes from the start of the experiment. The completion time had increased to 200 minutes for pHs of 5 and 7. All of Siegel’s swelling studies showed the gels reaching their equilibrium swelling ratios on the order of hours.
In our laboratory, we have investigated the swelling and release of pH-sensitive cationic hydrogels as well. Peppas and Hariharan [86] studied both dynamic and equilibrium swelling for a poly(diethylaminoethyl methacrylate-co-hydroxyethyl methacrylate) (poly(DEAEM-co-HEMA)), poly(diethylaminoethyl acrylate-co-hydroxyethyl methacrylate) (poly(DEAEA-co-HEMA), and poly(methacrylaminopropyl ammonium chloride-co-hydroxyethyl methacrylate) (poly(MAPTAC-co-HEMA)). They were able to demonstrate that poly(DEAEA-co-HEMA) showed no water sorption at a pH of 8, while water the gels were able to uptake more than 10 times weight of the collapsed gel at a pH of 3. Using poly(DEAEM-co-HEMA) they demonstrated that 1mm thick disks would reach equilibrium swelling in approximately 3 hours, displaying weight swelling ratios ranging from 1.5 to 2.5 times the original weight of the gel. Peppas, Hariharan, and am Ende [90] performed release studies of oxprendol HCl from poly(DEAEA-co-HEMA) and poly(DEAEM-co-HEMA). Maximum drug release was observed to occur from 1 mm disks within 12 hours for poly(DEAEA-co-HEMA) and on the order of one day for poly(DEAEM-co-HEMA), with rapid release occurring in the first 5 hours, followed by slower release until the device no longer releases.
Because increasing the number of functional groups results in a lower transition pH for swelling, cationic hydrogels of poly(diethylaminoethyl methacrylate-co-ethylene glycol monomethyl ether monomethacrylate) (poly(DEAEM-g-EGMMA)) were developed by Podual, Doyle, and Peppas [76–77, 88–89], and Podual, Peppas, and Schwarte [75]. A small amount of PEGMMA was added to the gels to impart stealth capabilities in the body, preventing a rapid immune response from occurring. The gels displayed a transition pH of around 7.1, and displayed volume swelling ratios ranging from 8 for highly cross-linked gels to over 40 for lightly cross-linked devices. Dynamic studies showed that disks measuring 1 cm in diameter and 1 mm in thickness would reach equilibrium swelling in response to a pH change below the transition pH in approximately 5–6 hours. Microparticles of poly(DEAEM-g-EGMMA) were developed, and results showed that the gels reached equilibrium swelling nearly instantaneously to a decrease in pH below the transition pH [77]. The gels were also shown to be glucose sensitive by observing their swelling in solutions of different glucose concentrations [88]. Finally, insulin release was demonstrated in response to change in glucose. Insulin was shown to be completely released from the system within 20 minutes [89].
Based on the currently developed formulations of poly(DEAEM-g-EGMMA), the hydrogel system would function as an implicit closed-loop system by way of the following mechanism, as shown in Figure 5. Small hydrogel particles would be injected directly into the bloodstream, where they would be protected from the body’s immune response by the ethylene glycol grafts. As the glucose concentration of the blood increases, there will be increased diffusion of glucose to within the gel system. Within the gel, the presence of immobilized glucose oxidase will result in the enzyme catalyzed oxidation of glucose, forming gluconic acid. This acid formation will result in a slight pH change. The pH change will not be large because of the presence of buffers in the bloodstream, most importantly the bicarbonate buffer system [1]. When the pH decreases below the transition pH of the gel, swelling will occur, resulting in an increase in the diffusivity of species from the gel by up to a factor of ten. This results in an order of magnitude increase in insulin infusion from the gel, which results in increased glucose uptake. As the glucose concentration decreases, oxidation will decrease, and as hydrogen ions naturally diffuse out of the gel, the pH will increase again, resulting in a collapse of the particle.
Figure 5.

Schematic of mechanics of pH-responsive cationic hydrogels with glucose oxidase, based on the work of Podual [93]. Glucose appearance results in the production of gluconic acid, which decreases the system pH. pH-induced swelling results in increased diffusion of insulin from within the gel. As glucose is utilized, the mechanism is reversed.
There have been a number of modeling efforts associated with hydrogels. These can be grouped according to the various steps in the swelling and release process. A review of the different models assuming different transports mechanisms and different methods of viscoelastic chain relaxation can be found in reference [90]. With respect the development of control relevant transport models, Lustig and Peppas [91] developed scaling laws to describe the diffusion of solutes in hydrogels that do not exhibit swelling behavior. Peppas, Harland, et al. [92] modeled the combined dissolution and diffusion of a drug that is released from the non-swelling system. Peppas and Hariharan [93] and Albin et al. [74] both developed models describing swelling and release from pH responsive hydrogel films, and Podual et al. [94, 95] developed a model describing swelling and release from poly(DEAEM-g-EGMMA) spherical particles. To the knowledge of the authors, there have been no previous attempts to simulate the response of pH-responsive hydrogels in vivo.
Conclusions
This expert review addresses engineering aspects associated with the control of glucose metabolism, diabetes, and current and proposed therapeutic methods for treating diabetes, including all pertinent patient models, control algorithms, and efforts toward developing an implicit closed-loop control system. As the diabetes problem gains more acceptance as one of multiple inputs and perhaps multiple outputs, future modeling and closed-loop control efforts for glucose homeostasis will be based on species in addition to glucose and insulin. Parker and Roy have recently developed a fatty acid minimal model [96], and control systems utilizing both insulin and glucagon are currently being studied [97], demonstrating the transition to more complex models and systems. Future efforts toward implicit closed-loop control will include in vivo assessments of hydrogel swelling and release. While human patient testing is still a few years away, simulations based on developed patient models and polymeric delivery system models will assist in the design process by allowing researchers to investigate the in vivo effectiveness of many different formulations. These developments, as well as future developments in oral insulin delivery, ensure that great progress will continue to be made toward the development of improved insulin therapies.
Acknowledgments
This work was supported in part by the National Institutes of Health (grant EB 00146 to NAP) and a National Science Foundation Fellowship to TGF.
References
- 1.Guyton A, Hall J. Textbook of Medical Physiology. 11. Elsevier Saunders; Philadelphia, PA: 2006. [Google Scholar]
- 2.Larsen PR, Kronenberg HM, Melmed S, Polonsky Kenneth S, editors. Williams Textbook of Endocrinology. 10. Saunders; Philadelphia, PA: 2003. [Google Scholar]
- 3.Greenspan FS, GardnerDavid G, editors. Basic and Clinical Endocrinology. 7. McGraw-Hill; United States: 2004. [Google Scholar]
- 4.LeRoith D, Taylor SI, Olefsky Jerrold M. Diabetes Mellitus: A Fundamental and Clinical Text. 2. Lippincott, Williams, and Wilkins; Philadelphia, PA: 2000. [Google Scholar]
- 5.Puckett WR. PhD Dissertation. Department of Chemical Engineering, The University of Wisconsin-Madision; 1992. Dynamic Modelling of Diabetes Mellitus. [Google Scholar]
- 6.Parker RS. Insulin Delivery. In: Wnek G, Bowlin G, editors. Encyclopedia of Biomaterials and Biomedical Engineering. Dekker, NY: 2004. pp. 857–866. [Google Scholar]
- 7.Medtronic Minimed, “Bolus Wizard Calculator”. 2007 March; available http://www.minimed.com/products/insulinpumps/features/boluswizard.html.
- 8.McMahon GT, Arky RA. Inhaled Insulin For Diabetes Mellitus. New Engl J Med. 2007;356:497–502. doi: 10.1056/NEJMct063533. [DOI] [PubMed] [Google Scholar]
- 9.Peppas NA. Devices Based on Intelligent Biopolymers for Oral Protein Delivery. Int J Pharm. 2004;277:11–17. doi: 10.1016/j.ijpharm.2003.03.001. [DOI] [PubMed] [Google Scholar]
- 10.Morishita M, Peppas NA. Is The Oral Route Possible For Peptide and Protein Drug Delivery. Drug Discov Today. 2006;11:905–910. doi: 10.1016/j.drudis.2006.08.005. [DOI] [PubMed] [Google Scholar]
- 11.Bouwens L, Rooman I. Regulation of Pancreatic Beta Cell Mass. Physiol Rev. 2005;85:1255–1270. doi: 10.1152/physrev.00025.2004. [DOI] [PubMed] [Google Scholar]
- 12.Sorensen JT. PhD thesis. Dept. Chem. Eng., Massachusetts Institute of Technology; Cambridge: 1985. A Physiologic Model of Glucose Metabolism in Man and Its Use to Design and Assess Improved Insulin Therapies For Diabetes. [Google Scholar]
- 13.Parker RS, Doyle FJ., III Control-Relevant Modeling in Drug Delivery. Adv Drug Deliver Rev. 2001;48:211–228. doi: 10.1016/s0169-409x(01)00114-4. [DOI] [PubMed] [Google Scholar]
- 14.Steil GM, Clark B, Kanderian S, Rebrin K. Modeling Insulin Action For Development of a Closed-Loop Artificial Pancreas. Diabetes Technology & Therapeutics. 2005;7:94–108. doi: 10.1089/dia.2005.7.94. [DOI] [PubMed] [Google Scholar]
- 15.Holz M, Fahr A. Compartmental Modeling. Adv Drug Deliver Rev. 2001;48:249–264. doi: 10.1016/s0169-409x(01)00118-1. [DOI] [PubMed] [Google Scholar]
- 16.Himmelstein KJ, Lutz RJ. A Review of the Applications of Physiologically Based Pharmacokinetic Modeling. J Pharmacokinet Biopharm. 1979;7:127–145. doi: 10.1007/BF01059734. [DOI] [PubMed] [Google Scholar]
- 17.Bischoff KB. Pharmacokinetics in Risk Assessment: Drinking Water and Health. Vol. 8. NAS Press; Washington: 1987. Physiologically Based Pharmacokinetic Modeling; pp. 36–61. [Google Scholar]
- 18.Doyle FJ, III, Dorski C, Harting JE, Peppas NA. Control and Modeling of Drug Delivery Devices For the Treatment of Diabetes. Proc. American Control Conf.; Seattle, Washington. 1995. pp. 776–780. [Google Scholar]
- 19.Bolie VW. Coefficients of Normal Blood Glucose Regulation. J Clin Invest. 1960;39:783–788. doi: 10.1152/jappl.1961.16.5.783. [DOI] [PubMed] [Google Scholar]
- 20.Ackerman E, Gatewood LC, Rosevear JW, Molnar GD. Model Studies of Blood-Glucose Regulation. B Math Biophys. 1965;27:21–37. doi: 10.1007/BF02477259. [DOI] [PubMed] [Google Scholar]
- 21.Frost DP, Srivastava MC, Jones RH, Nabarro JDN, Sonksen PH. The Kinetics of Insulin Metabolism In Diabetes Mellitus. Postgrad Med J. 1973;49:949–954. [PubMed] [Google Scholar]
- 22.Sherwin RS, Kramer KJ, Tobin JD, Insel PA, Liljenquist JE, Berman M, Andres R. A Model of the Kinetics of Insulin In Man. J Clin Invest. 1974;53:1481–1492. doi: 10.1172/JCI107697. [DOI] [PMC free article] [PubMed] [Google Scholar]
- 23.Cerasi E, Fick G, Rudemo M. A Mathematical Model For the Glucose Induced Insulin Release In Man. Europ J Clin Invest. 1974;4:267–278. doi: 10.1111/j.1365-2362.1974.tb00403.x. [DOI] [PubMed] [Google Scholar]
- 24.Insel PA, Liljenquist JE, Tobin JD, Sherwin RS, Watkins P, Andres R, Berman M. Insulin Control of Glucose Metabolism In Man. J Clin Invest. 1975;55:1057–1066. doi: 10.1172/JCI108006. [DOI] [PMC free article] [PubMed] [Google Scholar]
- 25.Tranberg KG, Dencker H. Modeling of Plasma Disappearance of Unlabeled Insulin In Man. Am J Physiol. 1978;235:E577–E585. doi: 10.1152/ajpendo.1978.235.6.E577. [DOI] [PubMed] [Google Scholar]
- 26.Home PD, Massi-Benedetti M, Shepard GA, Hanning I, Alberti KG, Owens DR. A Comparison of the Activity and Disposal of Semi-Synthetic Human Insulin and Porcine Insulin In Normal Man By the Glucose Clamp Technique. Diabetologia. 1982;22:41–45. doi: 10.1007/BF00253868. [DOI] [PubMed] [Google Scholar]
- 27.Kobayashi T, Sawano S, Itoh T, Kosaka K, Hirayama H, Kasuya Y. The Pharmacokinetics of Insulin After Continuous Subcutaneous Infusion or Bolus Subcutaneous Injection In Diabetic Patients. Diabetes. 1983;32:331–336. doi: 10.2337/diab.32.4.331. [DOI] [PubMed] [Google Scholar]
- 28.Hipszer B, Joseph J, Kam M. Pharmacokinetics of Intravenous Insulin Delivery in Humans With Type I Diabetes. Diabetes Technology & Therapeutics. 2005;7:83–93. doi: 10.1089/dia.2005.7.83. [DOI] [PubMed] [Google Scholar]
- 29.Salzsieder E, Albrecht G, Fischer U, Freyse EJ. Kinetic Modeling of the Glucoregulatory System to Improve Insulin Therapy. IEEE T Bio-Med Eng. 1985;32:846–855. doi: 10.1109/TBME.1985.325500. [DOI] [PubMed] [Google Scholar]
- 30.Bergman RN, Ider YZ, Bowden CR, Cobelli C. Quantitative Estimation of Insulin Sensitivity. Am J Physiol. 1979;236:E667–E677. doi: 10.1152/ajpendo.1979.236.6.E667. [DOI] [PubMed] [Google Scholar]
- 31.Bergman RN, Bowden CR, Cobelli C. The Minimal Model Approach to Quantification of Factors Controlling Glucose in Man. In: Cobelli C, Bergman RN, editors. Carbohydrate Metabolism. Wylie; London: 1981. pp. 269–296. [Google Scholar]
- 32.Bergman RN, Phillips LS, Cobelli C. Physiologic Evaluation of Factors Controlling Glucose Tolerance in Man. J Clin Invest. 1981;68:1456–1467. doi: 10.1172/JCI110398. [DOI] [PMC free article] [PubMed] [Google Scholar]
- 33.Dalla Man C, Campioni M, Polonsky KS, Basu R, Rizza RA, Toffolo G, Cobelli C. Two-Hour Seven-Sample Oral Glucose Tolerance Test and Meal Protocol: Minimal Model Assessment of β-Cell Responsitivity and Insulin Sensitivity In Nondiabetic Individuals. Diabetes. 2005;54:3265–3273. doi: 10.2337/diabetes.54.11.3265. [DOI] [PubMed] [Google Scholar]
- 34.Caumo A, Bergman RN, Cobelli C. Insulin Sensitivity From Meal Tolerance Tests In Normal Subjects: A Minimal Model Index. J Clin Endocr Metab. 2000;85:4396–4402. doi: 10.1210/jcem.85.11.6982. [DOI] [PubMed] [Google Scholar]
- 35.Quon MJ, Cochran C, Taylor SI, Eastman RC. Non-Insulin-Mediated Glucose Disappearance In Subjects With IDDM. Discordance Between Experimental Results and Minimal Model Analysis. Diabetes. 1994;43:890–896. doi: 10.2337/diab.43.7.890. [DOI] [PubMed] [Google Scholar]
- 36.Finegood DT, Tzur D. Reduced Glucose Effectiveness Associated With Reduced Insulin Release: An Artifact of the Minimal-Model Method. Am J Physiol. 1996;271:E485–E495. doi: 10.1152/ajpendo.1996.271.3.E485. [DOI] [PubMed] [Google Scholar]
- 37.Cobelli C, Bettini F, Caumo A, Quon MJ. Overestimation of Minimal Model Glucose Effectiveness In Presence of Insulin Response Is Due to Undermodeling. Am J Physiol. 1998;277:E1031–E1036. doi: 10.1152/ajpendo.1998.275.6.E1031. [DOI] [PubMed] [Google Scholar]
- 38.Caumo A, Vicini P, Zachwieja J, Avogaro A, Yarasheski K, Bier DM, Cobelli C. Undermodeling Affects Minimal Model Indexes: Insights From a Two-Compartment Model. Am J Physiol. 1999;276:E1171–E1193. doi: 10.1152/ajpendo.1999.276.6.E1171. [DOI] [PubMed] [Google Scholar]
- 39.Cobelli C, Caumo A, Omenetto M. Minimal Model SG Overestimation and SI Underestimation: Improved Accuracy By a Bayesian Two-Compartment Model. Am J Physiol. 1999;277:E481–E488. doi: 10.1152/ajpendo.1999.277.3.E481. [DOI] [PubMed] [Google Scholar]
- 40.Toffolo G, Cobelli C. The Hot IVGTT Two-Compartment Minimal Model: An Improved Version. Am J Physiol. 2003;284:E317–E321. doi: 10.1152/ajpendo.00499.2001. [DOI] [PubMed] [Google Scholar]
- 41.Krudys KM, Dodds MG, Nissan SM, Vicini P. Integrated Model of Hepatic and Peripheral Glucose Regulation For Estimation of Endogenous Glucose Production During the Hot IVGTT. Am J Physiol. 2005;288:E1038–E1046. doi: 10.1152/ajpendo.00058.2004. [DOI] [PubMed] [Google Scholar]
- 42.Hovorka R, Shojaee-Moradie F, Carroll PV, Chassin LJ, Gowrie IJ, Jackson NC, Tudor RS, Umpleby AM, Jones RH. Partitioning Glucose Distribution/Transport, Disposal, and Endogenous Production During IVGTT. Amer J Physiol. 2002;282:E992–1007. doi: 10.1152/ajpendo.00304.2001. [DOI] [PubMed] [Google Scholar]
- 43.Hovorka R, Canonico V, Chassin LJ, Haueter U, Massi-Benedetti M, Federici MO, Pieber TR, Schaller HC, Schaupp L, Vering T, Wilinska ME. Nonlinear Model Predictive Control of Glucose Concentration In Subjects With Type I Diabetes. Physiol Meas. 2004;25:905–920. doi: 10.1088/0967-3334/25/4/010. [DOI] [PubMed] [Google Scholar]
- 44.Wilinska ME, Chassin LJ, Schaller HC, Schaupp L, Pieber TR, Hovorka R. Insulin Kinetics In Type-1 Diabetes: Continuous and Bolus Delivery of Rapid Acting Insulin. IEEE Trans Biomed Eng. 2005;52:3–12. doi: 10.1109/TBME.2004.839639. [DOI] [PubMed] [Google Scholar]
- 45.Foster RO, Soeldner JS, Tan MH, Guyton JR. Short Term Glucose Homeostasis In Man: A System’s Dynamics Model. J Dyn Syst Meas Control. 1973;95:308–314. [Google Scholar]
- 46.Guyton JR, Foster RO, Soeldner JS, Tan MH, Kahn CB, Koncz L, Gleason RE. Model of Glucose-Insulin Homeostasis In Man That Incorporates the Heterogeneous Fast Pool Theory of Pancreatic Insulin Release. Diabetes. 1978;27:1027–1042. doi: 10.2337/diab.27.10.1027. [DOI] [PubMed] [Google Scholar]
- 47.Tiran J, Galle KR. A Simulation Model of Extracellular Glucose Distribution In the Human Body. Ann Biomed Eng. 1975;3:34–46. doi: 10.1007/BF02584487. [DOI] [PubMed] [Google Scholar]
- 48.Tiran J, Avruch LI, Albisser AM. A Circulation and Organs Model For Insulin Dynamics. Am J Physiol. 1979;237:E331–E339. doi: 10.1152/ajpendo.1979.237.4.E331. [DOI] [PubMed] [Google Scholar]
- 49.Cobelli C, Federspil G, Pacini G, Salvan A, Scandellari C. An Integrated Mathematical Model of the Dynamics of Blood Glucose and Its Hormonal Control. Math Biosci. 1981;58:27–60. [Google Scholar]
- 50.Joseph JI, Torjman MJ. Glucose Sensors. In: Wnek G, Bowlin G, editors. Encyclopedia of Biomaterials and Biomedical Engineering. Dekker, NY: 2004. pp. 683–692. [Google Scholar]
- 51.Medtronic Minimed, “REAL-Time Glucose Monitoring”. 2007 March; available http://www.minimed.com/products/insulinpumps/components/cgm.html.
- 52.Schmidtke DW, Freeland AC, Heller A, Bonnecaze RT. Measurement and Modeling of the Transient Difference Between Blood and Subcutaneous Glucose Concentrations In the Rat After Injection of Insulin. Proc Natl Acad Sci. 1998;95:294–299. doi: 10.1073/pnas.95.1.294. [DOI] [PMC free article] [PubMed] [Google Scholar]
- 53.Freeland AC, Bonnecaze RT. Inference of Blood Glucose Concentrations From Subcutaneous Glucose Concentrations: Applications to Glucose Biosensors. Ann Biomed Eng. 1999;27:525–537. doi: 10.1114/1.196. [DOI] [PubMed] [Google Scholar]
- 54.Ginsberg BH. How Accurate Are Accuracy Measurements of Continuous Glucose Sensing. Diabetes Technology & Therapeutics. 2005;7:673–674. [Google Scholar]
- 55.Colberg SR. Glucose Monitoring and Physical Activity: The Present and Future Challenges. Diabetes Technology & Therapeutics. 2005;7:681–683. [Google Scholar]
- 56.Medtronic Minimed, “Minimed Paradigm 522 or 722 Insulin Pump”. 2007 March; available http://www.minimed.com/products/insulinpumps/components/insulinpump.html.
- 57.Renard E. Implantable Closed-Loop Glucose-Sensing and Insulin Delivery: The Future of Insulin Pump Therapy. Curr Opin Pharmacol. 2002;2:708–716. doi: 10.1016/s1471-4892(02)00216-3. [DOI] [PubMed] [Google Scholar]
- 58.Parker RS, Doyle FJIII, Peppas NA. The Intravenous Route To Blood Glucose Control. IEEE Eng Med Biol. 2001;20:65–73. doi: 10.1109/51.897829. [DOI] [PubMed] [Google Scholar]
- 59.Bequette BW. A Critical Assessment of Algorithms and Challenges In the Development of a Closed-Loop Artificial Pancreas. Diabetes Technology and Therapeutics. 2005;7:28–47. doi: 10.1089/dia.2005.7.28. [DOI] [PubMed] [Google Scholar]
- 60.Albisser AM, Leibel BS, Ewart TG, Davidovac Z, Botz CK, Zingg W. An Artificial Endocrine Pancreas. Diabetes. 1974;23:389–396. doi: 10.2337/diab.23.5.389. [DOI] [PubMed] [Google Scholar]
- 61.Clemens AH. Feedback Control Dynamics For Glucose Controlled Insulin Infusion Systems. Med Prog Technol. 1979;6:91–98. [PubMed] [Google Scholar]
- 62.Nomura M, Shichiri M, Kawamori R, Yamasaki Y, Iwama N, Abe H. A Mathematical Insulin-Secretion Model and Its Validation In Isolated Rat Pancreatic Islets Perfusion. Comput Biomed Res. 1984;17:570–579. doi: 10.1016/0010-4809(84)90021-1. [DOI] [PubMed] [Google Scholar]
- 63.Steil GM, Panteleon AE, Rebrin K. Closed-Loop Insulin Delivery—the Path to Physiological Glucose Control. Adv Drug Deliver Rev. 2004;56:125–144. doi: 10.1016/j.addr.2003.08.011. [DOI] [PubMed] [Google Scholar]
- 64.Furler SM, Kraegen EW, Smallwood RH, Chisolm DJ. Blood Glucose Control by Intermittent Loop Closure in the Basal Mode: Computer Simulation Studies with a Diabetic Model. Diabetes Care. 1985;8:553–561. doi: 10.2337/diacare.8.6.553. [DOI] [PubMed] [Google Scholar]
- 65.Ollerton RL. Application of Optimal Control Theory to Diabetes Mellitus. Int J Control. 1989;50:2503–2522. [Google Scholar]
- 66.Fisher ME. A Semiclosed-Loop Algorithm For the Control of Blood Glucose Levels In Diabetics. IEEE Trans Biomed Eng. 1991;38:57–61. doi: 10.1109/10.68209. [DOI] [PubMed] [Google Scholar]
- 67.Parker RS, Doyle FJ, III, Ward JH, Peppas NA. Robust H∞ Glucose Control In Diabetes Using a Physiological Model. AIChE J. 2000;46:2537–2549. [Google Scholar]
- 68.Parker RS, Doyle FJ, III, Peppas NA. A Model-Based Algorithm For Blood Glucose Control In Type I Diabetic Patients. IEEE Trans Biomed Eng. 1999;46:148–157. doi: 10.1109/10.740877. [DOI] [PubMed] [Google Scholar]
- 69.Lynch SM, Bequette BW. Estimation-Based Model Predictive Control of Blood Glucose In Type I Diabetics: A Simulation Study. Proceedings of the IEEE 27th Annual Northeastern Bioengineering Conference; Storrs, CT. 2001. pp. 79–80. [Google Scholar]
- 70.Lynch SM, Bequette BW. Model Predictive Control of Blood Glucose In Type I Diabetics Using Subcutaneous Glucose Measurements. Proceedings of the 2002 American Control Conference; Anchorage, AK. 2002. pp. 4039–4043. [Google Scholar]
- 71.Diaz RG, Roldan G, Basualdo M. A Decision Support System Based On a Closed Loop PFC Applied For Type I Diabetes. Proceedings of the 16th IFAC World Congress; Prague, Czech Republic. 2005. [Google Scholar]
- 72.Agar B, Birol G, Cinar A. Virtual Experiments For Controlling Blood Gulcose Level In Type I Diabetes. Proc. 2nd Joint EMBS-BMES Conference; Houston, TX. 2002. [Google Scholar]
- 73.Peppas NA. Hydrogels. In: Ratner BD, Hoffman AS, Schoen FJ, Lemons JE, editors. Biomaterials Science. Academic Press; NY: 2004. pp. 100–107. [Google Scholar]
- 74.Albin GW, Horbett TA, Miller SR, Ricker NL. Theoretical and Experimental Studies of Glucose Sensitive Membranes. J Control Release. 1987;6:267–291. [Google Scholar]
- 75.Schwarte LM, Podual K, Peppas NA. Cationic Hydrogels For Controlled Release of Proteins and Other Macromolecules. In: McCullogh I, Shalaby SW, editors. Tailored Polymeric Materials For Controlled Drug Delivery Systems, ACS Symposium Series. Vol. 709. 1998. pp. 56–66. [Google Scholar]
- 76.Podual K, Doyle FJ, III, Peppas NA. Preparation and Dynamic Response of Cationic Copolymer Hydrogels Containing Glucose Oxidase. Polymer. 2000;41:3975–3983. [Google Scholar]
- 77.Podual K, Doyle FJ, III, Peppas NA. Dynamic Behavior of Glucose Oxidase-Containing Microparticles of Poly(Ethylene Glycol)-Grafted Cationic Hydrogels In an Environment of Changing pH. Biomaterials. 2000;21:1439–1450. doi: 10.1016/s0142-9612(00)00020-x. [DOI] [PubMed] [Google Scholar]
- 78.Leroux J, Siegel RA. Autonomous Gel/Enzyme Oscillator Fueled By Glucose: Preliminary Evidence For Oscillations. Chaos. 1999;9:267–275. doi: 10.1063/1.166403. [DOI] [PubMed] [Google Scholar]
- 79.Dhanarajan AP, Misra GP, Siegel RA. Autonomous Chemomechanical Oscillations In a Hydrogel/Enzyme System Driven By Glucose. J Phys Chem A. 2002;106:8835–8838. [Google Scholar]
- 80.Firestone BA, Siegel RA. Kinetics and Mechanisms of Water Sorption In Hydrophobic, Ionizable Copolymer Networks. J Appl Polymer Sci. 1991;43:901–914. [Google Scholar]
- 81.Siegel RA, Johannes I, Hunt CA, Firestone BA. Buffer Effects On Swelling Kinetics In Polybasic Gels. Pharm Res. 1992;9:76–81. doi: 10.1023/a:1018983828027. [DOI] [PubMed] [Google Scholar]
- 82.Firestone BA, Siegel RA. Dynamic pH-Dependent Swelling Properties of a Hydrophobic Polyelectrolyte Gel. Polym Commun. 1988;29:204–208. [Google Scholar]
- 83.Cornejo-Bravo JM, Siegel RA. Water Vapor Sorption Behavior of Copolymers of N, N-Diethylaminoethyl Methacrylate and Methyl Methacrylate. Biomaterials. 1993;17:1187–1196. doi: 10.1016/0142-9612(96)84939-8. [DOI] [PubMed] [Google Scholar]
- 84.Siegel RA, Falamarzian M, Firestone BA, Moxley BC. pH-Controlled Release From Hydrophobic/Polyelectrolyte Copolymer Hydrogels. J Control Release. 1988;8:179–182. [Google Scholar]
- 85.Cornejo-Bravo JM, Siegel RA. Kinetics of Drug Release From Hydrophobic Polybasic Gels: Effect of Buffer Acidity. J Control Release. 1995;33:223–229. [Google Scholar]
- 86.Hariharan D, Peppas NA. Characterization, Dynamic Swelling Behavior and Solute Transport In Cationic Networks With Applications To the Development of Swelling-Controlled Release Systems. Polymer. 1996;37:149–161. [Google Scholar]
- 87.Ende MT, Hariharan D, Peppas NA. Factors Influencing Drug and Protein Transport and Release From Ionic Hydrogels. React Polym. 1995;25:127–137. [Google Scholar]
- 88.Podual K, Doyle FJIII, Peppas NA. Glucose-Sensitivity of Glucose Oxidase-Containing Cationic Polymer Hydrogels Having Poly(Ethylene Glycol) Grafts. J Control Release. 2000;67:9–17. doi: 10.1016/s0168-3659(00)00195-4. [DOI] [PubMed] [Google Scholar]
- 89.Podual K, Doyle FJIII, Peppas NA. Insulin Release From pH-Sensitive Cationic Hydrogels. Proceed Intern Symp Control Rel Bioact Mater. 1998;25:56–57. [Google Scholar]
- 90.Podual K. PhD Dissertation. Department of Chemical Engineering, Purdue University; West Lafayette, IN: 1998. Glucose-Sensitive Cationic Hydrogels For Insulin Release. [Google Scholar]
- 91.Lustig SR, Peppas NA. Solute Diffusion in Swollen Membranes. IX. Scaling Laws For Solute Diffusion In Gels. J App Polymer Sc. 1988;36:735–747. [Google Scholar]
- 92.Harland RS, Dubernet C, Benoit J, Peppas NA. A Model of Dissolution-Controlled, Diffusional Drug Release From Non-Swellable Polymeric Microspheres. J Control Release. 1988;7:207–215. [Google Scholar]
- 93.Hariharan D, Peppas NA. Modelling of Water Transport and Solute Release In Physiologically Sensitive Gels. J Contr Rel. 1993;23:123–136. [Google Scholar]
- 94.Podual K, Doyle FIII, Peppas NA. Modeling of Water Transport In and Release From Glucose-Sensitive Swelling-Controlled Release Systems Based On Poly(Diethylaminoethyl Methacrylate-g-Ethylene Glycol) Ind Eng Chem Res. 2004;43:7500–7512. [Google Scholar]
- 95.Podual K, Peppas NA. Relaxational Behavior and Swelling-pH Master Curves of Poly[(Diethylaminoethyl Methacrylate)-Graft-(Ethylene Glycol)] Hydrogels. Polym Int. 2005;54:581–593. [Google Scholar]
- 96.Roy A, Parker RS. Dynamic Modeling of Free Fatty Acid, Glucose, and Insulin: An Extended ‘Minimal Model’. Diabetes Technology & Therapeutics. 2006;8:617–626. doi: 10.1089/dia.2006.8.617. [DOI] [PubMed] [Google Scholar]
- 97.El-Khatib FH, Jiang J, Damiano ER. Adaptive Closed-Loop Control Provides Blood-Glucose Regulation Using Dual Subcutaneous Insulin and Glucagon Infusion In Diabetic Swine. J Diabetes Sci Tech. 2007;1:181–192. doi: 10.1177/193229680700100208. [DOI] [PMC free article] [PubMed] [Google Scholar]