

Abstract
Recent studies suggest that mouse meibomian glands (MG) undergo age-related atrophy that mimics changes seen in age-related human MG dysfunction (MGD). To better understand the structural/functional changes that occur during aging, this study developed an imaging approach to generate quantifiable volumetric reconstructions of the mouse MG and measure total gland, cell, and lipid volume. Mouse eyelids were fixed in 4% paraformaldehyde, embedded in LR White resin and serially sectioned. Sections were then scanned using a 20× objective and a series of tiled images (1.35 × 1.35 × 0.5 mm) with a pixel size of 0.44 μm lateral and 2 μm axial were collected using a Zeiss 510 Meta LSM and a femtosecond laser to simultaneously detect second harmonic generated (SHG) and two-photon excited fluorescence (TPEF) signals from the tissue sections. The SHG signal from collagen was used to outline and generate an MG mask to create surface renderings of the total gland and extract relevant MG TPEF signals that were later separated into the cellular and lipid compartments. Using this technique, three-dimensional reconstructions of the mouse MG were obtained and the total, cell, and lipid volume of the MG measured. Volumetric reconstructions of mouse MG showed loss of acini in old mice that were not detected by routine histology. Furthermore, older mouse MG had reduced total gland volume that is primarily associated with loss of the lipid volume. These findings suggest that mice MG undergo “dropout” of acini, similar to that which occurs in human age-related MGD.
Keywords: meibomian gland, aging, meibomian gland dysfunction, nonlinear optical microscopy, array tomography
INTRODUCTION
Meibomian glands (MGs) are lipid producing holocrine glands that reside along the margin of the eyelid. MGs are embedded within the tarsal plate of both the upper and lower eyelid, forming a row of glands along the entire eyelid length. Structurally, MGs are simple branched acinar glands containing a single long central duct with an orifice located just anterior to the mucocutaneous junction at the eyelid margin, where the ocular surface epithelium, or conjunctiva, meets the palpebral epidermis (Jester et al., 1981). Acini are connected along the length of the central duct and secrete lipid into the duct and onto the ocular surface where they reduce tear evaporation, contribute to the maintenance and structural integrity of the tear film and help provide a smooth optical surface (Driver and Lemp, 1996).
A number of changes occur in the human MG with age that are thought to account for the increased frequency of meibomian gland dysfunction (MGD) in older populations (Hom et al., 1990; Mathers et al., 1991; Mathers and Lane, 1998) including MG “dropout,” orifice plugging, cystic dilation of the duct, and atrophy of the MG acini (Gutgesell et al., 1982; Robin et al., 1985; Hykin and Bron, 1992; Mathers, 1993; Obata et al., 1994; Obata, 2002). These structural changes are thought to lead to altered or reduced tear outflow leading to disruption of the tear film, increased tear evaporation, and increased tear osmolarity that cause ocular discomfort, eye irritation, and chronic blepharitis. (Mathers et al., 1991; Shimazaki et al., 1995; Driver and Lemp, 1996).
Recently, we have shown that the MG of mice develop age-related changes similar to those observed in humans, including reduced gland size and decreased proliferative potential (Nien et al., 2009). Since previous studies of human MGD using transillumination biomicroscopy (meibography) have identified “gland dropout” as a pathognomonic feature, (Jester et al., 1982) the purpose of this study was to develop an imaging approach to generate quantifiable volumetric reconstructions of the mouse MG that could assess gland “dropout” and measure the total, cellular, and lipid volume. A previous study has reported on the volumetric, three-dimensional (3-D) reconstructions of the MG from elderly individuals using paraffin embedded tissue. However, this approach only evaluated total gland volume and did not assess either the cellular and/or lipid compartment (Kozak et al., 2007).
Recently, we have used nonlinear optical (NLO) imaging and array tomography to reconstruct the collagenous and elastic components of the optic nerve head and the lamina cribrosa by simultenously collecting second harmonic generated (SHG) and two photon excited fluorescence (TPEF) signals from plastic embedded, tissue samples (Winkler et al., 2010). To reconstruct the mouse MG, we have applied a similar approach to simultaneously collect SHG and TPEF signals to three-dimensionally reconstruct the MG and measure total, cellular, and lipid volume.
Using NLO array tomography, we have generated 3-D volume renderings of the MG from young and old mice. These renderings show that MG from a young mouse contains multiple, large acini with a high lipid volume, whereas MG from an old mouse have fewer acini with markedly reduced lipid volume. These findings are consistent with earlier results showing reduced gland size in older mice (Nien et al., 2009) and further indicate that aging mouse MG show acinar “dropout” similar to that detected in humans. Overall, this study demonstrates that NLO array tomography may be a useful approach to studying the 3-D structure of tissues and glands and that it provides quantitative, volumetric measurements with femtolitre resolution.
MATERIALS AND METHODS
Tissue and Embedding
C57Bl/6 mice aged 2 months or 2 years were anesthetized using ketamine HCl (100 mg/kg body weight, Bioniche Pharma, Lake Forest, IL) and xylazine (20 mg/kg body weight, Llyod Laboratories, Shenandoah, IO). Mice were then humanely sacrificed according to procedures approved by the Institutional Animal Care and Use Committee (IACUC) and in accordance with Association for Research in Vision and Ophthalmology (ARVO) Statement for the use of Animals in Ophthalmic and Vision Research.
The inferior eyelids were collected and the central 1/3 of the lid was fixed in 4% paraformaldehyde/phosphate buffered saline (PBS) overnight at 4°C. The fixed tissue was rinsed three times in a 3.5% sucrose/PBS solution for 20 minutes followed by dehydration in a graded series of ethanol for 30 minutes each. The sample was then submerged in 100% LR White resin (Electron Microscopy Sciences, Hatfield, PA) two times and then left overnight at 4°C. The samples were then placed in a gelatin capsule and the LR White allowed to polymerize at 60°C for 48 hr.
Sectioning
Serial sections, 2-μm thick, were cut, using a Leica Reichert Ultracut R Ultramicrotome (Leica Microsystems GmbH, Wetzlar, Germany) and diamond knife (DiAtome, Hatfield, PA). The sections were formed into serial ribbons by applying fast-drying contact glue (Pattex Kraftkleber Henkel, Dusseldorf, Germany) to the top and bottom of the plastic block. Each ribbon of sections was then floated onto glass slides precoated with 0.1% gelatin and 0.01% chromium potassium sulfate (Fisher Scientific Ltd, Houston, TX).
Imaging
A Zeiss 510 Meta Laser scanning microscope (LSM, Carl Zeiss Microimaging, Thornwood, NY) in multiphoton mode was used to acquire all images. Nonlinear signals were generated with ultra short laser pulses from a Titanium-Sapphire femtosecond laser (Chameleon®, Coherent, Santa Clara, CA). The samples were scanned with an excitation wavelength of 800 nm at 20.9% power. The forward scattered SHG signal was collected using the transmitted light detector and a 400/50 nm band pass filter and the backscattered SHG signal was collected using the Meta Detector over the 380–420 nm spectrum. Simultaneously, the TPEF signal was collected using a second channel in the Meta detector covering the 460–630 nm spectrum.
Each tissue section was centered manually using a 20×/0.75 NA Zeiss Apochromat objective. Sections were tile scanned using a 3 × 3 grid pattern allowing for resolution of 1024 × 1024 pixels per field (nine fields per section), with a lateral resolution of 0.44 μm per pixel. During each tile scan, each line was scanned and averaged eight times to remove unwanted noise. Each section was scanned sequentially resulting in a 3-D image data stack (1.35 mm × 1.35 mm × 0.5 mm).
Reconstruction Methods
Preprocessing
All reconstructions were created using Amira 5.2 (Visage Imaging, Carlsbad, CA) visualization software. Reconstructions began with a series of preprocessing steps performed on each image in preparation for importing to the Amira imaging program.
First, all images were converted to .tif files using the LSM Toolbox plug-in for ImageJ version 1.39 (ImageJ is a free Java-based image processing platform developed by the National Institute of Health, http://rsb.info.nigh.gov/ij/). This batch function converted the files and divided the image into three separate channels; the forward and back scattered SHG channels, and the TPEF channel (Fig. 1). Each channel was assigned its own pseudo-color; the backscatter SHG was displayed in magenta (A), the forward scattered SHG in cyan (B), and the TPEF signal was displayed in red (C).
Fig. 1.
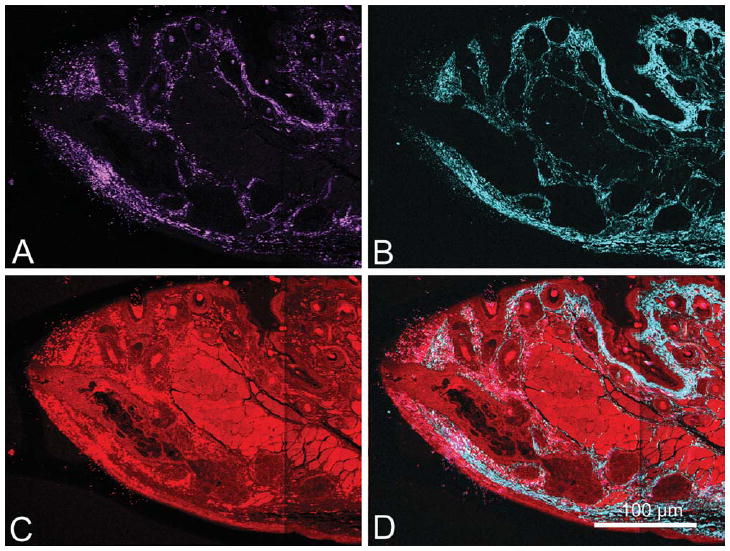
LR White section (2-μm thick) of 2-month-old mouse MG imaged using 800 nm femtosecond laser excitation to simultaneously generate SHG and TPEF signals. Each image represents a tiled scan with a resolution of .44 μm per pixel. SHG and TPEF signals were collected and displayed as individual pseudo-colors; the backscattered SHG channel is shown in magenta (A), forward scattered SHG channel is shown in cyan (B), TPEF signal is shown in red (C), and a merged image of all channels is also shown (D).
Single-channel images were then batch-processed in Adobe Photoshop CS 2 (Adobe System, San Jose, CA). For each channel, individual images were converted to eight-bit grayscale images, auto contrasted to separate the positive tissue signal from background noise, and finally processed with a median filter using a 3 × 3 kernel to remove remaining noise (Fig. 2). Following these preprocessing steps, the forward scatter and backscatter SHG channels were merged to form the combined SHG (Collagen) image. The SHG and TPEF images (Fig. 2A, B, respectively) were then imported into ImageJ separately and concatenated into two separate 3-D image stacks.
Fig. 2.
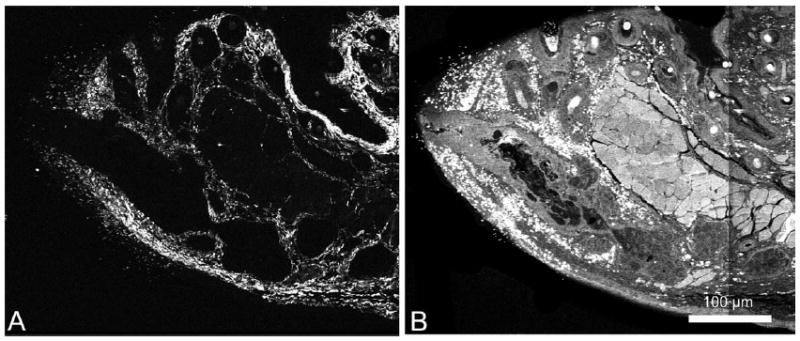
Post-processed images of a 2-month-old mouse MG. The forward scattered and back scattered SHG signals were first merged together. Then the same preprocessing steps were performed on every image from each SHG (A) and TPEF (B) signal. Preprocessing steps included first converting to grey scale, auto contrasting, and applying a median filter (3 × 3 kernel).
Reconstruction
The SHG (collagen) stack was first loaded into Amira. Unlike optical sections, the slices were not perfectly aligned as the individual plastic sections had a tendency to rotate and translate relative to one another when floated onto the glass slides. Image planes within the stack were aligned using the Align Slice module in Amira to compensate for the rotation and translation of individual planes. Amira allows the user to record and save the rotation and translation of each slice as alignment parameters. This feature was utilized and allowed each stack to be aligned in the same manner regardless of the channel loaded. Thus, alignment parameters obtained through the manual alignment of the SHG stack were then applied to the TPEF stack resulting in two stacks with identical alignments. This was necessary for accurate reconstructions and the incorporation of multiple channels of data into a single reconstruction.
Once the 3-D stack was aligned and the planes could be paged through, individual planes showing folds or bubbles over the gland were identified. An inherent artifact of floating the ribbons of serial sections onto the slides was that some sections did not lie on the slide perfectly flat. As a result, folds or bubbles appeared in the tissue, creating artifacts. To correct for this, planes with excessive folds or bubbles were replaced with an interpolation derived by merging the distorted plane with an adjacent intact plane. Interpolations were achieved by applying the warp tool in Photoshop, which stretched the distorted plane to align the folded region with the corresponding region on the following plane. Planes were then averaged, effectively “filling in” the absent data in the folded image with data from the next plane. We implemented this process on 12 of the 250 planes gathered on the 2-month-old 3-D data stack, and 13 of the 200 planes from the 2-year-old data stack.
After alignment and fold correction, the data stacks were loaded into Amira (Fig. 3) First, the Label Field module was applied to the SHG stack and the area of interest containing the MG was manually segmented with the use of the auto fill tool provided in the program (Fig. 3B). By manually paging through each plane and filling in the gland area, a 2-D shell of the MG was segmented out from each image plane, then each 2-D shell plane was compiled into a 3-D MG shell stack (Fig. 3C). This stack was then used to generate a 3-D surface rendering (see Supporting Information Movie 1). This shell was not only used for visualization but also was quantified to calculate the total volume of the gland. The resulting surface was then exported as a separate 3-D image stack; the single images that comprise the stack could then be used as a mask to extract the gland region from the TPEF channel images using a batch processing in Photoshop (Fig. 4).
Fig. 3.
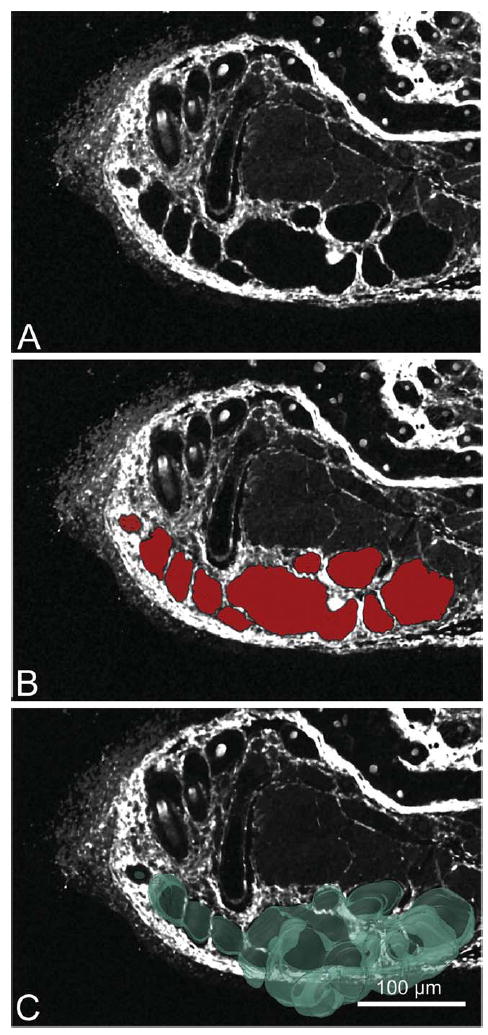
Gland sectioning process. Each reconstruction began with first segmenting out the MG. Segmentations were preformed on the SHG (A) image. The SHG image stack was paged through and on each frame the MG was sectioned out (B) using the auto fill tool provided in Amira (sectioned area is visualized in red). After segmentation of the whole SHG stack the MG shell stack was used to generate a 3-D surface rendering (C).
Fig. 4.
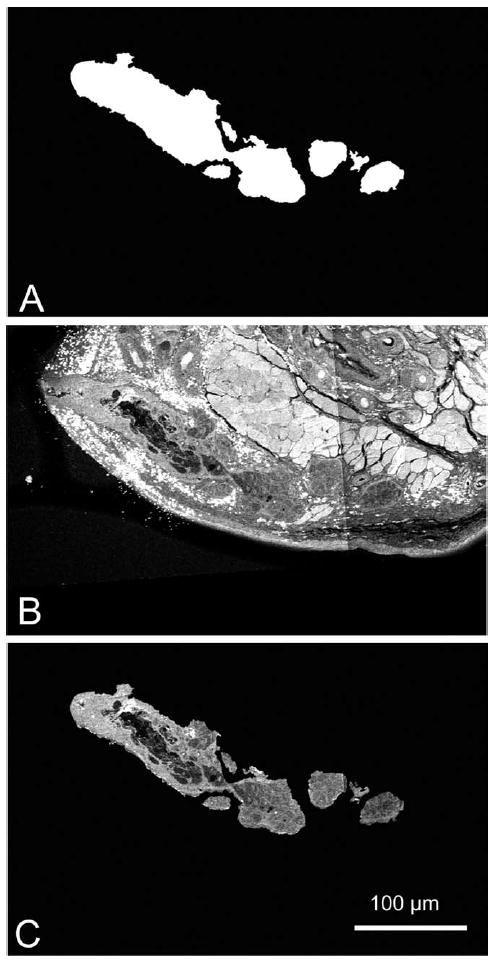
TPEF sectioning process. After the MG was segmented out of the SHG image stack, the image planes were then converted to an MG mask (A), this was then applied to the TPEF image stack (B) to generate the TPEF MG stack (C).
Once the gland region had been extracted from the TPEF channel images, segmentation of the MG components was performed. In the TPEF image, two levels of signal were detected; a high-intensity signal from the ductal epithelium and acinar cells, and a low-intensity signal from the central duct and vacuoles within the acini. Because the tissue embedding process resulted in extraction of lipid, the low-intensity TPEF signals within the central duct (Fig. 5A, asterisk) and acini were assumed to represent areas of MG lipid (Fig. 5A, arrow). In addition, lipid contained in frozen sections of MG show no intrinsic TPEF or SHG signals when analyzed by NLO microscopy. Therefore, to segment the lipid volume, the mean pixel intensity within the central duct was measured and applied as the threshold value removing any pixels above that intensity (Fig. 5B). This process resulted in an image showing only pixels that represented lipid either in the duct or acinar compartment of the gland (Fig. 5C). The segmented duct and lipid volume was rendered in various ways (volume heat maps and/or or surface renders), which were then quantified to calculate the total volume of lipid and/or duct structure. The volume heat map visualizes the cellular and lipid structure by applying mapped colors to specific voxel volumes. The look up table applied depicts the cellular compartment as blue, representing voxels containing 100% cytoplasm/0% lipid. The lipid compartment was represented by red voxels containing 100% lipid.
Fig. 5.
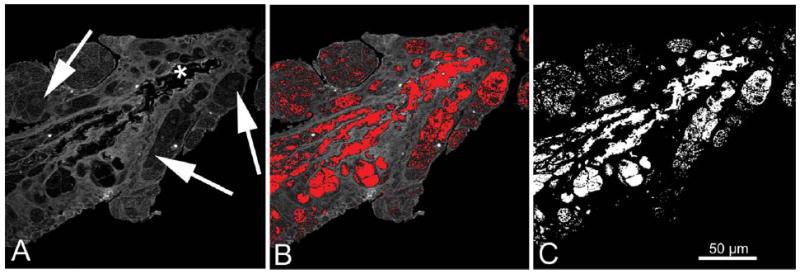
Extraction of the lipid volume from the TPEF channel image. In the TPEF MG image, two levels of signal were detected; a high-intensity signal from the cellular structures (ductal epithelium and acini), and a low-intensity signal from the ductal lumen (A, asterisks) and acinar vesicles (A, arrows) that represents lipid. The mean pixel intensity of the ductal lumen was measured and used as a threshold to segment out the lipid area from the cellular area (B, red pixels are below threshold value and therefore sectioned out). This process results in an image showing only pixels that represent either ductal lumen or acinar lipid (C).
RESULTS
Using NLO array tomography, 3-D reconstructions of the MG were obtained at sub-micron resolution. These reconstructions allowed for the structure of the MG to be seen in a new perspective, and allowed us to visualize age-related differences in the gland shape.
On first inspection of the 3-D reconstructions of the SHG MG shell, distinct changes were evident between the 2-month-old MG and the 2-year-old MG (Fig. 6). The most noticeable difference was in the size and shape of the glands. In the 2-month-old gland, moving distally from the orifice (Fig. 6A, asterisk), large acini appeared to protrude (Fig. 6A, arrows) out from the duct, whereas at the distal end of the gland, the duct appeared to ramify into multiple, ductules that connected to large, bulging acini (Fig. 6B). This gave the 2-month-old gland the appearance of being much larger and bulkier in comparison with the 2-year-old gland, which had a much more narrow, elongated shape with fewer and smaller acini (Fig. 6C, arrows). Also note that in the 2-year-old gland there were regions along the duct that were devoid of acini (Fig. 6C, arrowheads), giving the appearance of acini “dropout.” (see Supporting Information Movie 2).
Fig. 6.
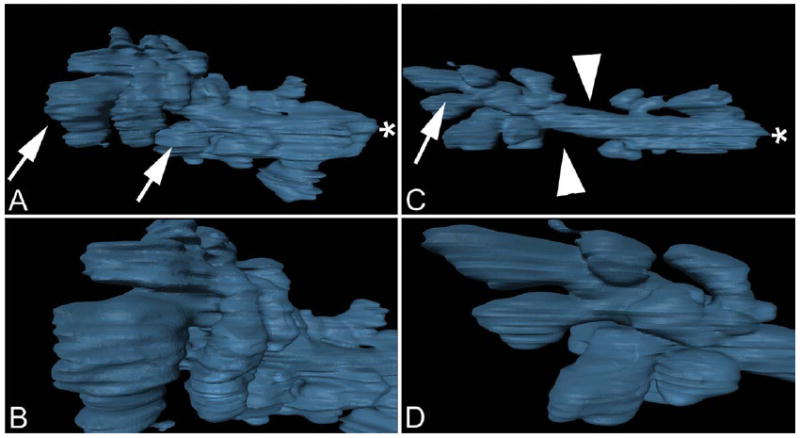
Meibomian gland three-dimensional surface rendering. Two-month-old gland (A, B). Frame A depicts the entire gland surface, arrows identify large acini, asterisks indicates gland orifice. Frame B depicts a closer inspection of acini at the distal end of the gland. Two-year-old gland (C, D) shows regions were acini were missing (arrowheads) or reduced in size (arrow).
When the lipid volume was visualized as a volume heat map inside of the SHG MG shell, other differences became evident. Specifically, high concentrations of lipid (Fig. 7, red pixels) appeared to be more prevalent and in greater volume in the 2-month-old MG than in the 2-year-old MG. When the lipid volume was rendered as a separate surface inside of the SHG MG shell (Fig. 8), a difference in the overall lipid volume inside the gland was also observed with a greater lipid content detected in the acini of the 2-month-old MG compared with the 2-year-old MG. In addition, there appeared to be less lipid filling the duct of the 2-year-old gland compared with the 2-month-old gland.
Fig. 7.
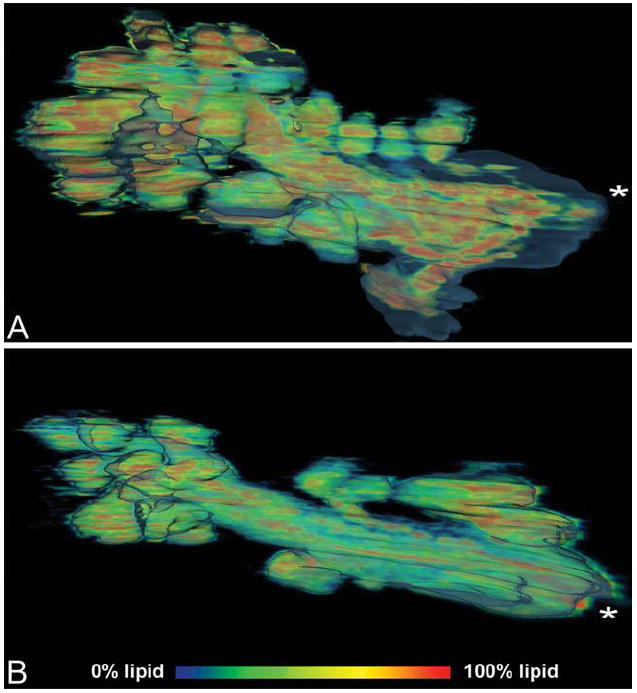
Meibomian gland lipid volume heat map of 2-month-old gland (A), and 2-year-old gland (B). Lipid components are seen in red to blue and represent a voxel volume of 100%–0% lipid.
Fig. 8.
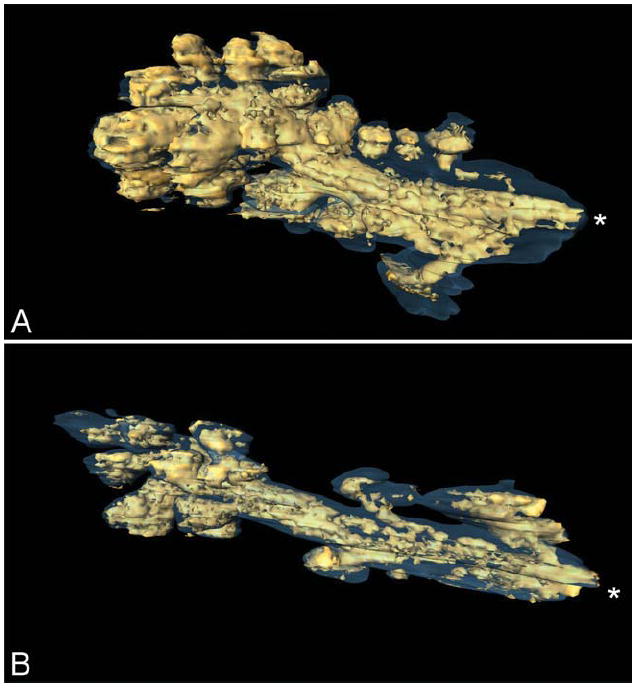
Surface rendering of high-density (>50%) lipid volume (gold) within the meibomian gland (gray outline). Two-month-old gland (A), and 2-year-old gland (B), asterisks represent gland orifice.
In addition to visualization, the reconstructions were also used to quantify differences. Using the quantification package in Amira 5.2, volumetric data were collected (Table 1). The total volume of the 2-month-old gland was 3.8 × 10⁶ fl (femtoliter), whereas the older gland had a volume of 2.7 × 10⁶ fl. There was also a marked change in the total lipid volume between the young and old MGs. The 2-month-old MG had a total lipid volume of 1.8 × 10⁶ fl, whereas the 2-year-old MG had a total lipid volume of only 0.8 × 10⁶ fl. Therefore, the lipid volume within the 2-year-old gland represented only ~50% that of the 2-month-old gland. The lipid volume of the 2-month-old MG comprised 48% of the total MG volume, whereas the lipid content of the 2-year-old MG comprised only 30% of the total MG volume. An interesting finding with important implications to future studies was that the overall cytoplasmic volume within the 2-month and 2-year-old MG appeared similar. To assess cytoplasmic volume, the lipid volume was subtracted from the total MG volume, which yields a cytoplasmic volume of 1.99 × 10⁶ fl for the 2-month-old gland and 1.94 × 10⁶ fl for the 2-year-old gland. In this rather limited sample size, there was apparently little change in the cytoplasmic volume of the gland, although rather large changes in total and lipid volume.
TABLE 1.
Volumetric measurement of total, cell, and lipid volume
| Gland volume |
Lipid volume |
Cytoplasmic volume |
|||
|---|---|---|---|---|---|
| Age | (fl × 106)* | (fl × 106) | % of Total | (fl × 10 6) | % of Total |
| 2 Month | 3.81 | 1.81 | 47.5% | 2.00 | 52.5% |
| 2 Year | 2.78 | 0.83 | 29.9% | 1.95 | 70.1% |
| % Difference | 27.0% | 54.1% | 2.50% | ||
fl = Femtoliter, 10−9 microliters.
DISCUSSION
In this study, a novel imaging approach based on NLO array tomography was used to generate 3-D volume reconstructions and access volumetric changes between a 2-month and a 2-year-old mouse MG. The age-related changes observed were consistent with histopathologic changes noted by Obata et al. in humans, which showed atrophy of the acini (Obata, 2002). More recently, atrophy of the mouse MG was demonstrated by measuring the cross-sectional area of the gland (Nien et al., 2009). Our finding of reduced total gland volume is consistent with these earlier findings. More importantly, NLO array tomography was able to detect decreased acinar size and number and markedly reduced lipid volume with otherwise similar cytoplasmic volume. Although increased sampling with additional ages is needed to confirm these results, the detected preferential loss of acinar lipid volume may play an important role in the development of blepharitis associated with human MGD by reducing the flow of lipid onto the ocular surface leading to increased tear evaporation and evaporative dry eye.
In addition to differences in acinar size and number noted in the 3-D visualizations, the older gland showed regions along the duct that were devoid of acini. Earlier studies using meibography have observed visible loss of MG as a pathognomonic feature of human MGD, and has been referred to as “gland dropout” (Robin et al., 1985; Mathers, 1993). Because meibography appears to only detect the acinar portion of the gland, our findings suggest that “gland dropout” does not involve destruction of the gland per se, but only loss of acinar tissue differentiation along the central duct. Identifying the mechanism regulating acinar growth and differentiation in the MG may therefore be important to explaining age-related MGD as well as suggest novel strategies for stimulating acinar growth and differentiation and treating human MGD. In this regard, NLO array tomography may provide a sensitive approach to assessing the effects of therapy using the aging mouse model.
It should be noted that this approach has several limitations. The first is the amount of time required to reconstruct individual glands. Because each section required approximately 5 minutes to scan, and with 250 sections per block, about 20 hrs of scan time were needed to reconstruct a single MG. This large scanning time limits the ability to collect data from multiple glands. Reorientation of the tissue block to cut coronal, rather then sagital sections, would allow visualization and reconstruction of multiple glands within one section and thereby, reduce the overall scan time needed to collect multiple glands; albeit increasing the number of sections required to cut through the length of the gland.
The second limitation to this technique was the occasional problem of folds or bubbles appearing in the section. Although folds were only detected in 5% of the sections used in each reconstruction, we believe that our method to compensate for this by merging the folded section with the section immediately following it was adequate. However, if folds occur more frequently or in sequential order, our compensation method would become more difficult to apply and probably lead to skewed data. We have tried adding adhesive to the collecting slide to ensure ribbon adherence, but this compounded the problem. Clearly, more work is necessary to perfect the serial sectioning technique to alleviate the folding problem.
In summary, this study demonstrated the use of a new approach to image the mouse MG using NLO array tomography. Using this approach, 3-D volumetric reconstructions were created, which allowed for the visualization and quantitative comparison of the MG in a completely novel way. Although the sample size in this study was small, distinct differences were noted that were consistent with earlier histologic and biomicroscopic reports. Overall, these findings indicate that NLO array tomography can be used to detect structural differences between glands, and identify the effects of age and potential therapeutic intervention on MG structure and function. Our findings also suggest that age-related MG atrophy may involve a marked decrease in the lipid volume with loss of acinar differentiation along the gland duct producing acinar “dropout” similar to what is detected in human age-related MGD.
Acknowledgments
Grant sponsor: NIH; Grant number: EY016663; Grant sponsors: Research to Prevent Blindness, Inc., The Skirball Program in Molecular Ophthalmology, and Alcon.
Footnotes
Additional Supporting Information may be found in the online version of this article.
LITERATURE CITED
- Driver PJ, Lemp MA. Meibomian gland dysfunction. Surv Ophthalmol. 1996;40:343–367. doi: 10.1016/s0039-6257(96)80064-6. [DOI] [PubMed] [Google Scholar]
- Gutgesell VJ, Stern GA, Hood CI. Histopathology of meibomian gland dysfunction. Am J Ophthalmol. 1982;94:383–387. doi: 10.1016/0002-9394(82)90365-8. [DOI] [PubMed] [Google Scholar]
- Hom MM, Martinson JR, Knapp LL, Paugh JR. Prevalence of Meibomian gland dysfunction. Optom Vis Sci. 1990;67:710–712. doi: 10.1097/00006324-199009000-00010. [DOI] [PubMed] [Google Scholar]
- Hykin PG, Bron AJ. Age-related morphological changes in lid margin and meibomian gland anatomy. Cornea. 1992;11:334–342. doi: 10.1097/00003226-199207000-00012. [DOI] [PubMed] [Google Scholar]
- Jester JV, Nicolaides N, Smith RE. Meibomian gland. Histologic and ultrastructural studies. Invest Ophthalmol Vis Sci. 1981;20:537–547. [PubMed] [Google Scholar]
- Jester JV, Rife L, Nii D, Luttrull JK, Wilson L, Smith RE. In vivo biomicroscopy and photography of meibomian glands in a rabbit model of meibomian gland dysfunction. Invest Ophthalmol Vis Sci. 1982;22:660–667. [PubMed] [Google Scholar]
- Kozak I, Bron AJ, Kucharova K, Kluchova D, Marsala M, Heichel CW, Tiffany JM. Morphologic and volumetric studies of the meibomian glands in elderly human eyelids. Cornea. 2007;26:610–614. doi: 10.1097/ICO.0b013e318041f0d2. [DOI] [PubMed] [Google Scholar]
- Mathers WD. Ocular evaporation in meibomian gland dysfunction and dry eye. Ophthalmology. 1993;100:347–351. doi: 10.1016/s0161-6420(93)31643-x. [DOI] [PubMed] [Google Scholar]
- Mathers WD, Lane JA. Meibomian gland lipids, evaporation, and tear film stability. Adv Exp Med Biol. 1998;438:349–360. doi: 10.1007/978-1-4615-5359-5_50. [DOI] [PubMed] [Google Scholar]
- Mathers WD, Shields WJ, Sachdev MS, Petroll WM, Jester JV. Meibomian gland dysfunction in chronic blepharitis. Cornea. 1991;10:277–285. doi: 10.1097/00003226-199107000-00001. [DOI] [PubMed] [Google Scholar]
- Nien CJ, Paugh JR, Massei S, Wahlert AJ, Kao WW, Jester JV. Age-related changes in the meibomian gland. Exp Eye Res. 2009;89:1021–1027. doi: 10.1016/j.exer.2009.08.013. [DOI] [PMC free article] [PubMed] [Google Scholar]
- Obata H. Anatomy and histopathology of human meibomian gland. Cornea. 2002;21:S70–S74. doi: 10.1097/01.ico.0000263122.45898.09. [DOI] [PubMed] [Google Scholar]
- Obata H, Horiuchi H, Miyata K, Tsuru T, Machinami R. Histopathological study of the meibomian glands in 72 autopsy cases. Nippon Ganka Gakkai Zasshi. 1994;98:765–771. [PubMed] [Google Scholar]
- Robin JB, Jester JV, Nobe J, Nicolaides N, Smith RE. In vivo transillumination biomicroscopy and photography of meibomian gland dysfunction. A clinical study. Ophthalmology. 1985;92:1423–1426. doi: 10.1016/s0161-6420(85)33848-4. [DOI] [PubMed] [Google Scholar]
- Shimazaki J, Sakata M, Tsubota K. Ocular surface changes and discomfort in patients with meibomian gland dysfunction. Arch Ophthalmol. 1995;113:1266–1270. doi: 10.1001/archopht.1995.01100100054027. [DOI] [PubMed] [Google Scholar]
- Winkler M, Jester B, Nien-Shy C, Massei S, Minckler DS, Jester JV, Brown DJ. High-resolution three-dimensional reconstruction of the collagenous matrix of the human optic nerve head. Brain Res Bull. 2010;81:339–348. doi: 10.1016/j.brainresbull.2009.06.001. [DOI] [PMC free article] [PubMed] [Google Scholar]