Abstract
Although histone deacetylases (HDACs) are normally considered as co-repressors, HDAC1 has been identified as a coactivator for the glucocorticoid receptor (GR) (Qiu, Y., Zhao, Y., Becker, M., John, S., Parekh, B. S., Huang, S., Hendarwanto, A., Martinez, E. D., Chen, Y., Lu, H., Adkins, N. L., Stavreva, D. A., Wiench, M., Georgel, P. T., Schiltz, R. L., and Hager, G. L. (2006) Mol. Cell 22, 669–679). Furthermore, HDAC1 is acetylated, and its acetylation level is linked to the transcription state of a GR-induced promoter (mouse mammary tumor virus). GR is also known to interact dynamically with regulatory elements in living cells (McNally, J. G., Müller, W. G., Walker, D., Wolford, R., and Hager, G. L. (2000) Science 287, 1262–1265). However, HDAC1 dynamics have never been studied. We demonstrate here that HDAC1 also exchanges rapidly with promoter chromatin, and its exchange rate is significantly modulated during the development of promoter activity. Prior to induction, HDAC1 mobility was retarded compared with the exchange rate for GR. HDAC1 mobility then increased substantially, coordinately with the peak of promoter activity. At later time points, promoter activity was severely repressed, and HDAC1 mobility returned to the rate of exchange observed for the uninduced promoter. Thus, alterations of the exchange rates of HDAC1 at the promoter are correlated with the activity state of the promoter. These findings provide direct evidence for the functional role of highly mobile transcription factor complexes in transcription regulation.
Keywords: Histone Deacetylase, Molecular Dynamics, Nuclear Receptors, Transcription Factors, Transcription Regulation, Acetylation, Fluorescence Recovery after Photobleaching (FRAP)
Introduction
Until recently, the interaction of regulatory proteins with genomic sites has been studied with methods that are insensitive to rapid template interactions, primarily ChIP. Results using these methodologies have been generally interpreted in support of models that invoke long residence times for transcription factors on their cognate regulatory sites. However, characterization of site-specific interaction of the glucocorticoid receptor (GR)4 with a tandem array of the mouse mammary tumor virus (MMTV) promoter in living cells by photobleaching techniques demonstrated that the receptor exchanges rapidly with promoter chromatin (2), leading to a view of rapid nuclear receptor template interaction elaborated in the “hit-and-run” hypothesis (3–7). This model argues that regulatory proteins cycle rapidly on and off the template, bringing many cofactors to the template in a highly stochastic mechanism. Subsequent studies have demonstrated correspondingly high mobilities for other transcription factors and cofactors on a variety of tandem array promoters (8–11) or native gene sites (12, 13).
Histone deacetylases (HDACs) represent one class of co-regulatory proteins that exist in a variety of complexes. These enzymes derive their class name from their well described activities in histone deacetylation and have been widely implicated in gene repression through the hypoacetylation of localized chromatin domains (14–16). However, other studies have shown that many genes are repressed by HDAC inhibitors (17, 18), indicating a more complex role for HDACs in gene regulation than previously anticipated. We have also recently reported that rather than repressing GR-regulated transcription, HDAC1 is a coactivator for GR (1). In addition, HDAC1 is acetylated on the promoter when promoter activity is down-regulated, and acetylated HDAC1 has no deacetylase activity. The results from this study strongly correlate GR-mediated promoter activity with HDAC1 acetylation status (1).
In this study, we characterized the dynamic interactions between HDAC1 and a GR-regulated promoter. We show that HDAC1 is highly mobile on the promoter. Interestingly, HDAC1 mobility is modulated by promoter activity, and this modulation is directly linked to HDAC1 acetylation. HDAC1 may interact with the MMTV promoter via GR-dependent and GR-independent mechanisms. These findings provide important insights into the dynamic behavior of co-regulator complexes at a promoter during gene activation.
EXPERIMENTAL PROCEDURES
Plasmids and Cell Lines
The Cherry-RFP (ChFP)-GR, ChFP-NF1, and HDAC1-GFP plasmids were described previously (1, 19, 20). Cyan fluorescent protein (CFP)-GR was constructed by subcloning GR into the CFP-C1 vector. HDAC1-YFP was a gift from Dr. Keiko Ozato (National Institutes of Health). HDAC1 H141A-GFP was constructed by converting the histidine at amino acid 141 to alanine (21) using site-directed mutagenesis (Agilent Technologies, Santa Clara, CA) according to the manufacturer's protocol. GST-HDAC1 deletion mutants were constructed by PCR. All constructs were confirmed by DNA sequencing. The 3134 cell line and its derivative 3617 (expressing GFP-GR) are mouse adenocarcinoma cell lines containing ∼200 tandem copies of the MMTV promoter with associated reporter genes (2, 22). Cells were grown in DMEM (Invitrogen) supplemented with 10% FBS (HyClone, Logan, UT).
Fluorescence Recovery after Photobleaching (FRAP) and Live Cell Imaging
Prior to live cell imaging and FRAP, 3617 cells transiently transfected by electroporation with GFP-tagged HDAC1 (or mutants) and ChFP-NF1 were transferred to 35-mm glass bottom dishes (MatTek Corp., Ashland, MA) at a density of 2 × 10⁵ in phenol red-free DMEM containing 10% charcoal-stripped FBS (HyClone) and 5 mg/ml tetracycline to suppress GFP-GR expression. Experiments were conducted 16 h later. Tetracycline was omitted from the medium of the 3617 cells transfected with ChFP-tagged HDAC1 (or mutants) to allow the expression of GFP-GR together with the ChFP-tagged constructs. The cells were induced simultaneously, and at each time point, one of the dishes was used for FRAP experiments and discarded afterward. Data from at least three independent experiments were collected and used to generate the corresponding average FRAP curves (±S.E.). All FRAP experiments were carried out on a Zeiss 510 confocal microscope with a 100×/1.3 numerical aperture oil immersion objective, and the cells were kept at 37 °C using an air stream stage incubator (Nevtek, Williamsville, VA). Prior images were acquired in red fluorescence to independently locate the arrays marked by ChFP-NF1. Bleaching was then performed at these sites with the 488- and 514-nm lines from a 45-millwatt argon laser operating at 90% laser power. A single iteration was used for the bleach pulse, and fluorescence recovery was monitored at low laser intensity (0.2% for a 45-milliwatt laser).
Assessing the GR/HDAC1 Interaction by FRET
FRET analysis was performed as described previously (23). In the presence of energy transfer, bleaching of the acceptor YFP results in a significant increase in the fluorescence intensity of the donor CFP. The 3617 cells were transfected with CFP-GR and HDAC1-YFP (in the presence of tetracycline to suppress the expression of GFP-GR). In addition, cells were transfected with CFP-GR and YFP-GR and used as a positive FRET control, as GR is known to form homodimers. For a negative control, 3617 cells were transfected with CFP-GR only. FRET experiments were carried out on a Zeiss 510 confocal microscope with a 100×/1.3 numerical aperture oil immersion objective, and the cells were kept at 37 °C using an air stream stage incubator (Nevtek). Three pre-bleach and three post-bleach images were captured on CFP and YFP channels. Bleaching was done in the YFP channel using a 514-nm laser line at 100% intensity (five iterations). Bleaching due to imaging was minimal because images were collected at low laser intensity (10% of both the 458 nm and 514 nm lasers), and bleaching was monitored by comparison of pre-bleach and post-bleach image pairs. No cross-talk was detected between YFP and CFP channels during imaging. Fluorescence intensities in all regions of interest were corrected for background fluorescence, and FRET efficiency was calculated as described previously (23).
In Vitro Deacetylation Assay
3H-Labeled acetylated histones were isolated from Mel cells as described previously (24, 25). Deacetylation assay were carried out as described (1).
Immunoprecipitation and Western Blotting
Transfection was performed with Lipofectamine 2000 (Invitrogen). At 24–48 h after transfection, cells were harvested and lysed in lysis buffer (20 mm Hepes (pH 7.6), 20% glycerol, 1.5 mm MgCl2, 0.2 mm EDTA, 0.1% Triton X-100, and 1 mm DTT) supplemented with protease inhibitor mixture (Roche Applied Science). Immunoprecipitation and Western blotting were performed as described (1). Anti-GFP polyclonal antibodies were from Invitrogen.
In Vitro GST Pulldown Assay
Bacterially expressed GST or GST-HDAC1 proteins were immobilized on glutathione-Sepharose 4B beads (Pfizer) and washed, and then beads were incubated with in vitro synthesized, 35S-labeled GR protein with GST binding buffer (150 mm NaCl, 50 mm Tris-HCl (pH 8.0), 2 mm EDTA, 0.1% Nonidet P40, and protease inhibitor mixture). Beads were washed with GST binding buffer, and bound proteins were separated by SDS-PAGE. Dried gels were subjected to autoradiography.
Statistical Analysis
To compare overall intensity levels and to compare rates of change in intensity between three groups (uninduced, induced for up to 1 h, and induced for 2–3 h), the mixed linear regression model was used with the intensity in logarithm scale as the dependent variable and group and time as independent variables. The interaction between group and time was carefully assessed. The intensity data were treated as repeated measurements.
RESULTS AND DISCUSSIONS
HDAC1 Mobility Changes upon Gene Activation
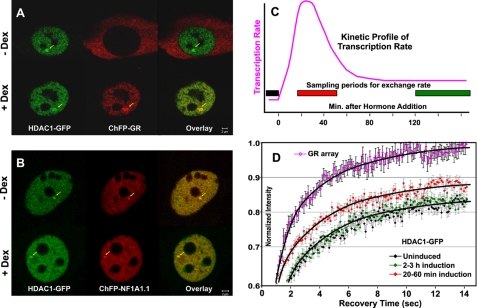
The activation of GR leads to a rapid elevation in MMTV expression levels, followed by an equally rapid decrease in the transcription rate (1, 9). We have shown that GFP-tagged HDAC1 is localized on MMTV arrays, and its loading on the array is independent of dexamethasone induction of GR (1, 19). However, upon dexamethasone induction, HDAC1 associates with GR and is acetylated when MMTV promoter activity is down-regulated. Using the MMTV array cell lines 3134 and 3617, which are mouse adenocarcinoma cell lines containing ∼200 tandem copies of the MMTV promoter with associated reporter genes (2, 22), we demonstrated that changes in HDAC1 acetylation are coupled with MMTV transcription activity (1). It is unclear whether HDAC1 interactions with the MMTV promoter are dynamic and whether the HDAC1 acetylation status will affect HDAC1 dynamics. To address this question, we examined promoter/HDAC1 interactions in living cells. The presence of HDAC1-GFP on the MMTV array can be monitored by dexamethasone-induced GR (Fig. 1A) or ChFP-NF1A1.1 (Fig. 1B) (2, 19, 20). We then examined the dynamics of HDAC1 on the array during the induction cycle. Quantitative FRAP analysis was performed, and FRAP recovery rates at the MMTV promoter array structure were determined. HDAC1-GFP exchanged rapidly with promoter chromatin. However, its exchange rate was much slower compared with the exchange rate of the GFP-GR. In addition, the exchange rate was modulated significantly during the transcription cycle (Fig. 1D). At the time of maximal promoter activity, the mobility of HDAC1 increased, approaching that of GR at the same promoter array. At the later time points, however, HDAC1 mobility returned to levels observed for the uninduced promoter, and this decrease in exchange rate coincided with a dramatic loss of transcription activity (Fig. 1C). Moreover, changes in HDAC1 mobility during the induction cycle coincided with HDAC1 acetylation. Before dexamethasone induction, MMTV chromatin-associated HDAC1 was heavily acetylated, whereas during the activation state, unacetylated HDAC1 predominated at the MMTV promoter. At the late stage of the induction cycle, when MMTV promoter activity is down-regulated, HDAC1 acetylation increases (1).
FIGURE 1.
HDAC1 mobility on the MMTV array changes upon gene activation. A, 3617 cells were transfected with HDAC1-GFP and ChFP-GR in the presence of tetracycline to suppress GFP-GR expression. Arrows indicate HDAC1-GFP and ChFP-GR localization on the MMTV array. For transcription induction, cells were treated with 100 nm dexamethasone (Dex) ∼24 h after the transfection. B, localization of ChFP-NF1A1.1 to the array independently identified the MMTV promoter structures. C, schematic presentation of the kinetic profile of MMTV transcription rates (1, 9). D, FRAP recovery curves of GFP-tagged HDAC1 at the MMTV array before induction (black diamonds), 20–60 min after induction (red diamonds), and 2–3 h after induction (green diamonds). FRAP recovery for GFP-GR is also presented (purple open diamonds). Note that the mobility of GFP-tagged HDAC1 increased dramatically shortly (30–60 min) after dexamethasone treatment (red diamonds) compared with the mobility in uninduced cells (black diamonds) and then returned (green diamonds) to the initial slower mobility after prolonged dexamethasone treatment (120–180 min). The difference between the HDAC1-GFP FRAP recovery curves at the induced, uninduced, and repressed states is statistically highly significant (both p values <0.001). The data represent means ± S.E. from three independent experiments (n ≥ 15 cells).
HDAC1 Mobility Changes Are Linked to HDAC1 Acetylation
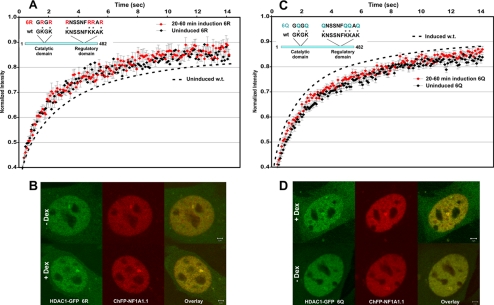
To investigate whether HDAC1 mobility changes during the induction cycle are directly linked to HDAC1 acetylation, we examined the mobility of HDAC1 mutants that are designed to mimic acetylated or unacetylated HDAC1. We have previously demonstrated that HDAC1 is acetylated at six lysine residues (1, 9). In the 6R mutant, these lysines were each converted to arginine to mimic enzymatically active, unacetylated HDAC1 (Fig. 2A). In the 6Q mutant, all six lysines were converted to glutamine, which mimics the acetylated form of HDAC1 (Fig. 2C). As for acetylated HDAC1, this mutant has no deacetylase activity (1). Cellular localization of the GFP-tagged HDAC1 6R and 6Q mutants was identical to that of wild-type HDAC1, and both mutants colocalized with GR to the MMTV array locus (Fig. 2, B and D). However, in contrast to wild-type HDAC1, FRAP analysis showed that the mobility of both mutants remained unchanged during the induction cycle (Fig. 2, A and C). Moreover, the HDAC1 6R mutant manifested an exchange rate similar to the exchange rate of wild-type HDAC1 at the fully activated stage of the induction cycle (Fig. 2A and supplemental Fig. 1), whereas the mobility for the HDAC1 6Q mutant was similar to that for wild-type HDAC1 at either the uninduced or late stage of the induction cycle (Fig. 2C and supplemental Fig. 2). These results indicate that HDAC1 mobility at the promoter array is directly linked to its post-translational modification status.
FIGURE 2.
HDAC1 modifications significantly change HDAC1 mobility. A, FRAP analysis of the GFP-tagged HDAC1 6R mutant at the MMTV array before and after dexamethasone induction. The lysine-to-arginine mutant of HDAC1, which mimics unmodified HDAC1, exhibited accelerated mobility identical to the mobility of wild-type HDAC1 at early time points (30–60 min) upon dexamethasone treatment. The mobility did not change throughout the induction cycle. B, the GFP-tagged HDAC1 6R mutant was enriched at the MMTV locus marked by ChFP-NF1A1.1 in both induced and uninduced cells. Dex, dexamethasone. C, FRAP analysis of the GFP-tagged HDAC1 6Q mutant at the MMTV array before and after dexamethasone induction. The lysine-to-glutamine mutant of HDAC1, which mimics acetylated HDAC1, exhibited retarded mobility identical to the mobility of wild-type HDAC1 in the uninduced state or at later time points (60–120 min) upon dexamethasone treatment. The mobility did not change throughout the induction cycle. D, the GFP-tagged HDAC1 6Q mutant colocalized with ChFP-NF1A1.1 at the array locus in both induced and uninduced cells. The data are means ± S.E. from three independent experiments (n ≥15 cells).
Deacetylase Activity Does Not Influence HDAC1 Mobility
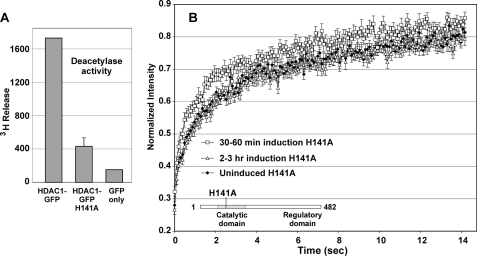
Because acetylated HDAC1 has diminished deacetylase activity (1), we considered whether the observed change in the HDAC1 mobility upon acetylation results from the loss of enzyme activity. We first verified that GFP-tagged HDAC1 is a fully active enzyme. HDAC1-GFP was transfected into 3134 cells, and the resulting nuclear extract was immunoprecipitated with anti-GFP antibody. We found that the precipitant has significant deacetylase activity (Fig. 3A), indicating that GFP-tagged HDAC1 retains enzyme activity. Next, we examined the HDAC1 mutant H141A (Fig. 3A), which was reported to have very low deacetylase activity but unaltered association with other factors (26). We found that GFP-tagged HDAC1 H141A localized at the MMTV array (supplemental Fig. 3) and displayed a mobility profile similar to the profile of wild-type HDAC1 (Fig. 3B). This result indicates that HDAC1 enzyme activity does not contribute significantly to the observed mobility changes, suggesting that acetylation on HDAC1 lysine residues per se results in the mobility change in the MMTV promoter.
FIGURE 3.
Loss of deacetylase activity does not affect the HDAC1 mobility profile during gene activation. A, deacetylase activity of GFP-tagged HDAC1 H141A. Cell extracts from HDAC1-GFP- and HDAC1 H141A-GFP-transfected 3134 cells were immunoprecipitated with anti-GFP or IgG (background control) antibody, and the deacetylation activity of the resulting immunoprecipitates was determined. The GFP-tagged HDAC1 H141A mutant, harboring a point mutation in the HDAC1 catalytic domain, had lost its deacetylase activity. B, FRAP analysis of GFP-tagged HD1 H141A on the MMTV array revealed mobility similar to the wild-type HDAC1 mobility. The data are means ± S.E. from three independent experiments (n ≥15 cells).
HDAC1 Associates with GR on the MMTV Promoter
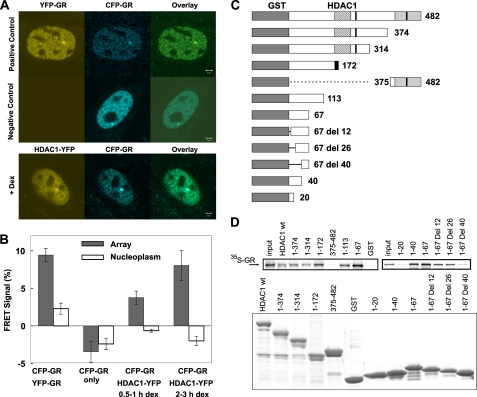
Because HDAC1 is in GR-associated complexes and both are present at the MMTV array, GR dynamics could be responsible, at least in part, for the HDAC1 mobility changes. We employed the FRET assay to determine whether CFP-GR and YFP-tagged HDAC1 interact physically at the promoter (Fig. 4A). In this assay, FRET signals from CFP to YFP were determined by the acceptor photobleaching method using confocal microscopy (23). The results support a direct interaction between GR and HDAC1 during both the activation and repression phases (Fig. 4B). As a positive control, we performed FRET using the CFP-GR/YFP-GR pair, detecting the well characterized GR homodimers. The FRET signal from CFP-GR to YFP-tagged HDAC1 was observed at ∼60% that of the CFP-GR/YFP-GR FRET signal. This result indicates that GR and HDAC1 physically interact at the promoter. Interestingly, the FRET signal between GR and HDAC1 did not change throughout the course of promoter progression. This agrees with our previous observation that GR/HDAC1 interaction did not change during the induction cycle in an immunoprecipitation assay (1).
FIGURE 4.
HDAC1 and GR physically interact at the MMTV array. A, HDAC1-YFP/CFP-GR FRET pair and YFP-GR/CFP-GR FRET pair colocalized at the MMTV array site. Dex, dexamethasone. B, YFP-GR/HDAC1-CFP interaction measured by FRET. The FRET signal between YFP-GR and CFP-GR served as a positive control. C, schematic representation of GST-HDAC1 constructs. D, various GST-HDAC1 fusion proteins were purified from Escherichia coli. The GST pulldown assays were performed in the presence of 35S-labeled GR or HDAC1. The results demonstrate that amino acids 26–40 of HDAC1 are important for GR/HDAC1 and HDAC1/HDAC1 interactions.
Given these findings, we performed GST pulldown experiments to characterize potential HDAC1- and GR-interacting domains. Wild-type HDAC1 and a series of deletion mutants were fused with GST, and the resulting proteins were bound to glutathione beads (Fig. 4C). After incubation with in vitro translated, radiolabeled GR, GR/GST-HDAC1 interactions were detected by autoradiography. The results indicate that HDAC1 interacts directly with GR. Furthermore, the interaction domain for HDAC1 appears to be localized within N-terminal amino acids 26–40 (Fig. 4D).
HDAC1 can either form homo-oligomers or hetero-oligomerize with HDAC2 or HDAC3 (19, 27). An interaction domain is also located within amino acids 26–40 (19, 27). Interestingly, this region was also shown to be important for HDAC1 association with Sin3A, Sin3B, and RbAp48 (Rb-associated protein 48) (27). This suggests that the N terminus of HDAC1 harbors an important domain responsible for its interaction with multiple proteins.
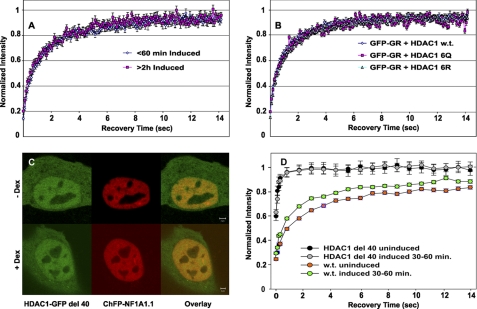
Because we demonstrated that HDAC1 physically interacts with GR during the induction cycle at the MMTV array and also showed that the mobility of HDAC1 changes during the cycle, we also investigated whether GR mobility changes accordingly. Surprisingly, FRAP analysis showed that GR mobility did not change throughout the induction cycle (Fig. 5A). To further test whether the HDAC1 modification state can affect GR mobility, GFP-GR was cotransfected with HDAC1, HDAC1 6Q, or HDAC1 6R. Again, GR mobility was unaffected by coexpression of either HDAC1 or the mutant proteins (Fig. 5B). We conclude that although HDAC1 mobility changes dramatically during the transcription cycle, GR mobility is not significantly affected, suggesting that HDAC1 may interact with the MMTV promoter via GR-dependent and GR-independent mechanisms.
FIGURE 5.
GFP-GR FRAP recovery at the MMTV array is HDAC1-independent. A, GR mobility did not change throughout the induction cycle. B, FRAP analysis of GR mobility at the MMTV array in cells coexpressing HDAC1 or the HDAC1 6R or HDAC1 6Q mutant demonstrated that GR mobility was not influenced by HDAC1 mobility. C, the GFP-tagged HDAC1 del 40 mutant was not enriched at the MMTV array locus. Dex, dexamethasone. D, FRAP analysis of the GFP-tagged HDAC1 del 40 mutant during the dexamethasone induction cycle. The FRAP recovery curves of wild-type HDAC1-GFP are also shown as references. The GFP-tagged HDAC1 del 40 mutant, which was unable to bind to GR and HDAC1, was highly mobile. The data are means ± S.E. from three independent experiments (n ≥15 cells).
Mobility of HDAC1 Is Influenced by Its Ability to Form Complexes
To further test whether the mobility of HDAC1 is influenced by its ability to interact with other proteins, GFP-tagged HDAC1 del 40, which lacks the first 40 amino acids, was constructed. This construct lacks the interaction region for oligomerization and for its interaction with GR or mSin3A (27). When this construct was transfected into 3617 cells, although the protein is mainly nuclear, no enrichment at the ChFP-NF1A1.1-marked array was detected (Fig. 5C). FRAP analysis at the array structure showed that this mutant protein was highly mobile under either induced or uninduced conditions (Fig. 5D). Thus, HDAC1 must be recruited to the promoter in a multiprotein complex. Disruption of the complex completely eliminates the interaction between HDAC1 and the promoter.
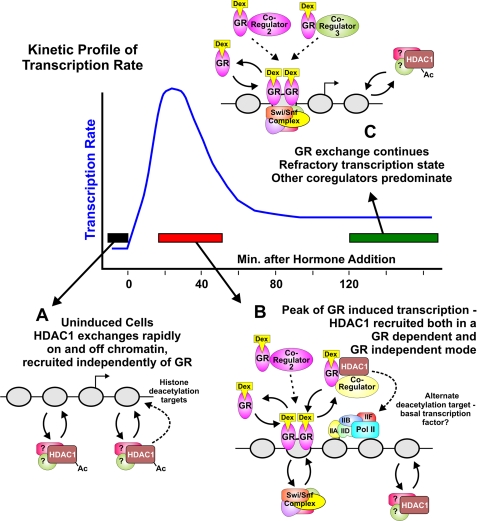
The findings described here provide important support for the hypothesis that many transcription factors and cofactors act very transiently at regulatory sites in chromatin. Furthermore, the evidence presented here shows that the precise residence time for a given regulatory factor can change over time and is linked to the activity state of the promoter. HDAC1 exists in multiple protein complexes, including those containing HDAC2, GR, Sin3A, or Brg1 (1). It is conceivable that acetylated HDAC1 associates with distinct complexes from its wild-type counterpart, as preliminary data showed that HDAC1 acetylation decreases the interaction with HDAC2.5 Each of these complexes is characterized by a unique exchange rate, with alternate members predominating at varying times during the induction cycle, resulting in transcription activation or repression (Fig. 6). This observation argues in turn that the rapid exchange events now characterized for a wide range of transcription factors represent functional and productive interactions with the promoter structure.
FIGURE 6.
HDAC1 exchange dynamics vary with promoter activity state. Shown is a model for the HDAC1 interactions during MMTV promoter activation and down-regulation. A, uninduced promoter; B, MMTV promoter at the peak of GR-induced transcription; C, refractory transcription state. Dex, dexamethasone; Pol II, polymerase II.
Supplementary Material
Acknowledgments
We thank Tatiana Karpova and Jim McNally (Laboratory of Receptor Biology and Gene Expression Fluorescence Imaging Facility, NCI, National Institutes of Health).
This work was supported, in whole or in part, by the National Institutes of Health Intramural Research Program and Grant R01 HL095674-01 (to Y. Q.). This work was also supported by the Bankhead-Coley Research Foundation (to Y. Q.).

The on-line version of this article (available at http://www.jbc.org) contains supplemental Figs. 1–3.
Y. Qiu, unpublished data.
- GR
- glucocorticoid receptor
- MMTV
- mouse mammary tumor virus
- HDAC
- histone deacetylase
- ChFP
- Cherry-RFP
- CFP
- cyan fluorescent protein
- FRAP
- fluorescence recovery after photobleaching.
REFERENCES
- 1. Qiu Y., Zhao Y., Becker M., John S., Parekh B. S., Huang S., Hendarwanto A., Martinez E. D., Chen Y., Lu H., Adkins N. L., Stavreva D. A., Wiench M., Georgel P. T., Schiltz R. L., Hager G. L. (2006) Mol. Cell 22, 669–679 [DOI] [PubMed] [Google Scholar]
- 2. McNally J. G., Müller W. G., Walker D., Wolford R., Hager G. L. (2000) Science 287, 1262–1265 [DOI] [PubMed] [Google Scholar]
- 3. Hager G. L., Elbi C., Becker M. (2002) Curr. Opin. Genet. Dev. 12, 137–141 [DOI] [PubMed] [Google Scholar]
- 4. Hager G. L., Elbi C., Johnson T. A., Voss T., Nagaich A. K., Schiltz R. L., Qiu Y., John S. (2006) Chromosome Res. 14, 107–116 [DOI] [PubMed] [Google Scholar]
- 5. Hager G. L., Nagaich A. K., Johnson T. A., Walker D. A., John S. (2004) Biochim. Biophys. Acta 1677, 46–51 [DOI] [PubMed] [Google Scholar]
- 6. Rayasam G. V., Elbi C., Walker D. A., Wolford R., Fletcher T. M., Edwards D. P., Hager G. L. (2005) Mol. Cell. Biol. 25, 2406–2418 [DOI] [PMC free article] [PubMed] [Google Scholar]
- 7. Nagaich A. K., Rayasam G. V., Martinez E. D., Becker M., Qiu Y., Johnson T. A., Elbi C., Fletcher T. M., John S., Hager G. L. (2004) Ann. N.Y. Acad. Sci. 1024, 213–220 [DOI] [PubMed] [Google Scholar]
- 8. Agresti A., Scaffidi P., Riva A., Caiolfa V. R., Bianchi M. E. (2005) Mol. Cell 18, 109–121 [DOI] [PubMed] [Google Scholar]
- 9. Becker M., Baumann C., John S., Walker D. A., Vigneron M., McNally J. G., Hager G. L. (2002) EMBO Rep. 3, 1188–1194 [DOI] [PMC free article] [PubMed] [Google Scholar]
- 10. Bosisio D., Marazzi I., Agresti A., Shimizu N., Bianchi M. E., Natoli G. (2006) EMBO J. 25, 798–810 [DOI] [PMC free article] [PubMed] [Google Scholar]
- 11. Sharp Z. D., Mancini M. G., Hinojos C. A., Dai F., Berno V., Szafran A. T., Smith K. P., Lele T. P., Lele T. T., Ingber D. E., Mancini M. A. (2006) J. Cell Sci. 119, 4101–4116 [DOI] [PubMed] [Google Scholar]
- 12. Dundr M., Hoffmann-Rohrer U., Hu Q., Grummt I., Rothblum L. I., Phair R. D., Misteli T. (2002) Science 298, 1623–1626 [DOI] [PubMed] [Google Scholar]
- 13. Karpova T. S., Kim M. J., Spriet C., Nalley K., Stasevich T. J., Kherrouche Z., Heliot L., McNally J. G. (2008) Science 319, 466–469 [DOI] [PubMed] [Google Scholar]
- 14. Grozinger C. M., Schreiber S. L. (2002) Chem. Biol. 9, 3–16 [DOI] [PubMed] [Google Scholar]
- 15. Sengupta N., Seto E. (2004) J. Cell Biochem. 93, 57–67 [DOI] [PubMed] [Google Scholar]
- 16. Strahl B. D., Allis C. D. (2000) Nature 403, 41–45 [DOI] [PubMed] [Google Scholar]
- 17. Chang S., Pikaard C. S. (2005) J. Biol. Chem. 280, 796–804 [DOI] [PubMed] [Google Scholar]
- 18. Reid G., Métivier R., Lin C. Y., Denger S., Ibberson D., Ivacevic T., Brand H., Benes V., Liu E. T., Gannon F. (2005) Oncogene 24, 4894–4907 [DOI] [PubMed] [Google Scholar]
- 19. Luo Y., Jian W., Stavreva D., Fu X., Hager G., Bungert J., Huang S., Qiu Y. (2009) J. Biol. Chem. 284, 34901–34910 [DOI] [PMC free article] [PubMed] [Google Scholar]
- 20. Stavreva D. A., Wiench M., John S., Conway-Campbell B. L., McKenna M. A., Pooley J. R., Johnson T. A., Voss T. C., Lightman S. L., Hager G. L. (2009) Nat. Cell Biol. 11, 1093–1102 [DOI] [PMC free article] [PubMed] [Google Scholar]
- 21. Taunton J., Hassig C. A., Schreiber S. L. (1996) Science 272, 408–411 [DOI] [PubMed] [Google Scholar]
- 22. Walker D., Htun H., Hager G. L. (1999) Methods 19, 386–393 [DOI] [PubMed] [Google Scholar]
- 23. Karpova T. S., Baumann C. T., He L., Wu X., Grammer A., Lipsky P., Hager G. L., McNally J. G. (2003) J. Microsc. 209, 56–70 [DOI] [PubMed] [Google Scholar]
- 24. Huang S., Brandt S. J. (2000) Mol. Cell. Biol. 20, 2248–2259 [DOI] [PMC free article] [PubMed] [Google Scholar]
- 25. Rundlett S. E., Carmen A. A., Kobayashi R., Bavykin S., Turner B. M., Grunstein M. (1996) Proc. Natl. Acad. Sci. U.S.A. 93, 14503–14508 [DOI] [PMC free article] [PubMed] [Google Scholar]
- 26. Hassig C. A., Tong J. K., Fleischer T. C., Owa T., Grable P. G., Ayer D. E., Schreiber S. L. (1998) Proc. Natl. Acad. Sci. U.S.A. 95, 3519–3524 [DOI] [PMC free article] [PubMed] [Google Scholar]
- 27. Taplick J., Kurtev V., Kroboth K., Posch M., Lechner T., Seiser C. (2001) J. Mol. Biol. 308, 27–38 [DOI] [PubMed] [Google Scholar]
Associated Data
This section collects any data citations, data availability statements, or supplementary materials included in this article.


