

Abstract
Objective
Assess Aβ deposition longitudinally and explore its relationship with cognition and disease progression.
Methods
Clinical follow-up was obtained 20 ± 3 months after [11C]Pittsburgh compound B (PiB)-positron emission tomography in 206 subjects: 35 with dementia of the Alzheimer type (DAT), 65 with mild cognitive impairment (MCI), and 106 age-matched healthy controls (HCs). A second PiB scan was obtained at follow-up in 185 subjects and a third scan after 3 years in 57.
Results
At baseline, 97% of DAT, 69% of MCI, and 31% of HC subjects showed high PiB retention. At 20-month follow-up, small but significant increases in PiB standardized uptake value ratios were observed in the DAT and MCI groups, and in HCs with high PiB retention at baseline (5.7%, 2.1%, and 1.5%, respectively). Increases were associated with the number of apolipoprotein E ε4 alleles. There was a weak correlation between PiB increases and decline in cognition when all groups were combined. Progression to DAT occurred in 67% of MCI with high PiB versus 5% of those with low PiB, but 20% of the low PiB MCI subjects progressed to other dementias. Of the high PiB HCs, 16% developed MCI or DAT by 20 months and 25% by 3 years. One low PiB HC developed MCI.
Interpretation
Aβ deposition increases slowly from cognitive normality to moderate severity DAT. Extensive Aβ deposition precedes cognitive impairment, and is associated with ApoE genotype and a higher risk of cognitive decline in HCs and progression from MCI to DAT over 1 to 2 years. However, cognitive decline is only weakly related to change in Aβ burden, suggesting that downstream factors have a more direct effect on symptom progression.
In vivo amyloid imaging with positron emission tomography (PET) allows longitudinal study of Aβ deposition in an individual and should provide unique information on the relationship between Aβ and cognitive decline. Although it is likely that Aβ plays a fundamental role in the development of dementia of the Alzheimer type (DAT),1 postmortem studies have not consistently demonstrated a relationship between the density of amyloid plaques and the severity of dementia.2–5
The time course of plaque formation is unclear. Studies comparing the plaque density at brain biopsy in DAT patients to that assessed in those same patients at postmortem several years later found little change in the majority of patients, but these studies had few participants.6–9 An additional perplexing postmortem observation is the high prevalence of amyloid plaques in the normal elderly. It has been postulated that this represents preclinical DAT, but this cannot be proven by autopsy-based studies. In vivo Aβ imaging provides the means to address these questions through longitudinal observation. Cross-sectional [11C]Pittsburgh compound B (PiB) PET studies have shown a robust difference between the retention patterns in DAT patients and healthy controls (HCs).10,11 In agreement with postmortem data,2 approximately 20 to 30% of elderly HC subjects show some degree of increased cortical PiB retention, predominantly in the prefrontal cortex and posterior cingulate/precuneus areas.10,12–14
Polymorphism of the apolipoprotein E (ApoE) allele is among the most consistent genetic risk factors associated with sporadic DAT, and its presence is thought to result in an earlier age of onset.15,16 Examination of ApoE ε4 allele status revealed that healthy ε4 carriers present with significantly higher PiB retention than ε4 noncarriers and show increased retention at an earlier age, further emphasizing the crucial role that ApoE plays in the metabolism of Aβ.10,17–20
Recently, several studies have found significant increases in PiB retention in some individuals over 1 to 2 years, but no overall increase in mean PiB retention in groups of subjects with DAT or mild cognitive impairment (MCI). These studies did report a higher conversion rate from MCI to DAT in those with high PiB retention, despite a lack of significant change in PiB retention in those who progressed.21–24
The objectives of this study were to quantify the progression of Aβ plaque formation in the brain over time with PiB PET in a large number of individuals and to correlate Aβ plaque burden at baseline and follow-up with clinical measures of disease severity, cognitive decline, and ApoE status.
Subjects and Methods
Participants
Written informed consent was obtained from all participants. Approval for the study was obtained from the Austin Health Human Research Ethics Committee. HCs were recruited by advertisement and from the Melbourne Healthy Aging Study, whereas the MCI and DAT participants were recruited from the Austin Health Memory Disorders Clinic. About 40% of the participants were subsequently enrolled into the Australian Imaging, Biomarkers, and Lifestyle study of ageing.19,25 The study commenced in September 2004 and was designed to restudy all participants every 18 months. To date, 239 participants have reached the first follow-up time point. Thirty-three subjects withdrew from the study for the following reasons: 4 died, 3 had severe stroke, 4 developed terminal cancer, 17 DAT patients and 1 MCI participant were withdrawn by their caregivers, and 3 DAT patients and 1 MCI subject were not contactable. Consequently 106 HC, 65 MCI, and 35 DAT subjects or 86% of those enrolled and eligible (100% of HCs, 97% of MCI, and 57% of DAT) were clinically reassessed 20 ± 3 months after their initial PiB scan. One hundred four HC, 48 MCI, and 33 DAT subjects had a second PiB PET scan at that stage. A third PiB-PET scan was obtained in 34 HC, 12 MCI, and 11 DAT subjects after a 3-year (38 ± 3 months) follow-up.
At each visit, subjects were classified as HCs, MCI, or DAT by consensus between a neurologist and a neuropsychologist blind to PiB status. All DAT patients met National Institute of Neurological and Communicative Disorders and Stroke-Alzheimer’s Disease and Related Disorders Association criteria for probable Alzheimer disease,26 whereas all participants in the MCI group met the criteria of subjective and objective cognitive difficulties in the absence of significant functional loss.27 MCI participants were further classified a amnestic MCI (n = 53) or nonamnestic MCI (4 nonamnestic single domain and 8 nonamnestic multiple domain). All HC subjects performed within < 1.5 standard deviations (SDs) of the published norms for their age group on neuropsychological tests.
To establish the test-retest reproducibility of the technique, 4 subjects not included in the cohort (2 male/2 female, 79 ± 7 years old) underwent 2 PiB PET scans between 7 and 60 days apart (30 ± 24 days).
ApoE genotype was determined by direct sequencing.
Neuropsychological Evaluation
A composite episodic memory score was calculated by taking the average of the z scores (generated using 65 low PiB HCs with normal MRI as the reference) for Rey Complex Figure Test (RCFT, 30 minutes) long delay and California Verbal Learning Test, Second Edition long delay, as previously described.14 A composite nonmemory cognition score was calculated by taking the average of the z scores for the Boston Naming Test, letter fluency, category fluency, Digit Span forwards and backwards, Digit Symbol-Coding, and Rey Complex Figure Test and Recognition Trial copy.
Magnetic Resonance Imaging
All subjects underwent a clinical magnetic resonance imaging (MRI) for screening and subsequent co-registration with the PET images. A fluid attenuated inversion recovery sequence was obtained for exclusion of subjects with cortical stroke.
PET
Each subject received ~370MBq PiB intravenously over 1 minute. A 30-minute acquisition in 3-dimensional (3D) mode starting 40 minutes after injection of PiB was performed with a Philips (Amsterdam, the Netherlands) Allegro PET camera. A transmission scan was performed for attenuation correction. PET images were reconstructed using a 3D RAMLA algorithm.
Image Analysis
Images were processed with both a semiautomatic and a fully automatic region of interest (ROI) method with and without partial volume correction. The semiautomatic method used a preset template of narrow cortical ROIs that were applied to the PiB scan via placement on the subjects’s coregistered MRI by an operator who was blind to the subject’s clinical status. Minor manual adjustments on the MRI were made to ensure that overlap with white matter and cerebrospinal fluid (CSF) was minimized. For the fully automated method with partial volume correction, the T1- and T2-weighted MRI images for each subject were segmented into gray matter (GM), white matter (WM), and CSF using an implementation of the expectation maximization segmentation algorithm.28 The algorithm computed probability maps for each tissue type, assigning each voxel to its most likely tissue type. The Montreal Neurological Institute single-subject MRI brain template29 and corresponding Automated Anatomical Labeling ROI template30 and tissue priors were spatially normalized to each participant to automatically obtain a parcellation and provide spatial priors for GM, WM, and CSF to guide the segmentation.
Coregistration of each individual’s MRI with the PET images was performed with MilxView, developed by the Australian e-Health Research Centre–BioMedIA (Brisbane, Australia). The ROI template was placed on the coregistered MRI and then transferred to the coregistered PET images. PET data were corrected for partial volume effects using a 3-compartment model as previously described.31
Follow-up PiB images were coregistered with the initial PiB images, and the same ROI templates were applied to baseline and follow-up scans. Standardized uptake values (SUVs) for PiB were calculated for all brain regions examined and SUV ratios (SUVRs) were generated by dividing all regional SUVs by the cerebellar cortex SUV. ROI measurements were averaged across both hemispheres. Neocortical Aβ burden was expressed as the average SUVR of the area-weighted mean of frontal, superior parietal, lateral temporal, lateral occipital, and anterior and posterior cingulate regions.
Determination of Cutoff Values
In contrast with the normal distribution observed in the clinical and other variables, a bimodal distribution of PiB SUVRs was observed in HCs. Consequently, to identify a PiB SUVR cutoff, a hierarchical cluster analysis was performed on all elderly HC research participants at Austin Health (n = 118; age, 73.2 ± 7.4 years; Mini Mental State Examination [MMSE], 29.2 ± 1.0) that yielded a cutoff for high or low neocortical SUVR of 1.5, consistent with cutoff values used in previous PiB-PET studies.31,32
Statistical Evaluation
Normality of distribution was tested using the Shapiro-Wilk test and visual inspection of variable histograms. Statistical evaluations between groups were performed using a Tukey-Kramer honest significance difference test to establish differences between group means, and by a Dunnet test to compare each group with controls. Paired Student t tests were used to assess within-group changes in PiB retention between the initial and follow-up studies. Categorical differences were evaluated using Fisher exact test. Pearson product-moment correlation analyses were conducted between PiB SUVRs and clinical features. Bonferroni corrections for multiple comparisons were performed on the regional (significance, p = 0.004) and correlational (significance, p = 0.01) analysis. Given the significant association between PiB SUVRs and age, all comparisons and correlations were corrected for age effects, and also for years of education. Data are presented as mean ± SD unless otherwise stated.
Results
Baseline Findings
Demographic characteristics of the cohort are shown in Table 1. At baseline, there were significant differences between the groups only in MMSE, Clinical Dementia Rating (CDR), and ApoE status. SUV measurements in the cerebellar cortex showed no difference between baseline and follow-up (Table 2), confirming its suitability as a reference region for PiB scan normalization.
TABLE 1.
Demographics
| Characteristic | HC | MCI | DAT |
|---|---|---|---|
| Clinical follow-up, No. | 106 | 65 | 35 |
| Age at baseline, yr | 73.1±7.5 | 73.4±8.5 | 71.7±8.9 |
| Gender, M/F | 54/52 | 36/29 | 19/16 |
| Years of education | 13.2±3.5 | 12.2±4.3 | 11.9±3.4 |
| MMSE at baseline | 29.2±1.0 | 26.5±2.9a | 22.5±3.7a |
| CDR at baseline | 0.07±0.17 | 0.47±0.17a | 0.93±0.35a |
| CDR SOB at baseline | 0.16±0.41 | 1.56±1.11a | 4.53±2.15a |
| %ApoE ε4 | 33% | 63%b | 71%b |
| Repeat PiB PET scan, No. | 104 | 48 | 33 |
| Time PET2 – PET1, mo | 20±3 | 20±3 | 20±5 |
Significantly different from HC (p < 0.05).
Significantly different from HC (Fisher exact test p < 0.01).
HC = healthy control; MCI = mild cognitive impairment; DAT = dementia of the Alzheimer type; MMSE = Mini mental state examination; CDR = Clinical Dementia Rating; SOB = sum of boxes; ApoE = apolipoprotein E; PiB = [11C]Pittsburgh compound B; PET = positron emission tomography.
TABLE 2.
Baseline and Follow-up Values
| Measure | HC |
MCI |
DAT |
||||||
|---|---|---|---|---|---|---|---|---|---|
| A | B | C | A | B | C | A | B | C | |
| Follow-up time, mo | 20±3 | 38±4 | 20±3 | 39±2 | 20±5 | 39±2 | |||
| All, No. | 104 | 104 | 34 | 48 | 48 | 12 | 33 | 33 | 11 |
| Neocortical SUVRa | 1.41±0.40 | 1.42±0.41 | 1.47±0.43b,c | 1.92±0.62 | 1.95±0.63b | 2.12±0.86b | 2.26±0.38 | 2.39±0.38b | 2.39±0.45b |
| MMSEa | 29.2±0.98 | 29.0±1.30 | 28.7±1.42b,c | 26.9±2.47 | 25.8±2.83b | 25.5±3.31 | 22.7±3.62 | 20.1±5.84b | 17.7±4.81b |
| CDRa | 0.06±0.17 | 0.18±0.90 | 0.14±0.29 | 0.47±0.19 | 0.58±0.28b | 0.65±0.24 | 0.94±0.35 | 1.35±0.92b | 1.40±0.52b |
| Composite memorya | −0.19±0.87 | −0.09±1.00 | −0.43±1.32 | −2.18±1.00 | −2.47±1.03b | −2.38±1.23 | −3.27±0.55 | −3.31±0.76 | −3.62±0.33b |
| Composite nonmemorya | −0.03±0.62 | −0.12±0.63 | −0.17±0.73b,c | −0.90±0.84 | −1.11±0.96b | 1.53±0.80b,c | −2.33±1.48 | −3.11±2.14b | −3.19±1.35b,c |
| Cerebellar cortex SUV | 0.505±0.056 | 0.500±0.062 | 0.507±0.074 | 0.537±0.084 | 0.537±0.082 | 0.540±0.097 | 0.554±0.104 | 0.554±0.098 | 0.557±0.153 |
| High PiB, No. | 32 | 32 | 10 | 31 | 31 | 7 | 32 | 32 | 10 |
| Neocortical SUVR | 1.95±0.27 | 1.98±0.27b | 2.0±60.28b,c | 2.30±0.40 | 2.35±0.39b | 2.74±0.49b | 2.29±0.34 | 2.42±0.32b | 2.50±0.29b |
| MMSEa | 29.0±1.22 | 28.4±1.66 | 27.7±1.95b,c | 26.2±2.60 | 25.0±2.98b | 23.8±2.79b | 22.8±3.68 | 20.1±5.84b | 17.9±5.06b |
| CDRa | 0.08±0.18 | 0.20±0.25b | 0.30±0.42 | 0.48±0.16 | 0.63±0.26b | 0.75±0.27 | 0.94±035 | 1.37±0.94b | 1.44±0.53b |
| Composite memorya | −0.05±0.94 | 0.37±1.22 | −1.57±1.34b,c | −2.57±0.84 | −2.84±0.86 | −3.09±0.74 | −3.28±0.56 | −3.30±0.77 | −3.66±0.33c |
| Composite nonmemorya | −0.07±0.71 | −0.13±0.60 | −0.60±0.86b,c | −0.89±0.82 | −1.10±0.95 | −1.64±1.01b,c | −2.29±1.48 | −3.11±2.19b | −3.05±1.38b,c |
| Low PiB, No. | 72 | 72 | 24 | 17 | 17 | 5 | 1 | 1 | 1 |
| Neocortical SUVR | 1.18±0.10 | 1.18±0.11 | 1.22±0.12 | 1.21±0.12 | 1.23±0.14 | 1.25±0.21 | 1.20 | 1.23 | 1.32 |
| MMSE | 29.3±0.85 | 29.2±1.00 | 29.2±0.83 | 28.1±1.63 | 27.3±1.82 | 28.0±2.45 | 22.0 | 21.0 | 16.0 |
| CDRa | 0.06±0.16 | 0.17±1.06 | 0.07±0.18 | 0.44±0.25 | 0.47±0.29 | 0.50±0.00 | 1.00 | 1.00 | 1.00 |
| Composite memorya | −0.05±0.81 | 0.05±0.86 | 0.11±0.93 | −1.44±0.88 | −1.80±1.01 | −1.32±1.04 | −3.16 | −3.62 | −3.32 |
| Composite nonmemorya | −0.01±0.61 | −0.11±0.65 | 0.02±0.60 | −0.94±0.90 | −1.13±1.02 | −1.38±0.41 | −3.71 | −3.30 | −4.27 |
DAT and MCI significantly different from HC (p < 0.05).
Follow–up values significantly different from their baseline (A) (p < 0.05).
Second (C) follow-up values significantly different from their first follow-up (B) (p < 0.05).
HC = healthy controls; MCI = mild cognitive impairment; DAT = dementia of the Alzheimer type; SUVR = standardized uptake value ratio; MMSE = Mini Mental State Examination; CDR = Clinical Dementia Rating; SUV = standardized uptake value; PiB = [11C]Pittsburgh compound B.
The DAT subjects who withdrew from the study did not differ in age (73.1 ± 9.4 vs 71.7 ± 8.9), MMSE (21.3 ± 4.9 vs 22.5 ± 3.7), or PiB SUVR (2.34 ± 0.4 vs 2.26 ± 0.4) from the remaining DAT subjects.
Partial Volume Correction
Partial volume correction (PVC) obtained through the fully automated approach yielded 11%, 24%, and 30% higher baseline PiB SUVRs than those without PVC for the HC, MCI, and DAT groups, respectively, but no difference in the percentage change between baseline and follow-up scans overall or in any group. Comparison of fully automatic PVC data with non-PVC semiautomatic sampling yielded less marked differences in SUVRs in the PVC data. Baseline and follow-up MRI images were frequently acquired in different scanners and using different magnetic resonance (MR) sequences, adding a potential source of noise to GM segmentation and the subsequent partial volume correction. As we could not account for the variability in MR acquisition, and because similar trends are obtained using PVC and non-PVC data, the non-PVC results are presented.
PiB Baseline Results
At entry, 34 of the 35 DAT patients (97%) and 45 of the 65 MCI subjects (69%) were classified as high PiB (neocortical SUVR > 1.5). Thirty-three of 106 HCs (31%) presented with high PiB retention, with increased retention predominantly seen in the prefrontal and posterior cingulate/precuneus regions. Neocortical Aβ burden was significantly different between the DAT, MCI, and HC groups, with the DAT and high PiB MCI subjects showing significantly higher (p < 0.001) neocortical PiB than the high PiB HC subjects, whereas no significant difference was observed between the high PiB MCI and the DAT patients (see Table 2). All 4 nonamnestic single domain and 5 of the 8 nonamnestic multiple domain MCI subjects were low PiB.
Across the entire cohort, carriers of at least 1 ApoE ε4 allele showed significantly higher PiB SUVRs (p < 0.0001) when compared to ε4 noncarriers (2.03 ± 0.5 and 1.45 ± 0.5, respectively). Compared to ApoE ε4 noncarriers, ε4 carriers in both the HC (1.63 ± 0.5 vs 1.31 ± 0.3, p = 0.001) and MCI cohorts (2.26 ± 0.5 vs 1.47 ± 0.5, p < 0.0001) had significantly higher PiB SUVR. There was no significant difference in the DAT group between ε4 carriers and noncarriers.
Test-retest PiB PET reproducibility studies performed between 7 and 60 days apart yielded an average test-retest variability of 3.5%.
In the HC and MCI groups, PiB retention increased steadily with age (slope: 0.016 SUVR/year, r = 0.30, p = 0.002 and 0.017 SUVR/year, r = 0.25, p = 0.05; respectively), but no correlation between PiB SUVR and age was found in the DAT group (Fig 1). As previously reported,19,20 in HC the correlation of neocortical SUVR with age was significantly stronger in ε4 carriers with a higher prevalence of high PiB retention at an earlier age than in noncarriers (slope: 0.027 SUVR/year vs 0.015 SUVR/year, respectively), whereas in the MCI group only ε4 carriers presented with a correlation with age (slope: 0.022 SUVR/year, r = 0.43, p = 0.006).
FIGURE 1.

Relationships between neocortical [11C]Pittsburgh compound B (PiB) standardized uptake value ratio (SUVR) and age. Open and filled circles indicate participants with low and high PiB SUVRs, respectively. There was a significant correlation between neocortical PiB SUVR and age in the healthy control (HC) and mild cognitive impairment (MCI) groups, but not in the dementia of the Alzheimer type (DAT) group. n.s. = not significant.
PiB and Cognition
Consistent with our earlier report that included many of the present subjects,14 there was an inverse correlation between episodic memory and neocortical Aβ burden in nondemented participants at baseline (r = −0.59, p <0.0001). Correlations were higher in the MCI group (r=−0.57, p < 0.0001) than in the HC group (r =−0.25, p = 0.009). Posterior cingulate PiB SUVRs showed the only significant regional correlation (r =−0.28, p = 0.0047) with episodic memory in HCs. In the MCI group, all GM areas, with the exception of the sensorimotor strip, correlated with episodic memory, with correlation coefficients ranging from −0.41 in the thalamic region to −0.54 in the frontal cortex (p < 0.001). No correlations were observed in the DAT group.
Follow-up PiB Studies
All groups showed small increases in PiB neocortical SUVR at follow-up. Mean increases of 0.013 SUVR (0.9%), 0.038 SUVR (2.1%), and 0.13 SUVR (5.7%) were observed for the HC, MCI, and DAT groups, respectively. These increases were significant only in the DAT and MCI groups (p < 0.0001 and p = 0.01, respectively). In the DAT group, 91% of subjects showed an increase ranging from 1 to 18% (median 5.8%) (Fig 2). A similar trend was observed in the partial volume corrected data. A trend toward an inverse correlation (r = −0.33, p = 0.06) between PiB SUVR increases and baseline PiB SUVR was observed in DAT patients with high PiB retention. These SUVR increases were correlated with baseline MMSE in the DAT group (r = 0.38; p = 0.04), that is, greater increase in PiB retention over 20 months was seen in the milder DAT patients than in those with more severe dementia (Supporting Information Fig). When HC and MCI were separated into high PiB and low PiB subgroups, a small (1.5% and 2.1%, respectively), albeit significant (p < .02) increase in neocortical SUVR was observed in the high PiB subgroups (Table 3). Further scans after 3 years in 24 low PiB HCs showed no significant change from baseline (mean SUVR increase of 0.03 or 2.5%), but a 6× greater increase (mean SUVR increase of 0.17 or 8.9%, p = 0.001) was observed after 3 years in the 10 HCs with high PiB at baseline (Table 4). There was no net increase between first and second follow-up in DAT patients with high PiB retention at baseline (see Table 4).
FIGURE 2.
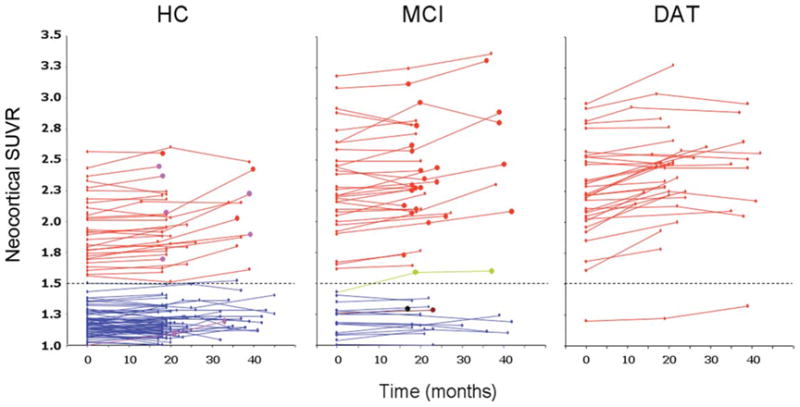
Scatterplots showing individual baseline and follow-up neocortical standardized uptake value ratio (SUVR) values in the healthy control (HC), mild cognitive impairment (MCI), and dementia of the Alzheimer type (DAT) groups. Red full circles in the HC and MCI groups indicate subjects who were reclassified as probable DAT at follow-up. Purple full circles in the HC group indicate subjects who were reclassified as MCI at follow-up. Green, brown, and black full circles in the MCI group indicate subjects who were reclassified at follow-up as probable dementia with Lewy bodies, vascular dementia, or frontotemporal dementia, respectively. Dotted line indicates the SUVR threshold of 1.5 established to separate low [11C]Pittsburgh compound B (PiB) from high PiB participants.
TABLE 3.
Changes in PiB SUVR at 20-Month Follow-up in Subjects with High PiB Retention at Baseline
| Subgroup | No. | Baseline | 1st Follow-up | ΔSUVR | Δ% | p |
|---|---|---|---|---|---|---|
| HC | 32 | 1.95±0.27 | 1.98±0.27 | 0.03 | 1.5% | 0.006 |
| MCI | 31 | 2.30±0.40 | 2.35±0.39 | 0.05 | 2.1% | 0.02 |
| DAT | 32 | 2.29±0.34 | 2.42±0.32 | 0.13 | 5.7% | <0.0001 |
PiB = [11C]Pittsburgh compound B; SUVR = standardized uptake value ratio; HC = healthy control; MCI = mild cognitive impairment; DAT = dementia of the Alzheimer type.
TABLE 4.
Changes in PiB SUVR in Subjects with High PiB Retention at Baseline Who Completed the 38-Month Follow-up
| Measure | HC | MCI | DAT |
|---|---|---|---|
| No. | 10 | 7 | 10 |
| Baseline | 1.89±0.27 | 2.56±0.46 | 2.40±0.29 |
| 20-month follow-up | 1.93±0.31 | 2.61±0.50 | 2.50±0.29 |
| 38-month follow-up | 2.06±0.28 | 2.74±0.49 | 2.50±0.29 |
| ΔSUVR20-B | 0.04 | 0.05 | 0.10 |
| Δ% | 2.1% | 1.9% | 4.2% |
| p | NS | NS | 0.03 |
| ΔSUVR38-B | 0.17 | 0.18 | 0.10 |
| Δ% | 8.9% | 7.0% | 4.2% |
| p | 0.001 | 0.0009 | 0.05 |
| ΔSUVR38-20 | 0.13 | 0.13 | 0.00 |
| Δ% | 6.7% | 5.0% | 0.0% |
| p | 0.009 | NS | NS |
PiB = [11C]Pittsburgh compound B; SUVR = standardized uptake value ratio; HC = healthy control; MCI = mild cognitive impairment; DAT = dementia of the Alzheimer type; NS = not significant.
Regional analysis considering both high and low PiB retention subjects showed no significant regional differences in any of the groups at the 20-month follow-up. Similar findings were obtained when considering only subjects with low PiB retention. On the other hand, when considering only participants with high PiB retention, significant regional increases were observed in the lateral temporal, frontal (both orbitofrontal and dorsolateral prefrontal regions), and anterior and posterior cingulate gyri of the DAT group (Supporting Information Table). No significant regional differences were observed in either HC or MCI high PiB retention participants at that stage. Scans after 3 years in 11 DAT patients showed a mean SUVR increase of 4.4% from their respective baseline, values that were the same as those observed at the 20-month follow-up in the same patients, reflecting an initial rise then a plateau in these individuals. In contrast, scans after 3 years in 34 HC and 12 MCI subjects showed a mean SUVR increase from their respective baseline of 5.0% and 5.5%, respectively, higher values than those observed at the 20-month follow-up, suggesting a continuously progressive Aβ accumulation. Whereas no significant regional differences were observed in participants with high PiB retention from either the MCI or DAT groups at that stage, significant regional increases were observed in the orbitofrontal and dorsolateral prefrontal cortices of HC subjects with high PiB retention (see Supporting Information Table).
When all clinical groups were examined together, increases in Aβ deposition at 20- and 38-month follow-up were 3× larger in carriers of at least 1 ApoE ε4 allele than in noncarriers (increments of 0.037 vs 0.012 SUVR/year at 20 months and 0.041 vs 0.016 SUVR/year at 38 months, p < 0.006, respectively). No significant differences were found at 20 months when the clinical groups were examined separately, but MCI ApoE ε4 carriers showed a significantly larger SUVR increase from baseline at 38 months. When all groups were examined together, there was a gene dose-dependent relationship between the number of ε4 alleles and PiB SUVR increases, with ApoE ε4 heterozygotes and homozygotes showing a significantly higher PiB SUVR increase (0.05 and 0.09 vs 0.02 SUVR/year, respectively, p < 0.003) at follow-up when compared to those with no ε4 allele present (Fig 3). No significant differences were observed when each clinical group was examined separately.
FIGURE 3.
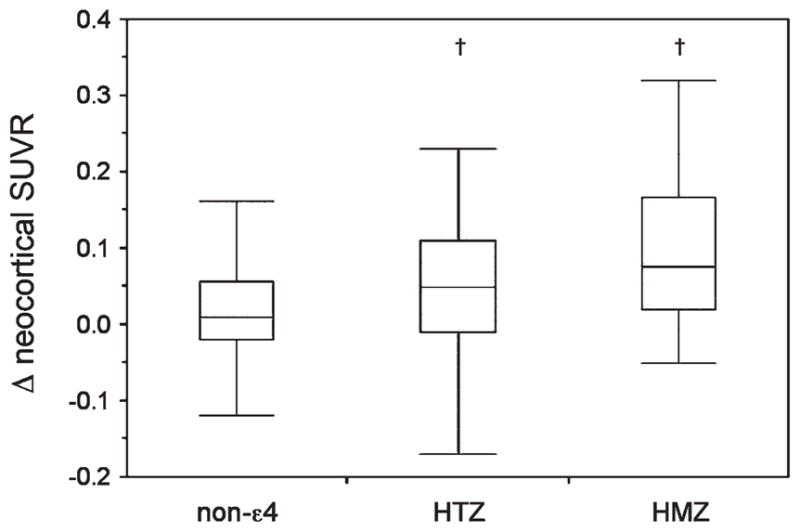
Box and whiskers plots showing the relation between the number of apolipoprotein E (ApoE) ε4 alleles and change in neocortical [11C]Pittsburgh compound B (PiB) standardized uptake value ratio (SUVR) at 20-month follow-up. ApoE ε4 heterozygotes (HTZ) and homozygotes (HMZ) had a significant gene dose-dependant increase in neocortical PiB SUVR at follow-up when compared to noncarriers in the mild cognitive impairment group, but not in health controls and dementia of the Alzheimer type. †p < 0.05.
Follow-up Cognitive Change
No significant cognitive changes were observed in the HC group. The MCI group showed significant worsening in MMSE (p = 0.0004), CDR (p = 0.0003), composite memory (P = 0.003), and nonmemory scores (p = 0.03) (see Table 2). The DAT group showed significant worsening in MMSE (p = 0.0005), CDR (p = 0.03), and nonmemory composite scores (p = 0.0009).
There was a correlation between the increase in neocortical Aβ burden and the change in MMSE when all groups were considered together (r = −0.27, p = 0.0003), but not when the groups were examined separately. Whereas there was no correlation between the increases in Aβ burden and the changes in episodic memory, there was a correlation between the increases in Aβ burden and the changes in nonmemory scores when all groups were considered together (r = −0.39, p < .0001), but only in the MCI group (r = −0.51, p = 0.001) when examined separately. No significant correlations were found in the regional analysis.
Despite the small changes observed in PiB SUVR in the MCI group, 48% had developed DAT at 20-month follow-up, and another 6% had developed other types of dementia (all diagnoses were made blinded to PiB status). The classification of 30 of the 45 high PiB MCI (67%) was changed to DAT. Whereas 2 low PiB MCI were reclassified as HC at follow-up, 5 of the 20 low PiB MCI (25%) subjects deteriorated, and their diagnosis was changed to 1 case of vascular dementia, 1 case of frontotemporal dementia, 2 cases of dementia with Lewy bodies, and 1 case of DAT. The MCI subjects who were reclassified as DAT at follow-up showed significantly lower MMSE (25.5 ± 3.2 vs 27.5 ± 2.2, respectively, p = 0.005), lower episodic memory scores (−2.9 ± 0.8 vs −1.6 ± 1.0, respectively, p < 0.0001), higher prevalence of ApoE ε4 carriers (90% vs 38%, p < 0.0001), and higher baseline Aβ burdens (2.3 ± 0.4 vs 1.7 ± 0.6, respectively, p < 0.0001) than those who did not progress to DAT, but there were no significant differences when the comparison was performed with only high PiB MCI subjects, or when PiB SUVR increases in converters to DAT were compared to nonconverters (0.06 ± 0.11 SUVR vs 0.02 ± 0.06 SUVR, equivalent to 2.4% and 1.4%, respectively, p > 0.05) (Table 5).
TABLE 5.
Conversion from HC to MCI/DAT and from MCI to DAT at 20-Month Follow-up
| Characteristic | HC Nonconverter to MCI/DAT | HC Converter to MCI/DAT | MCI Nonconverter to DAT | MCI Converter to DAT | DAT |
|---|---|---|---|---|---|
| Participants, No. | 100 | 6 | 34 | 31 | 35 |
| Age at baseline, yr | 72.9±7.4 | 75.2±8.4 | 72.8±8.9 | 74.1±8.2 | 71.7±8.9 |
| Gender, M/F | 48/52 | 1/5a | 22/12 | 14/17 | 19/16 |
| Years of education | 13.2±3.6 | 13.0±3.3 | 12.3±4.7 | 12.1±3.9 | 11.9±3.4 |
| MMSE at baseline | 29.3±0.9 | 28.2±1.2 | 27.5±2.2 | 25.5±3.2a | 22.5±3.7a |
| CDR at baseline | 0.05±0.14 | 0.33±0.26a | 0.44±0.21 | 0.50±0.13 | 0.93±0.35a |
| CDR-SOB at baseline | 0.14±0.42 | 0.40±0.22 | 1.20±1.0 | 1.89±1.1a | 4.53±2.2a |
| %ApoE ε4 | 31% | 67% | 38% | 90%b | 71%b |
| Episodic memory score | −0.11±0.8 | −1.28±0.4a | −1.63±1.0 | −2.90±0.8a | −3.31±0.6a |
| Nonmemory score | −0.01±0.7 | −0.01±0.4 | −0.91±0.9 | −1.28±1.4 | −2.33±1.5a |
| PiB SUVR | 1.4±0.4 | 2.0±0.6a | 1.7±0.6 | 2.3±0.4 | 2.3±0.4a |
| % high PIB | 28% | 83%b | 44% | 97%b | 97%b |
| PiB SUVR increase | 0.01±0.06 (0.7%) | 0.05±0.04a (2.5%) | 0.02±0.06 (1.2%) | 0.05±0.12 (2.2%) | 0.13±0.1a (5.7%) |
Significantly different from nonconverters (p < 0.05).
Significantly different from nonconverters (Fisher exact test p < 0.01).
HC = healthy control; MCI = mild cognitive impairment; DAT = dementia of the Alzheimer type; MMSE = Mini Mental State Examination; CDR = Clinical Dementia Rating; SOB = sum of boxes; ApoE = apolipoprotein E; PiB = [11C]Pittsburgh compound B; SUVR = standardized uptake value ratio.
In the HC group, 6 participants (6%) developed objective cognitive impairment at 20-month follow-up, and 5 (5%) of these had high baseline PiB. By 3 years, 8 high PiB HC subjects (25% of baseline high PiB HCs) had developed MCI or DAT, although only ⅓ of the HC cohort had reached the 3-year time point. Four met criteria for amnestic MCI and 1 for DAT by the first follow-up (16% of high PIB HCs), whereas 1 met criteria for amnestic MCI and 1 for DAT after 38 months. One subject classified as amnestic MCI on the first follow-up met criteria for DAT after 38 months. One of 73 low PiB HCs (1.4%) was classified as nonamnestic MCI approximately 20 months after the initial PiB scan. The 8 HCs who progressed to MCI or DAT over 38 months had significant lower memory scores (−1.36 ± 0.5 vs −0.09 ± 0.8, respectively, p = 0.001), higher baseline PiB SUVRs (2.0 ± 0.5 vs 1.4 ± 0.4, respectively, p < 0.05), and higher PiB SUVR increases (0.05 ± 0.04 SUVR vs 0.01 ± 0.06 SUVR, equivalent to 2.6% and 0.4%, respectively, p < 0.05) than those HCs who did not progress (see Table 5).
Discussion
Utilizing PiB PET, this study has demonstrated that Aβ burden does increase at a slow rate over time. The rate is greater in nondemented persons with amyloid already present at baseline (high PiB) than in those without, and Aβ deposition clearly continues in mild to moderate DAT patients. These increases in Aβ deposition in AD are in agreement with 2 recent reports,33,34 and challenge the widespread belief that Aβ burden reaches a plateau at a much earlier stage of the disease.23 Ninety-one percent of DAT patients showed an increase in PiB SUVR, ranging from 1 to 18% over 2 years (average increase of 0.08 SUVR or 3.4% per year). The fact that SUVR increases were positively correlated with baseline MMSE in the DAT group (see Supporting Information Fig) suggests that Aβ deposition might slow down with disease progression in the later stages of DAT. Our preliminary results from 3-year follow-up point to the same conclusion. In nondemented participants, PiB retention increased on average by 1 to 2% per year, but there was marked individual variation that in many cases exceeded the range of test-retest variability for PiB PET (see Fig 2). We obtained an average of 3.5% for test-retest variability, whereas others have reported somewhat higher values.22,35 The individual variability observed here and in previous reports might explain the inconsistent results from prior brain biopsy studies, all of which had <6 subjects.6–8 Our findings are somewhat at odds with a 2-year follow-up study in 16 DAT subjects in which participants showed stable or even decreased PiB retention.22 Further review of that data showed that 60% of the subjects actually had a small increase in PiB retention.36 In other recently reported studies, significant increases in PiB retention were found in individuals but not on group analysis.21,23,24 The larger sample size of our study is the most likely reason that we have found significant group increases in PiB. Not surprisingly, the significant increases were in high PiB groups and DAT, with lesser, nonsignificant increases in the low PiB groups.
The longitudinal aspects of this study help elucidate the relationship between Aβ burden and cognitive trajectory in healthy individuals and MCI subjects. That is, those who had high PiB retention were much more likely to progress from normal to impaired cognition or from MCI to AD. Aβ deposition appears to be an age-dependent process, particularly at the early stages of the disease course (normal cognition or MCI). Therefore, the cross-sectional aspect of the study allows comparison of age-matched HC with MCI subjects and with AD patients who present with either early onset or late onset of the disease.
Our data also show, in agreement with previous studies, that Aβ deposition is strongly associated with ApoE status, particularly in nondemented individuals.18–20 There is a dose-dependent association between increases in Aβ deposition and number of ε4 alleles when the groups are examined together but not when the groups are examined separately, and although both ε4 homozygotes and heterozygotes had higher increases in Aβ deposition than ε4 noncarriers in DAT, the difference was not significant. These findings suggest that the number of ε4 alleles does influence Aβ deposition in the prodromal DAT period, but not once DAT is established. This is to some extent at odds with a recent study of 24 DAT patients, where a significant ApoE dose-dependent increase in Aβ burden was reported.34 In our study, there were no significant differences in baseline MMSE, CDR, or PiB SUVR in the DAT group between ε4 homozygotes, heterozygotes, and noncarriers, but the baseline PiB SUVR values were much higher than those reported by Grimmer and colleagues (2.3 vs 1.7, respectively).34 Although only a trend, a higher increase in Aβ deposition was observed in those DAT patients with a lower baseline PiB SUVR, which added to the fact that there were no significant differences in PiB SUVRs between ε4 carriers and noncarriers in DAT subjects, might explain the different results.
This study found a higher rate of conversion (29%/year) from MCI to DAT than the usually reported 8 to 16%/year.37–39 The likely explanation is that MCI participants recruited from a tertiary referral memory disorders clinic are more likely to progress than subjects detected through community screening. In addition, our MCI cohort was also older (mean age, 73.4 years) than in many studies, and had a higher percentage (90%) of ApoE ε4 carriers. Thus, they likely represent what has been termed late MCI.40 Other features of our MCI participants indicate that most fell toward the severe end of the MCI spectrum, with episodic memory impairment and baseline PiB retention equivalent to the DAT group. Indeed, the only features—besides informant report of functional capabilities—that separated our MCI from DAT were the better performance on MMSE, CDR, and nonmemory cognitive tests (see Table 2). Aggregating the results from 3 recently reported smaller PiB follow-up studies reveal figures very similar to those reported here, with 26 of 41 MCI subjects with high PiB progressing to DAT.24,41,42 The fact that 67% of MCI subjects with high PiB retention progressed to DAT over 2 years, compared to 5% of those MCI subjects with low PiB retention, suggests that MCI subjects with high Aβ deposition in the brain are 13× more likely to progress to DAT than those with low Aβ deposition.
As previously reported,14 there was a correlation between PiB retention and memory impairment in the MCI group, but this has not been consistently reported by other PiB studies assessing amnestic MCI. This discrepancy may be due to the fact that 12 of 65 MCI subjects had nonamnestic MCI. Nonamnestic MCI subjects are more likely to have low PiB retention and therefore drive a correlation between memory scores and PiB retention within the MCI group. Some measures of progressive cognitive decline such as MMSE and nonmemory scores correlated weakly with the increase in Aβ burden as measured by PiB. Technical factors could mask a stronger correlation such as the introduction of medication for symptomatic treatment of DAT. However, only 3% of HC, 11% of MCI, and 3% of DAT subjects commenced acetyl cholinesterase inhibitors or memantine between the baseline and follow-up cognitive assessments. Given their relatively weak effects, particularly on episodic memory tasks, it is unlikely that this has influenced our findings. Worsening partial volume effect from progressive brain atrophy could also mask an increase in PiB retention over time, but we found that correction of PiB images for partial volume effect with a 3 compartment MRI model did not significantly alter the percentage difference in PiB measures over a 20-month period. For longer follow-up, this may be more important. We also found no evidence of Aβ deposition in the cerebellar cortex that would either mask an increase or show a reduction in SUVR at follow-up, with no differences in cerebellar cortex PiB SUVs between baseline and follow-up within our study groups. Finally, the fact that the annual rate of increase in Aβ deposition is similar to the test-retest variability of PiB measurements along with the potentially high test-retest variability of cognitive assessments also could pose difficulties for establishing a correlation between increase in amyloid and reduction in cognition. However, in numerous cases, definite progression of cognitive decline occurred with no increase or even a decrease in PiB retention (see Fig 2). Therefore, the more likely reason for finding only a weak correlation between change in PiB retention and change in cognition is that by the time cognitive decline manifests, Aβ has already triggered downstream mechanisms that play a more direct role in driving cognitive decline.9 Such mechanisms may include formation of neurofibrillary tangles, neuroinflammatory processes, and oxidative stress driven by Aβ oligomers, leading to progressive synaptic failure and neuronal death.1
Our data have several implications for therapeutic trials. The slow rate of Aβ deposition indicates that the time window for altering amyloid accumulation prior to DAT may be very wide. It also supports the growing consensus that antiamyloid therapy may need to be given early in the course of the disease, perhaps even before symptoms appear, to be effective, and that downstream mechanisms may also need to be addressed to successfully prevent the development of DAT.
This study also has shown that Aβ deposition precedes the development of objective cognitive impairment in at least some healthy elderly individuals, and that imaging Aβ may be useful to stratify the risk of objective cognitive decline over the following 2 years. Based on our results, there is a >98% (95% confidence interval, 90–100%) chance that an asymptomatic elderly individual with low PiB retention will remain cognitively stable over 20 months, in contrast to the 16% risk of developing MCI or DAT in those with high PiB retention and a 25% risk by 3 years. It is likely that our healthy control population is biased toward the early development of DAT. Respondents to advertising may be concerned about subtle subjective cognitive decline or have a family history of DAT. Therefore, although these risks may not equate to those of the general population, they are relevant for those persons most likely to present to a medical practitioner requesting investigation for very early DAT.
In conclusion, Aβ deposition increases slowly and continuously from cognitive normality to moderately severe DAT. A significant PiB SUVR increase at 20-month follow-up was observed in DAT and MCI subjects, and significant PiB SUVR increases were also observed in the subgroup of HC and MCI subjects who presented with high PiB at baseline. Aβ deposition was associated with ApoE genotype, with homozygote ε4 carriers presenting with higher PIB SUVR and higher PiB SUVR increases at follow-up. Extensive Aβ deposition precedes cognitive impairment and is associated with a higher risk of cognitive decline and progression from MCI to DAT over 1 to 2 years, denoting the nonbenign nature of Aβ deposition. However, cognitive decline is not closely related to change in Aβ burden, suggesting that downstream factors have a more direct effect on symptom progression.
Acknowledgments
The study was partially supported by the Commonwealth Scientific Industrial Research Organization Preventative Health Flagship Program through the Australian Imaging, Biomarkers, and Lifestyle flagship study of aging, the Austin Hospital Medical Research Foundation, Neurosciences Victoria, and the University of Melbourne. The funding sources had no input into the design of this study, the analysis of data, or writing of the manuscript.
We thank Dr M. Woodward, Dr J. Merory, Dr P. Drysdale, Dr G. Chan, Dr K. Young, Dr S. Gong, Dr G. Savage, Dr P. Maruff, Dr D. Darby, Dr A. Bahar-Fuchs, T. Cowie, F. Lamb, J. Robertson, T. Petts, T. Saunder, J. Sagona, and J. Bradley, the Brain Research Institute and the AIBL Study Group (http://www.aibl.csiro.au/) for their assistance with this study.
Footnotes
D.A. is Principle Investigator of the Australian Imaging, Biomarkers, and Lifestyle study of ageing.
Additional Supporting Information can be found in the online version of this article.
Potential Conflicts of Interest
GE Healthcare holds a license agreement with the University of Pittsburgh based on the technology described in this article. W.E.K. and C.A.M. have received consultancy fees and royalties and have a grant pending from GE Healthcare. W.E.K. and C.A.M. are coinventors of PiB and, as such, have a financial interest in this license agreement. GE Healthcare provided no grant support for this study and had no role in the design or interpretation of results or preparation of the manuscript. All other authors have no conflicts of interest with this work, had full access to all of the data in the study, and take responsibility for the integrity of the data and the accuracy of the data analysis.
References
- 1.Masters CL, Cappai R, Barnham KJ, Villemagne VL. Molecular mechanisms for Alzheimer’s disease: implications for neuroimaging and therapeutics. J Neurochem. 2006;97:1700–1725. doi: 10.1111/j.1471-4159.2006.03989.x. [DOI] [PubMed] [Google Scholar]
- 2.Price JL, Morris JC. Tangles and plaques in nondemented aging and “preclinical” Alzheimer’s disease. Ann Neurol. 1999;45:358–368. doi: 10.1002/1531-8249(199903)45:3<358::aid-ana12>3.0.co;2-x. [DOI] [PubMed] [Google Scholar]
- 3.Naslund J, Haroutunian V, Mohs R, et al. Correlation between elevated levels of amyloid beta-peptide in the brain and cognitive decline. JAMA. 2000;283:1571–1577. doi: 10.1001/jama.283.12.1571. [DOI] [PubMed] [Google Scholar]
- 4.Parvathy S, Davies P, Haroutunian V, et al. Correlation between Abetax-40-, Abetax-42-, and Abetax-43-containing amyloid plaques and cognitive decline. Arch Neurol. 2001;58:2025–2032. doi: 10.1001/archneur.58.12.2025. [DOI] [PubMed] [Google Scholar]
- 5.Prohovnik I, Perl DP, Davis KL, et al. Dissociation of neuropathology from severity of dementia in late-onset Alzheimer disease. Neurology. 2006;66:49–55. doi: 10.1212/01.wnl.0000191298.68045.50. [DOI] [PubMed] [Google Scholar]
- 6.Mann DM, Marcyniuk B, Yates PO, et al. The progression of the pathological changes of Alzheimer’s disease in frontal and temporal neocortex examined both at biopsy and at autopsy. Neuropathol Appl Neurobiol. 1988;14:177–195. doi: 10.1111/j.1365-2990.1988.tb00880.x. [DOI] [PubMed] [Google Scholar]
- 7.Bennett DA, Cochran EJ, Saper CB, et al. Pathological changes in frontal cortex from biopsy to autopsy in Alzheimer’s disease. Neurobiol Aging. 1993;14:589–596. doi: 10.1016/0197-4580(93)90043-b. [DOI] [PubMed] [Google Scholar]
- 8.Di Patre PL, Read SL, Cummings JL, et al. Progression of clinical deterioration and pathological changes in patients with Alzheimer disease evaluated at biopsy and autopsy. Arch Neurol. 1999;56:1254–1261. doi: 10.1001/archneur.56.10.1254. [DOI] [PubMed] [Google Scholar]
- 9.Guillozet AL, Weintraub S, Mash DC, Mesulam MM. Neurofibrillary tangles, amyloid, and memory in aging and mild cognitive impairment. Arch Neurol. 2003;60:729–736. doi: 10.1001/archneur.60.5.729. [DOI] [PubMed] [Google Scholar]
- 10.Rowe CC, Ng S, Ackermann U, et al. Imaging beta-amyloid burden in aging and dementia. Neurology. 2007;68:1718–1725. doi: 10.1212/01.wnl.0000261919.22630.ea. [DOI] [PubMed] [Google Scholar]
- 11.Klunk WE, Engler H, Nordberg A, et al. Imaging brain amyloid in Alzheimer’s disease with Pittsburgh compound-B. Ann Neurol. 2004;55:306–319. doi: 10.1002/ana.20009. [DOI] [PubMed] [Google Scholar]
- 12.Mintun MA, Larossa GN, Sheline YI, et al. [11C] PIB in a nondemented population: potential antecedent marker of Alzheimer disease. Neurology. 2006;67:446–452. doi: 10.1212/01.wnl.0000228230.26044.a4. [DOI] [PubMed] [Google Scholar]
- 13.Aizenstein HJ, Nebes RD, Saxton JA, et al. Frequent amyloid deposition without significant cognitive impairment among the elderly. Arch Neurol. 2008;65:1509–1517. doi: 10.1001/archneur.65.11.1509. [DOI] [PMC free article] [PubMed] [Google Scholar]
- 14.Pike KE, Savage G, Villemagne VL, et al. Beta-amyloid imaging and memory in non-demented individuals: evidence for preclinical Alzheimer’s disease. Brain. 2007;130:2837–2844. doi: 10.1093/brain/awm238. [DOI] [PubMed] [Google Scholar]
- 15.Martins IJ, Hone E, Foster JK, et al. Apolipoprotein E, cholesterol metabolism, diabetes, and the convergence of risk factors for Alzheimer’s disease and cardiovascular disease. Mol Psychiatry. 2006;11:721–736. doi: 10.1038/sj.mp.4001854. [DOI] [PubMed] [Google Scholar]
- 16.Ritchie K, Dupuy AM. The current status of apo E4 as a risk factor for Alzheimer’s disease: an epidemiological perspective. Int J Geriatr Psychiatry. 1999;14:695–700. doi: 10.1002/(sici)1099-1166(199909)14:9<695::aid-gps19>3.0.co;2-r. [DOI] [PubMed] [Google Scholar]
- 17.Villemagne VL, Fodero-Tavoletti MT, Pike KE, et al. The ART of loss: Abeta imaging in the evaluation of Alzheimer’s disease and other dementias. Mol Neurobiol. 2008;38:1–15. doi: 10.1007/s12035-008-8019-y. [DOI] [PubMed] [Google Scholar]
- 18.Reiman EM, Chen K, Liu X, et al. Fibrillar amyloid-beta burden in cognitively normal people at 3 levels of genetic risk for Alzheimer’s disease. Proc Natl Acad Sci U S A. 2009;106:6820–6825. doi: 10.1073/pnas.0900345106. [DOI] [PMC free article] [PubMed] [Google Scholar]
- 19.Rowe CC, Ellis KA, Rimajova M, et al. Amyloid imaging results from the Australian Imaging, Biomarkers and Lifestyle (AIBL) study of aging. Neurobiol Aging. 2010;31:1275–1283. doi: 10.1016/j.neurobiolaging.2010.04.007. [DOI] [PubMed] [Google Scholar]
- 20.Morris JC, Roe CM, Xiong C, et al. APOE predicts amyloid-beta but not tau Alzheimer pathology in cognitively normal aging. Ann Neurol. 2010;67:122–131. doi: 10.1002/ana.21843. [DOI] [PMC free article] [PubMed] [Google Scholar]
- 21.Scheinin NM, Aalto S, Koikkalainen J, et al. Follow-up of [11C] PIB uptake and brain volume in patients with Alzheimer disease and controls. Neurology. 2009;73:1186–1192. doi: 10.1212/WNL.0b013e3181bacf1b. [DOI] [PubMed] [Google Scholar]
- 22.Engler H, Forsberg A, Almkvist O, et al. Two-year follow-up of amyloid deposition in patients with Alzheimer’s disease. Brain. 2006;129:2856–2866. doi: 10.1093/brain/awl178. [DOI] [PubMed] [Google Scholar]
- 23.Jack CR, Jr, Lowe VJ, Weigand SD, et al. Serial PIB and MRI in normal, mild cognitive impairment and Alzheimer’s disease: implications for sequence of pathological events in Alzheimer’s disease. Brain. 2009;132:1355–1365. doi: 10.1093/brain/awp062. [DOI] [PMC free article] [PubMed] [Google Scholar]
- 24.Okello A, Koivunen J, Edison P, et al. Conversion of amyloid positive and negative MCI to AD over 3 years: an 11C-PIB PET study. Neurology. 2009;73:754–760. doi: 10.1212/WNL.0b013e3181b23564. [DOI] [PMC free article] [PubMed] [Google Scholar]
- 25.Ellis KA, Bush AI, Darby D, et al. The Australian Imaging, Biomarkers and Lifestyle (AIBL) study of aging: methodology and baseline characteristics of 1112 individuals recruited for a longitudinal study of Alzheimer’s disease. Int Psychogeriatr. 2009;21:672–687. doi: 10.1017/S1041610209009405. [DOI] [PubMed] [Google Scholar]
- 26.McKhann G, Drachman D, Folstein M, et al. Clinical diagnosis of Alzheimer’s disease: report of the NINCDS-ADRDA Work Group under the auspices of Department of Health and Human Services Task Force on Alzheimer’s Disease. Neurology. 1984;34:939–944. doi: 10.1212/wnl.34.7.939. [DOI] [PubMed] [Google Scholar]
- 27.Petersen RC, Smith GE, Waring SC, et al. Mild cognitive impairment: clinical characterization and outcome. Arch Neurol. 1999;56:303–308. doi: 10.1001/archneur.56.3.303. [DOI] [PubMed] [Google Scholar]
- 28.Ourselin S, Roche A, Subsol G, et al. Reconstructing a 3D structure from serial histological sections. Image Vision Computing. 2001;19:25–31. [Google Scholar]
- 29.Collins DL, Zijdenbos AP, Kollokian V, et al. Design and construction of a realistic digital brain phantom. IEEE Trans Med Imaging. 1998;17:463–468. doi: 10.1109/42.712135. [DOI] [PubMed] [Google Scholar]
- 30.Tzourio-Mazoyer N, Landeau B, Papathanassiou D, et al. Automated anatomical labeling of activations in SPM using a macroscopic anatomical parcellation of the MNI MRI single-subject brain. Neuroimage. 2002;15:273–289. doi: 10.1006/nimg.2001.0978. [DOI] [PubMed] [Google Scholar]
- 31.Bourgeat P, Chetelat G, Villemagne VL, et al. Beta-amyloid burden in the temporal neocortex is related to hippocampal atrophy in elderly subjects without dementia. Neurology. 2010;74:121–127. doi: 10.1212/WNL.0b013e3181c918b5. [DOI] [PubMed] [Google Scholar]
- 32.Jack CR, Jr, Lowe VJ, Senjem ML, et al. 11C PiB and structural MRI provide complementary information in imaging of Alzheimer’s disease and amnestic mild cognitive impairment. Brain. 2008;131:665–680. doi: 10.1093/brain/awm336. [DOI] [PMC free article] [PubMed] [Google Scholar]
- 33.Rinne JO, Brooks DJ, Rossor MN, et al. 11C-PiB PET assessment of change in fibrillar amyloid-beta load in patients with Alzheimer’s disease treated with bapineuzumab: a phase 2, double-blind, placebo-controlled, ascending-dose study. Lancet Neurol. 2010;9:363–372. doi: 10.1016/S1474-4422(10)70043-0. [DOI] [PubMed] [Google Scholar]
- 34.Grimmer T, Tholen S, Yousefi BH, et al. Progression of cerebral amyloid load is associated with the apolipoprotein E epsilon4 genotype in Alzheimer’s disease. Biol Psychiatry. doi: 10.1016/j.biopsych.2010.05.013. [DOI] [PMC free article] [PubMed] [Google Scholar]
- 35.Lopresti BJ, Klunk WE, Mathis CA, et al. Simplified quantification of Pittsburgh compound B amyloid imaging PET studies: a comparative analysis. J Nucl Med. 2005;46:1959–1972. [PubMed] [Google Scholar]
- 36.Klunk WE, Mathis CA, Price JC, et al. Two-year follow-up of amyloid deposition in patients with Alzheimer’s disease. Brain. 2006;129:2805–2807. doi: 10.1093/brain/awl281. [DOI] [PubMed] [Google Scholar]
- 37.Petersen RC, Thomas RG, Grundman M, et al. Vitamin E and donepezil for the treatment of mild cognitive impairment. N Engl J Med. 2005;352:2379–2388. doi: 10.1056/NEJMoa050151. [DOI] [PubMed] [Google Scholar]
- 38.Mitchell AJ, Shiri-Feshki M. Rate of progression of mild cognitive impairment to dementia—meta-analysis of 41 robust inception cohort studies. Acta Psychiatr Scand. 2009;119:252–265. doi: 10.1111/j.1600-0447.2008.01326.x. [DOI] [PubMed] [Google Scholar]
- 39.Busse A, Hensel A, Guhne U, et al. Mild cognitive impairment: long-term course of four clinical subtypes. Neurology. 2006;67:2176–2185. doi: 10.1212/01.wnl.0000249117.23318.e1. [DOI] [PubMed] [Google Scholar]
- 40.Aisen PS, Petersen RC, Donohue MC, et al. Clinical Core of the Alzheimer’s Disease Neuroimaging Initiative: progress and plans. Alzheimers Dement. 2010;6:239–246. doi: 10.1016/j.jalz.2010.03.006. [DOI] [PMC free article] [PubMed] [Google Scholar]
- 41.Wolk DA, Price JC, Saxton JA, et al. Amyloid imaging in mild cognitive impairment subtypes. Ann Neurol. 2009;65:557–568. doi: 10.1002/ana.21598. [DOI] [PMC free article] [PubMed] [Google Scholar]
- 42.Forsberg A, Engler H, Almkvist O, et al. PET imaging of amyloid deposition in patients with mild cognitive impairment. Neurobiol Aging. 2008;29:1456–1465. doi: 10.1016/j.neurobiolaging.2007.03.029. [DOI] [PubMed] [Google Scholar]