Abstract
Membrane proteins are made soluble in aqueous buffers by the addition of various surfactants (detergents) to form so-called protein-detergent complexes (PDCs). Properties of membrane proteins are commonly assessed by unfolding the protein in the presence of surfactant in a buffer solution by adding urea. The stability of the protein under these conditions is then monitored by biophysical methods such as fluorescence or circular dichroism spectroscopy. Often overlooked in these experiments is the effect of urea on the phase behavior and micellar microstructure of the different surfactants used to form the PDCs. Here the effect of urea on five polyoxyethylene surfactants – n-octylytetraoxyethylene (C8E4), n-octylpentaoxyethylene (C8E5), n-decylhexaoxyethylene (C10E6), n-dodecylhexaoxyethylene (C12E6) and n-dodecyloctaoxylethylene (C12E8) – is explored. The presence of urea increases the critical micelle concentration (CMC) of all surfactants studied, indicating that the concentration of both the surfactant and urea should be considered in membrane protein folding studies. The cloud point temperature of all surfactants studied also increases with increasing urea concentration. Small-angle neutron scattering shows a urea-induced transition from an elongated to a globular shape for micelles of C8E4 and C12E6. In contrast, C8E5 and C12E8 form more globular micelles at room temperature and the micelles remain globular as the urea concentration is increased. The effects of increasing urea concentration on micelle structure are analogous to those of decreasing the temperature. The large changes in micelle structure observed here could also affect membrane protein unfolding studies by changing the structure of the PDC.
Introduction
The effects of urea on the aqueous solubility of polar and nonpolar molecules have been studied extensively because urea addition is a convenient way to modulate intermolecular interactions. Many explanations have been suggested for the enhanced solubility of both polar and nonpolar solutes in urea solutions, including direct urea-solute interactions1–3, alteration of solute hydration layers4,5, alteration of the bulk structure of water6–8, or combinations of these ideas. Nonpolar molecules such as aliphatic and aromatic hydrocarbons have a much lower free energy of transfer to aqueous solutions of urea than to pure water, with solubility increasing with temperature for larger molecules 8. Experiments show that cosolutes with larger molecular volumes than water, such as urea, interact directly with the nonpolar molecules and improve their solubility1,9. Molecular dynamics simulations suggest that the hydrogen bonding of water to itself and to urea in the vicinity of the nonpolar surface is stronger than when urea is not present10. Therefore, this direct binding mechanism suggests that urea significantly affects the hydrogen bonding structure in the interface of nonpolar regions, leading to improved solvation of hydrocarbons. Urea is therefore thought to weaken hydrophobic interactions9 by facilitating cavity formation in aqueous solutions, thereby better accommodating hydrocarbons. As a highly polar molecule, urea also interacts favorably with other polar solutes, by specific hydrogen bonding and by altering surface hydration, although this effect is weakened with increasing temperature1.
Both the head and tail groups of amphiphilic molecules are affected by urea. Ionic11–15 and nonionic3,4,11 surfactant monomers are more soluble in aqueous urea solutions than in water, so the critical micelle concentration (CMC) increases with increasing urea concentration. The dominant effect is an increase in the solubility of the alkyl chain4,12 followed by an increase in the solvation of the headgroups2. Above the CMC, adding urea often decreases the micelle size and aggregation number of many ionic2,16 and nonionic 4 surfactants and drives a change in micellar shape from elongated to globular. In this case the urea interacts with the polar head groups on the surface of micelles and changes their hydration layer. As a result, the surface area of head groups increases, causing stronger steric repulsion between groups and large changes in overall micelle shape 4,16.
Nonionics such as poly(oxyethylene) surfactants exhibit a lower consolute boundary at higher temperatures 17,18, which is often parameterized by the lowest temperature at which this phase separation occurs, the cloud point temperature (CPT). Scattering measurements of nonionic surfactants as a function of temperature near the CPT show an increase in the apparent molecular weight of the micelles, which has been interpreted as an increase in micelle size and asymmetry 19–21 or as an effect of increasing attractive interactions between small micelles18,22,23. More recent interpretations of clouding have included both effects 24. Interactions of the hydration shells of ethylene oxide head groups of distinct micelles as a function of temperature determine the clouding phenomenon, along with van der Waals forces between micelle cores20. Increasing temperature leads to decreased repulsion between ethylene oxide head groups, reducing the head group surface area and resulting in micelle elongation and/or attractive interactions between micelles. These large entropically and enthalpically driven head group interactions that control clouding are delicately balanced, and therefore are sensitive to changes in solution conditions 20.
Urea is known to increase the cloud point temperature of nonionic surfactants 3,4,25. A thicker hydration layer due to the urea around the micelle head groups leads to stronger steric repulsion between micelles. In addition, urea increases the dielectric constant of the solution around the hydrated polar groups, resulting in stronger attractive van der Waals interactions between micelles at a fixed temperature. As the temperature is increased, the presence of urea hinders the dehydration of polar head groups, resulting in higher cloud point temperatures3,4.
Proteins, like surfactants, contain both polar and nonpolar groups, and because the polar and nonpolar residues are better solvated in aqueous urea than in water,25 adding urea can lead to protein denaturation. Urea unfolding curves for proteins are routinely measured to determine the folding free energy. An interesting case where urea simultaneously affects the molecular conformation of both surfactants and proteins occurs in the unfolding of membrane proteins. Membrane proteins are characterized by their specialized hydrophobic surface area that interacts with the lipid bilayer in the native cellular environment26. Surfactants are commonly used to extract proteins embedded in the membrane27 or to refold them28, and to keep membrane proteins soluble in aqueous solutions. The empirical evidence is that a surfactant concentration in excess of the CMC is needed to maintain membrane proteins folded in solution28. Urea unfolding curves of membrane proteins are usually measured at a constant surfactant concentration29, and such studies do not address the effect of urea on the surfactant phase behavior. When a concentration path in an unfolding experiment also crosses the CMC, or another condition where micellar structure changes, complications in interpretation can arise.
Here, common experimental conditions for unfolding membrane proteins in urea are studied in order to elucidate their effects on surfactant solutions. The focus is on the family of poly(oxyethylene) surfactants (CiEjs), since they are commonly used in membrane protein studies30–32. Specifically, experiments are reported on n-octylytetraoxyethylene (C8E4), n-octylpentaoxyethylene (C8E5), n-decylhexaoxyethylene (C10E6), n-dodecylhexaoxyethylene (C12E6) and n-dodecyloctaoxylethylene (C12E8). The measurements reported include those of CMC and CPT values. Direct measurement of micelle structure is provided by small-angle neutron scattering.
Materials and Methods
Polyoxyethylene surfactants (C8E4, C8E5, C10E6, C12E6, C12E8) were purchased from Nikko (Tokyo, Japan) and were used without further purification. Deuterium oxide and deuterated urea were purchased from Cambridge Isotopes (Andover, MA) and were also used without further purification. Boric acid was purchased from Fisher Scientific.
Isothermal titration calorimetry (ITC) sample preparation
A VP microcalorimeter (MicroCal LLC, Northampton, MA) was used for all ITC measurements. A buffer solution containing 10 mM boric acid at pH 10 was prepared along with an 8 M urea solution using the same buffer and pH, and filtered using Millipore 0.22 µm filters. All urea solutions were freshly prepared before use. Solutions with intermediate urea concentrations of 2, 4 and 6 M were prepared by mixing the above stock solutions. Concentrated surfactant solutions (1–5 wt %) at each urea concentration were prepared and titrated into surfactant-free solutions in the calorimeter reservoir through 4 injections of 20 µL each, followed by 40 injections of 4 µL each. The excess enthalpy was measured from the temperature difference between the reservoir and a water bath kept at 25 °C. The software package MicroCal LLC ITC was used to integrate the excess heat to obtain the total energy change per injection. This generates a sigmoidal curve of surfactant concentration versus total energy change per injection, and the CMC is taken as the midpoint of this curve.
Lower consolute boundary determination
Surfactant solutions at initial concentrations of about 25 wt % were prepared at each urea concentration studied and allowed to equilibrate for at least one hour. Solutions were placed in a water tank of which the temperature was controlled to ±0.5 °C using a Julabo Model MB water bath. The lower consolute boundary was determined by visual inspection of the turbidity of the sample as it was heated from room temperature to the onset of cloudiness. The surfactant solution was then diluted while a fixed urea concentration was maintained and the experiment repeated. The cloud point temperature was taken as the lowest temperature at which the surfactant phase-separated, with an error of ±0.5 °C.
Small-angle neutron scattering
In SANS experiments, the orientation-averaged intensities of neutrons scattered by particles in solution are measured as a function of the magnitude of the scattering vector, , where θ is the angle between the scattered and incident beams and λ is the wavelength of the radiation33,34. When a sample contains discrete particles or micelles, both intra- and interparticle scattering contribute to the measured small angle scattering spectra. Intraparticle scattering, represented by the particle form factor, can be calculated from the particle geometry and depends on particle shape, atomic composition and distribution. Interparticle scattering depends on spatial correlations and orientations of the particles35. For monodisperse spherical scatterers, the scattering intensity is directly proportional to particle number density n, the form factor, P(q), and the structure factor, S(q), i.e.,36
| (1) |
All deuterated urea solutions were freshly made before use, with D2O as the solvent. The acidity of buffer solutions in D2O (pD) was measured with a glass electrode and corrected by adding 0.4 units to take into account the difference in the pH meter reading between H2O and D2O solutions33. The pD was adjusted to 9.6 using NaOH, and the solutions were filtered through Millipore 0.22 µm filters. Surfactant solutions were prepared by weighing the amount of surfactant needed and diluting it into either a deuterated buffer solution or 8 M deuterated urea solution. Intermediate urea concentrations of 2, 4 and 6 M were prepared by mixing the initial stock solutions. All samples were allowed to equilibrate for at least 12 hours.
Measurements were made using the NG-3 spectrometer at the Center for High Resolution Neutron Scattering at the National Institute of Standards and Technology (NIST), Gaithersburg, MD. SANS data were collected at three sample–detector distances: 1.3 m, 4.5 m (with detector offsets of 25 cm) and 13.2 m, with a detector offset of 10 cm. The q-range covered was 0.002– 0.3 Å−1 . The incoherent background was calculated according to Porod’s law for values of q larger than 0.25 Å−1, and was subtracted from the scattering data before analysis. Quartz cuvettes with a path length of 2 mm were used, and the average wavelength of the radiation was 6 Å, with a spread in wavelength, , of 15%. All experiments were done at 25±0.5 °C. At least 106 detector counts were collected at each detector distance per sample to ensure good statistics. The data were corrected for detector efficiency, background radiation, empty cell scattering, and incoherent scattering to calculate the scattered intensity on an absolute scale. These procedures were performed using a computer program provided by NIST based on Igor Pro software (Wavemetrics, Lake Owego, Oregon)37.
For dilute, non-interacting systems, S(q) is unity, so that the shape of the scattered intensity depends only on the form factor. SANS data were analyzed by using the indirect Fourier transform (IFT) of the scattering intensity to determine the pair distance distribution function, p(r), which is calculated from the Fourier transform of the scattering curve, , and gives the distribution of dimensions that fit within the scattering particle. The shape of p(r) provides information on the morphology of the scattering particles: globular particles have p(r) functions resembling Gaussian distributions while elongated particles show a p(r) with an extended shoulder38. The maximum dimension of the particle occurs at the r value where p(r)=0.39 The analysis was performed using indirect Fourier transform (IFT) and generalized indirect Fourier transform (GIFT) packages38,40,41, both of which calculate the final solution by minimizing both the mean deviation between the experimental and approximated scattering curves, and possible oscillations that occur around the true value of p(r) due to experimental uncertainties and truncation of the experimental scattering curves at low and high q. The IFT routine requires no explicit assumptions about the particle form factor to estimate the maximum particle dimension, and therefore gives an unbiased first estimate of particle shape38. Nonetheless, the IFT routine does not account for interparticle interactions that may affect the scattering measurement41; GIFT attempts to account for these interactions using various model interaction potentials.
The first step in data analysis used only IFT. The fit was evaluated based on the deviations and residuals of the calculated and experimental scattering curves and on the chosen fit that minimized unphysical oscillations of p(r)38. This initial estimate was optimized by varying the maximum particle dimension. If the resulting p(r) required further optimization because oscillations could not be removed, a structure factor model was implemented in the analysis by GIFT.
The validity of the calculated p(r) depends on how well the structure factor model represents interparticle interactions. The simplest interaction potential commonly used for uncharged colloids is the hard sphere potential, which accounts only for the excluded volume of impenetrable particles36. Using the hard sphere structure factor, GIFT was able to eliminate oscillations in many p(r) functions.
Direct fitting of scattering curves was achieved using a model for monodisperse rigid cylinders for smeared scattering profiles; this fitting was performed using a macro for the software package Igor Pro 5.03, written by S. R. Kline and provided by the NCNR. The model includes as parameters the particle volume fraction, diameter and length, along with the difference between the scattering length densities of the surfactant molecules and the solvent, and the incoherent scattering background. The particle volume fraction and the scattering contrast are directly correlated, so the contrast was held at a fixed value assuming no exchangeable hydrogens and accounting for the changes in urea concentration. Volume fractions were fitted for scattering curves at 0 and 8 M urea and calculated for the intermediate concentrations, as these two limiting solutions were mixed to generate the intermediate experimental samples. The incoherent scattering background was held fixed as well. The cylinder radius and length were also fitted parameters.
Aggregation numbers were calculated from the ratio of the cylinder surface area to the head group surface area. Head group surface areas at 0 M urea for E4 (35.6 Å2) and E5 (34.5 Å2) surfactants were calculated by dividing the head group area by its length, which was calculated based on a meander conformation as described by Zulauf et al. 42. The head group surface area for E6 (48 Å2) and E8 (38 Å2) surfactants were taken from Briganti et al. 4. As the urea concentration is increased, an increase in the head group surface area is expected if urea molecules partition within the hydration layer of the head group. To account for this, Briganti et al.4 suggest an empirical scaling rule, calculated for C12E6 molecules (ahurea = ah0 + 0.8[urea]), where ah0 is the head group surface area in the absence of urea. The same scaling rule was adopted here, under the assumption that it applies for all surfactants studied, to calculate aggregation numbers with increasing urea concentrations. The reduced temperature is given by , where Tc is the cloud point temperature, and T = 25 °C.
Results
Isothermal titration calorimetry
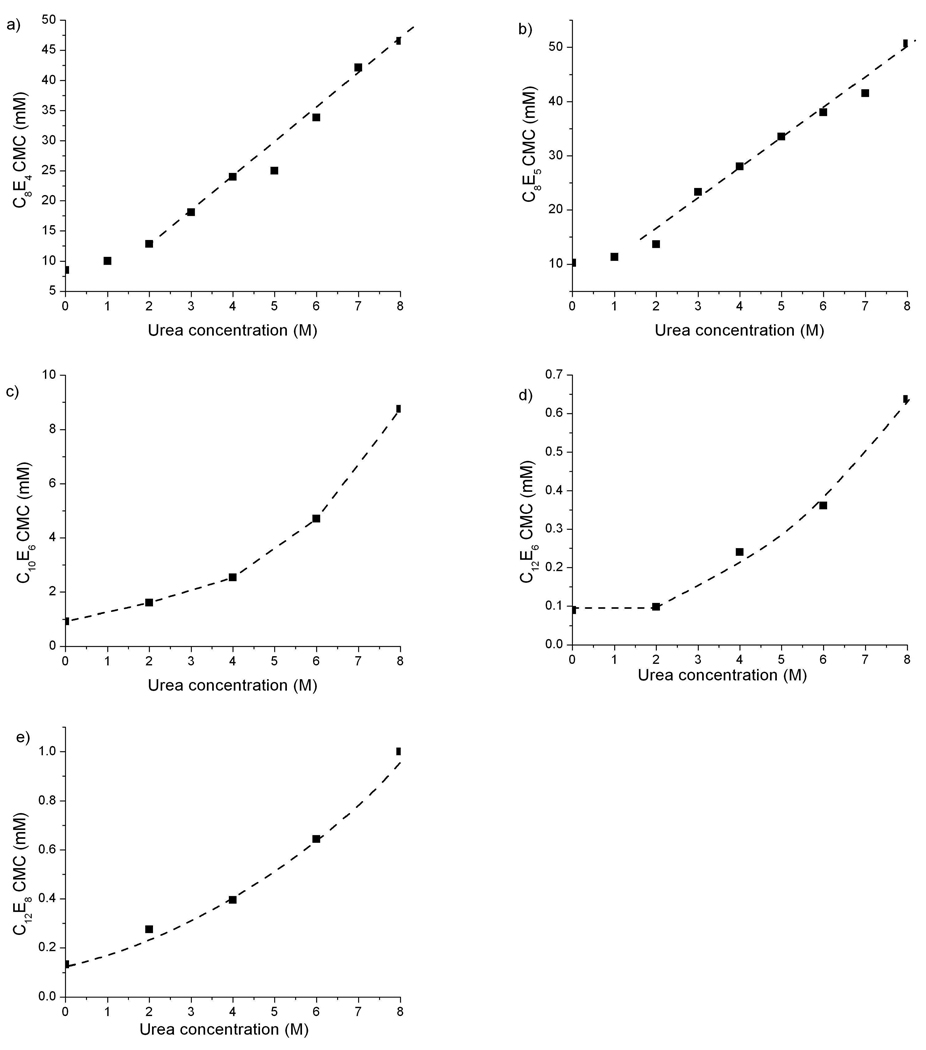
ITC provides a sensitive measure of the differential enthalpy change of concentrated surfactant solutions above the CMC upon dilution into pure solvent. Because the excess heat caused by the formation of micelles is much greater than the heats of mixing of micelles or surfactant monomers, a step transition centered is observed around the CMC43,44. The CMC increases rapidly with increasing urea concentration for all surfactants studied (Figure 1). The shorter-tailed surfactants chains, C8E4 and C8E5, have CMCs in aqueous buffer solutions that are an order of magnitude higher than those of surfactants with longer alkyl chains. As the urea concentration is increased, the CMCs of all surfactants increase about ten-fold, leading to final CMCs close to 30 mM for C8E4 and C8E5, and about 1 mM for C10E6, C12E6 and C12E8.
Figure 1.
CMC of surfactants at increasing urea concentrations measured by ITC, with dashed lines added to guide the eye. a) C8E4, b) C8E5, c) C10E6, d) C12E6, e) C12E8.
Lower consolute boundary measurements
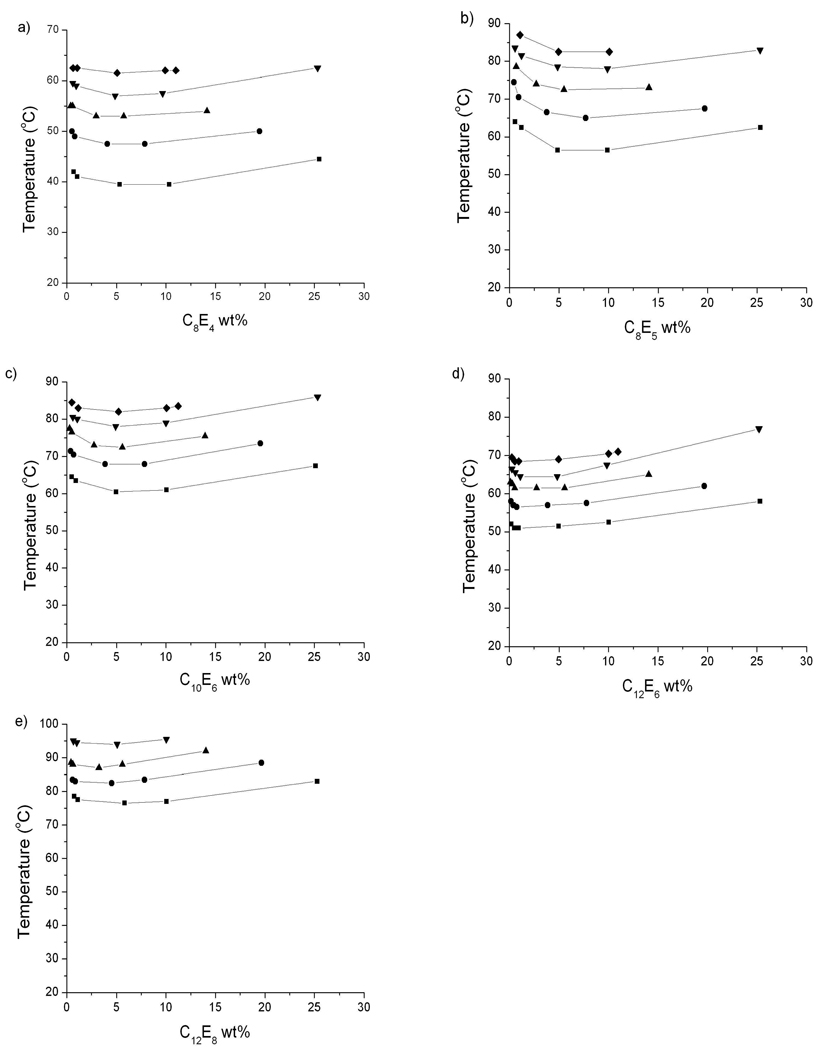
The cloud point temperatures measured in urea-free aqueous solutions of C10E6 (60 °C), C12E6 (51 °C) and C12E8 (77 °C) are consistent with values previously reported 45,46. C8E4 exhibited a cloud point temperature of 39 °C, in general agreement with the previously reported values of 43 °C45, 37.4 °C 24 and 40.4 °C 42. C8E5 exhibited a cloud point temperature of 56.5 °C, consistent with the values of 55 °C 46, 55.6 °C 24 and 60.6 °C 42. In all cases (Figure 2) the addition of urea moves the lower consolute boundary to higher temperatures. No phase separation was observed below 100 °C for C12E8 at 8 M urea.
Figure 2.
Lower consolute temperatures of a) C8E4, b) C8E5, c) C10E6, d)C12E6 and e) C12 E8 at 0 (squares), 2 (circles), 4 (triangles), 6 (inverted triangles) and 8 (diamonds) M urea. No phase separation was seen below 100 °C for C12 E8 at 8 M urea.
Small-angle neutron scattering
Two different experimental designs were explored for SANS measurements. First, in order to simulate a typical protein unfolding experiment, surfactant concentrations were kept constant as the deuterated urea concentration was increased. As noted in the ITC experiments, the CMCs increase, so along this path there will be fewer micelles present as the deuterated urea concentration increases. The second experimental path seeks to maintain a constant concentration of micelles by setting the surfactant concentration at a fixed level above the CMC at each condition.
Mixing stocks of 0 and 8 M urea surfactant solutions for sample preparation assumes a linear change in the CMC with increasing urea concentrations. For the shorter-chained surfactants, as seen from the ITC data, this assumption is justifiable. For the longer-chained surfactants, however, the increase in CMC is faster at higher urea concentrations, so this linear assumption is incorrect. Nonetheless, the CMCs of longer-chained surfactants are so low throughout the range of solution conditions that the influence of the non-linear variation of CMC is negligible.
C8E4 and C12E6
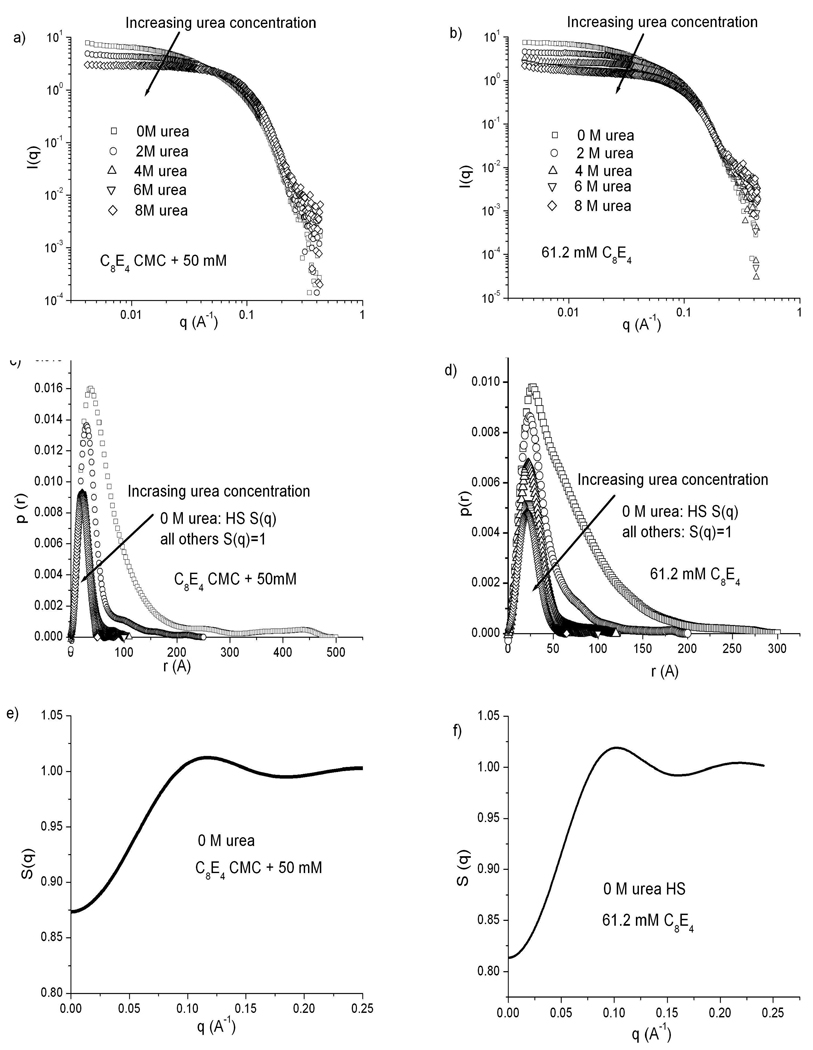
Figure 3 summarizes all the SANS data for C8E4 for both a constant surfactant concentration of 61.2 mM and for samples with surfactant concentrations 50 mM above the CMC. Significant changes in the scattering profile occur as the deuterated urea concentration is increased (panels a and b). The pair-distance distribution functions computed from these profiles (panels c and d) indicate a micelle morphological transition from elongated cylinders with maximum dimensions around 500 Å at 0 M urea to globular micelles with diameters around 50 Å at 8 M urea. Panels e and f show structure factors calculated along with the p(r) functions at 0 M urea for C8E4 using a polydisperse hard-sphere potential, and the Percus-Yevick47 approximation as a closure relation. Early work on the aggregation state of C8E4 micelles proposed models that would be incompatible with spherical micelles, but suggest micelle aggregates that grow with increasing temperature and surfactant concentration48,49. Later, Glatter et al., based on more recent SANS experiments, reported that C8E4 forms elongated micelles that become longer as the temperature approaches the CPT. They reported maximum micelle dimensions around 600 Å at 36 °C in 70 mM C8E4 in aqueous solutions.24 Results from the current experiments on C8E4 at room temperature in boric acid buffer are consistent with this more recent description of the shape of C8E4 micelles.
Figure 3.
SANS results for C8E4 micelles at urea concentrations of 0, 2, 4, 6 and 8 M. a), c), e) C8E4 concentration kept at 50 mM above the CMC at each urea concentration. b), d), f) C8E4 concentration fixed at 61.2 mM. a), b) Scattering spectra. c), d) p(r) curves calculated from each spectrum. e), f) Structure factors calculated for 0 M urea samples using a hard sphere potential (note expanded scale).
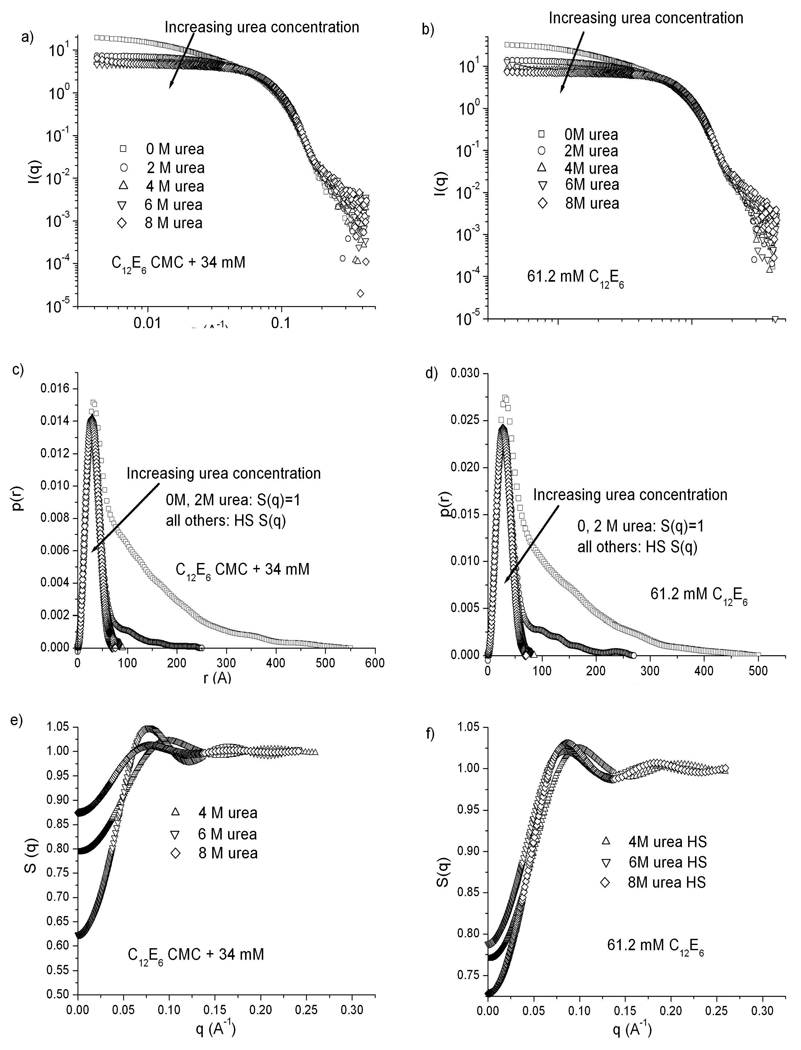
Figure 4 summarizes all the SANS data for C12E6 for both a constant surfactant concentration of 61.2 mM and for samples with surfactant concentrations 34 mM above the CMC. Similar to the pattern for C8E4, there is an elongated to globular transition as the urea concentration increases in C12E6 boric acid solutions. Many experiments have shown that micelles of C12E6 are elongated at temperatures above 20 °C, but are globular at 3 °C4,24,50.The maximum micelle dimension measured by Glatter et al.24 close to the CPT of 44.7 °C was around 800 Å, at 17 mM. At 18 °C, 17 mM C12E6, they reported micelles with a cross-section around 50 Å and maximum dimension of 250 Å24. These results are consistent with our measurements at room temperature and in boric acid solutions, of maximum dimensions around 500–550 Å and a cross-section around 40 Å for 61.2 mM and 34 mM C12E6. As the urea concentration increases the elongated micelles shrink, while the cross-sectional dimension remains the same, leading to a globular micelle, similar to those seen by Glatter et al. at 3 °C24.
Figure 4.
SANS results for C12E6 micelles at urea concentrations of 0, 2, 4, 6 and 8 M. a), c), e) C12E6 concentration kept at 34 mM above the CMC at each urea concentration. b), d), f) C12E6 concentration fixed at 61.2 mM. a), b) Scattering spectra. c), d) p(r) curves calculated from each spectrum. e), f) Structure factors calculated for 4, 6 and 8 M urea using a hard sphere potential (note expanded scale).
C8E5 and C12E8
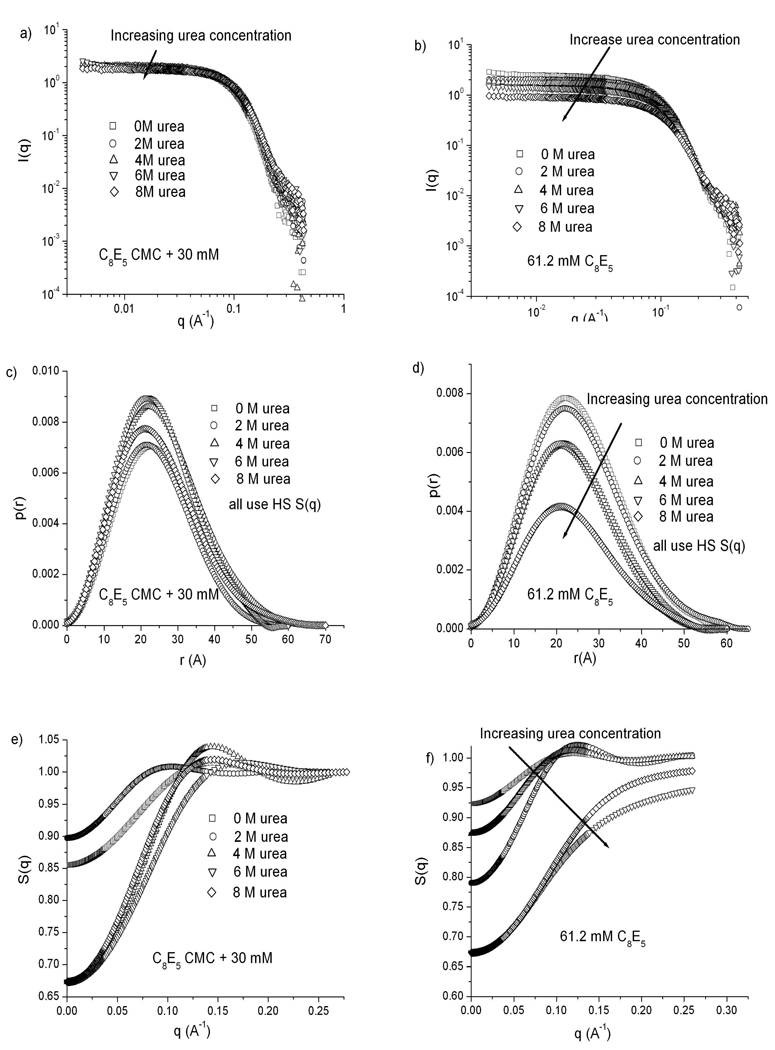
Figure 5 shows all the SANS data for C8E5 for both constant surfactant concentration at 61.2 mM and a constant level of 30 mM above the CMC at each urea concentration. As seen in panels a and b, no significant changes in the scattering profiles occur as the deuterated urea concentration is increased, although the intensity from the 61.2 mM C8E5 sample (b) decreases with increasing urea concentration due to the sharp increase in CMC, which reduces the total number of micelles present. Pair distance distribution functions computed from these profiles (panels c and d) indicate constant globular micelle morphologies at all urea concentrations, with diameters around 70 Å. Panels e and f show structure factors calculated from the p(r) functions, using a polydisperse hard-sphere potential and the Percus-Yevick approximation as a closure relation for all urea concentrations. As seen in c, experiments at 30 mM above the CMC also show a dramatic decrease in S(0) with increasing urea concentration while the interaction peak becomes sharper and moves to higher q values, indicating a decreased mean distance between particles. Previous experiments on the change in micelle structure of C8E5 have shown globular micelles with diameters around 50 Å24,42. Glatter et al. also observed a similar shift in S(q) as shown in panel c for increasing C8E5 concentrations, at 3 °C24. This is the only surfactant here for which the scattering intensity and S(q) depend on concentration, although the micelle shape remains unchanged.
Figure 5.
SANS results for C8E5 micelles at urea concentrations of 0, 2, 4, 6 and 8 M. a), c), e) C8E5 concentration kept at 30 mM above the CMC at each urea concentration. b), d), f) C8E5 concentration fixed at 61.2 mM. a), b) Scattering spectra. c), d) p(r) curves calculated from each scattering spectrum. e), f) Structure factors calculated for all samples using the hard sphere potential (note expanded scale).
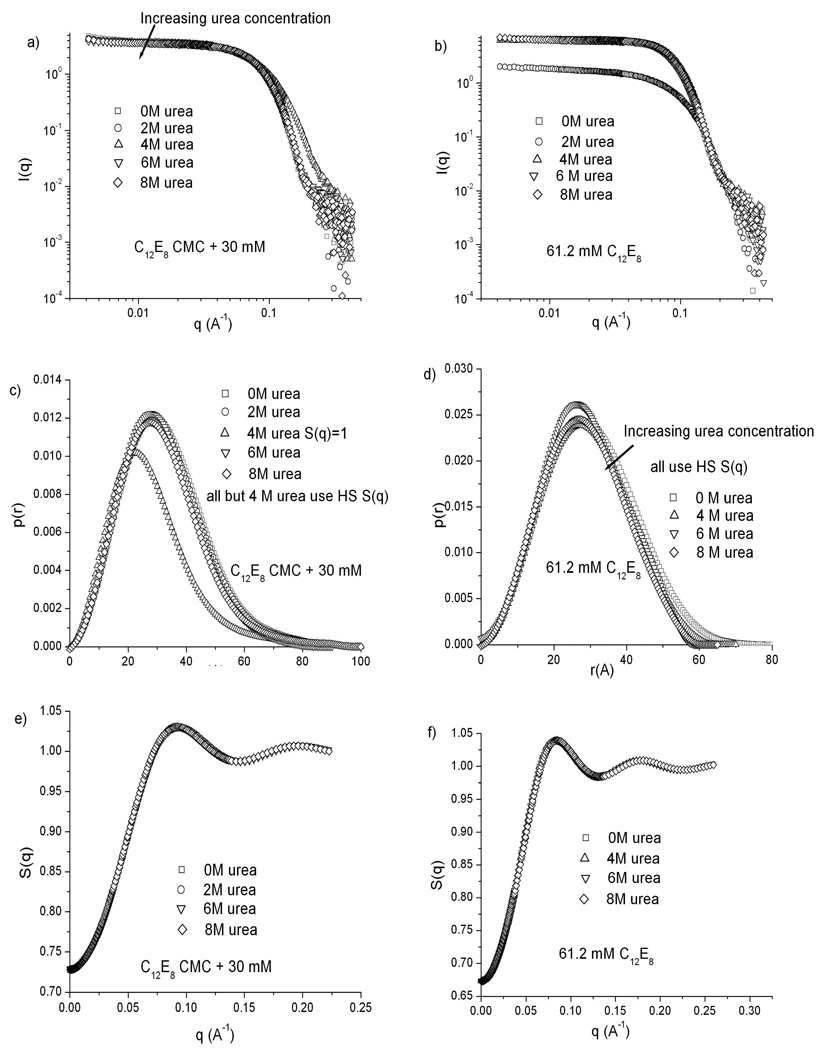
Figure 6 summarizes the SANS data for C12E8 for 61.2 mM and for 29 mM above the CMC at each urea concentration. Panels a and b reveal no significant changes in the scattering profile as the deuterated urea concentration is increased. Since the CMC of C12E8 is very low even at 8 M urea, no changes in intensity of the scattering curve are expected as the urea concentration is increased. Pair distance distribution functions computed from these profiles (panels c and d) indicate a constant globular micelle morphology at all urea concentrations, with diameters around 90 Å. The structure factors calculated as before (panels e and f) do not reflect the small variations in micelle maximum dimension with urea concentration.
Figure 6.
SANS results for C12E8 micelles at urea concentrations of 0, 2, 4, 6 and 8 M. a), c), e) C12E8 concentration kept at 29 mM above the CMC at each urea concentration. b), d), f) C12E8 concentration fixed at 61.2 mM. a), b) Scattering spectra. c), d) p(r) curves calculated from each scattering spectrum. e), f) Structure factors calculated for all samples using the hard sphere potential (note expanded scale). The 2 M urea, 61.2 mM C12E8 sample was considered an outlier, and not analyzed.
Changes in cylinder dimensions with increasing urea concentration
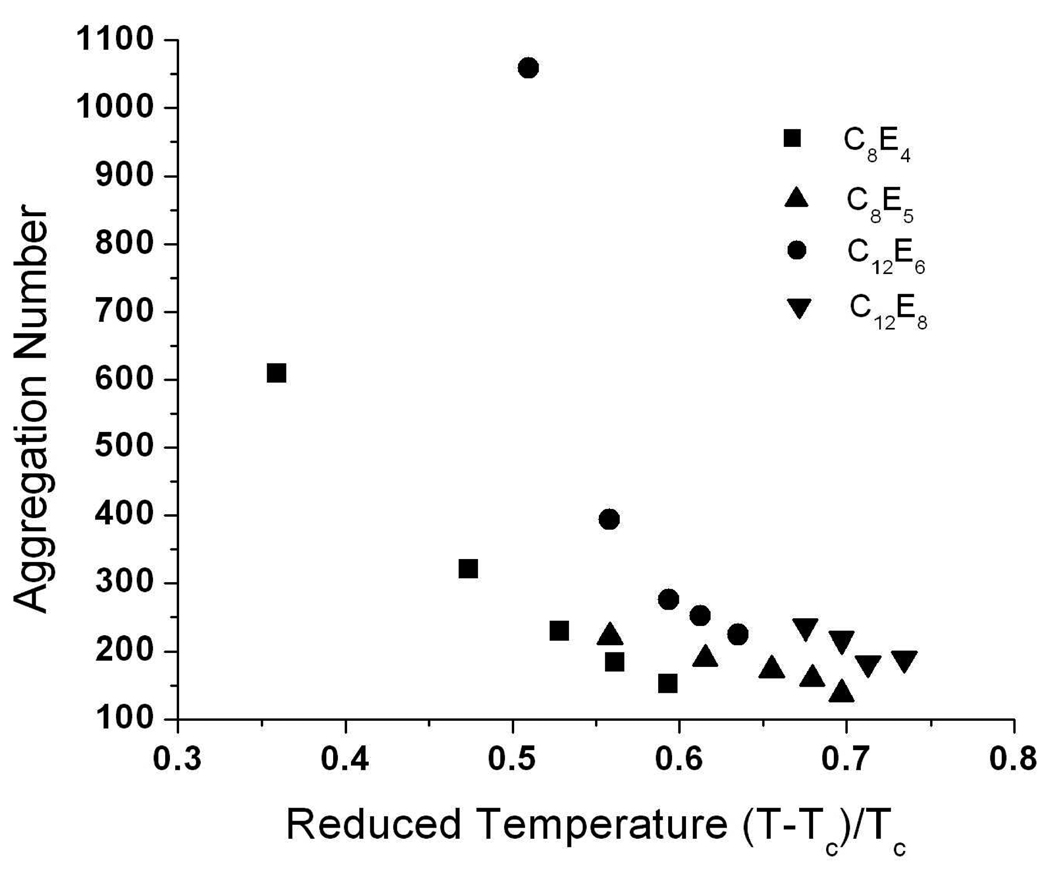
An alternative method to analyze SANS data is to calculate the form factor of the scattering particles directly from a model with an optional additional assumption of the form of the structure factor. A form factor assumption allows more detailed description of the particle geometry, as well as physical parameter calculations such as aggregation numbers for surfactant micelles. The disadvantage of this method is the (likely) possibility that several geometries could fit the scattering curves equally well. In this case, the experimentalist should use other experimental evidence to decide which model is more convincing. Here, direct fitting of scattering curves was achieved using a model for monodisperse rigid cylinders. Other models that can be made elongated or globular, such as a tri-axial ellipsoid, are also able to fit these scattering curves. The cylinder model was chosen due to its simplicity, its smaller number of fitting parameters, and because the micelles under consideration were described as cylindrical previously4,24. No interparticle interactions are accounted for here as surfactant concentrations are always below 1.5 wt%. The cylinder radius is directly based on the length of the surfactant monomer tail plus head groups. The hydrophobic chain length of the molecule is bounded by the maximum length of the fully extended hydrocarbon, as described by Tanford51. The head group length depends on its spatial conformation, solvent hydration layer and interactions with neighboring molecules. Although the cylinder radius was treated as an adjustable parameter, there were only small variations with urea concentration, and the values were within the maximum dimension expected for surfactant molecules, i.e., bounded by the sum of the extended alkyl chain length and head group length. The cylinder length, as the largest dimension of the particle, was a fitted parameter. Confirming the micelle shape changes determined by IFT/GIFT analysis, the monodisperse cylinder model shows (Table 1) a sharp decrease in micelle length for both C12E6 and C8E4, while C12E8 and C8E5 micelles remain relatively constant in size with increasing urea concentration. Aggregation numbers as a function of reduced temperature, reflecting the evolution of micelle size with increasing urea concentration, also follow the same trend, showing an asymptotic decrease for both C12E6 and C8E4 micelles while remaining relatively linear for C12E8 and C8E5 micelles (Figure 7).
Table 1.
Changes in micelle shape with increasing urea concentration using cylindrical form factor with no interparticle interactions. Surfactant micelles of C12E6 and C8E4 can be modeled as long cylinders at 0 M urea, which become smaller with increasing urea concentration. Surfactant micelles of C12E8 and C8E5 when modeled as cylinders maintain approximately the same radius and length with increasing urea concentration.
| C12E8 CMC+30 mM | ||
|---|---|---|
| Urea conc (M) | Radius (Å) | Length (Å) |
| 0 | 22 | 60 |
| 2 | 22 | 56 |
| 4 | 16 | 77 |
| 6 | 21 | 55 |
| 8 | 20 | 50 |
| C12E6 CMC+34 mM | ||
| Urea conc (M) | Radius (Å) | Length (Å) |
| 0 | 20 | 300 |
| 2 | 21 | 97 |
| 4 | 22 | 60 |
| 6 | 22 | 56 |
| 8 | 22 | 50 |
| C8E4 CMC+50 mM | ||
| Urea conc (M) | Radius (Å) | Length (Å) |
| 0 | 16 | 200 |
| 2 | 16.3 | 100 |
| 4 | 16.4 | 70 |
| 6 | 16.5 | 55 |
| 8 | 16.5 | 47 |
| C8E5 CMC+50 mM | ||
| Urea conc (M) | Radius (Å) | Length (Å) |
| 0 | 16 | 60 |
| 2 | 17 | 47 |
| 4 | 16.8 | 45 |
| 6 | 16.3 | 45 |
| 8 | 16 | 40 |
Figure 7.
Changes in micelle aggregation number with reduced temperature. Aggregation numbers were calculated based on a model of the micelle as a cylinder. The surfactants C8E4 and C12E6 show large changes in micelle size as the reduced temperature is increased compared to C8E5 and C12E8.
Discussion
The observed increase in the CMC of all surfactants studied was expected based on previous literature3,4,11. Urea improves the solvation of hydrocarbon alkyl chains9, lowering the interfacial tension between chains and their surroundings4. The magnitude of the CMC is still determined by the alkyl chain length, however, since surfactants with C12 tails still have CMC values about ten times lower than C8 surfactants at all urea concentrations. Therefore, the enhancement by urea of tail solvation is the primary driving force reducing the propensity of surfactant molecules to aggregate. However, the CMC dependence on urea concentration for the surfactants studied indicates that up to 2 M urea, the CMC increase is small for all surfactants. This indicates that there is a minimum level of perturbation of the hydration layer of surfactant molecules needed for the onset of urea-induced solubility changes. Beyond this threshold the CMC increase is linear for C8E4 and C8E5, while for C10E6, C12E6 and C12E8 the rate of change increases with urea concentration. Therefore, longer-tailed surfactant molecules require higher concentrations of urea to achieve similar effects on their hydration layers as for shorter-tailed surfactants, although the final CMC increase at 8 M urea is similar for both short- and long-tailed surfactants.
The increase in the temperature of the lower consolute boundary has also been seen previously for nonionic surfactants 4,24,25. The elongated to globular transition seen with increasing urea concentration has been predicted from a molecular thermodynamic model for CiEjs4. As the lower consolute boundary is approached by increasing the temperature, micelles are expected to become more cylindrical24. As urea replaces water in the hydration layer of micelles, the surface area of the head groups is expected to increase, since urea is about 2.5 times larger than water, increasing excluded volume repulsion between head groups. A larger polar group head group area favors the formation of more globular micelles51. The connection between micelle elongation and proximity to the consolute boundary is again demonstrated as the urea concentration is increased and the consolute boundaries of all surfactants studied move to higher temperatures. Increasing urea concentration is therefore analogous to reducing the temperature. Since the micelle solutions remain at 25 °C, at higher urea concentrations they are further from their consolute boundaries, and their size and shape tend to be more globular. As analysis of the SANS data using IFT/GIFT demonstrates, this is especially significant for surfactants with a relatively high ratio of head group size to tail length, such as C8E4 and C12E6, which tend to form elongated micelles at lower temperatures24. Surfactants with micelles that tend to be more globular at room temperature and in aqueous solutions, such as C8E524,42 and C12E8, will therefore retain globular micelles as the urea concentration is increased. Changes in micelle structure with increasing temperature depend only slightly on surfactant concentration24, and our results on the effects of urea concentration similarly indicate that micelle structure is independent of the number of micelles present. Only the magnitude of the intensity of the scattering curve of C8E5 changes when the surfactant concentration is fixed and the urea concentration is increased. This is to be expected since the CMC of C8E5 increases sharply with urea concentration, and therefore the total number of scattering micelles decreases. This effect was also expected with C8E4 micelles, but was not observed, possibly because it was masked by the large changes in micelle structure observed with C8E4.
When scattering curves were fitted to a cylindrical form factor, the same general trends shown from IFT/GIFT modeling were observed. However, aggregation numbers can be calculated only from direct modeling results and provide a better representation of the particle structure. Direct geometry modeling is also able to demonstrate more quantitatively the similar effects of increasing urea concentration and decreasing solution temperature on micelle structure; these are seen in terms of the reduced temperature even for room temperature experiments via the increase in the CPT with urea concentration. Surfactants with the highest ratios of tail to head group dimensions, C12E6 and C8E4, display an asymptotic decrease in aggregation number that does not occur with C12E8 and C8E5 (Figure 7). Since the evolution of micelle shape with urea concentration differs with surfactant type, this suggests that the mechanism of urea action also depends on the surfactant. Although additional experimental data would be necessary to expand the range of reduced temperatures screened, it is clear that one additional oxyethyelene group can greatly impact micelle morphology at all urea concentration studied, as exemplified by comparing C8E4 and C8E5 micelles. Clearly, interactions of urea with surfactant head groups play a role in micelle morphology changes.
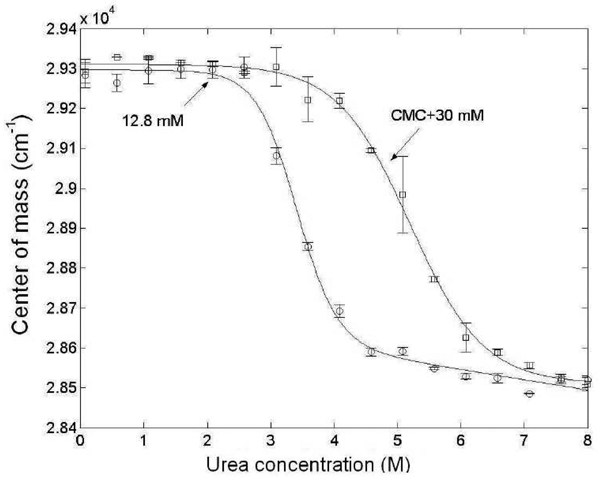
Previous research has shown that surfactant concentrations should be above the CMC to maintain the presence of micelles during the refolding of integral membrane proteins28. An example of the role of the presence of micelles in a urea-driven unfolding experiment can be seen in studies of outer membrane protein X (ompX), an integral membrane protein52. OmpX at a concentration of 0.3 mg/mL was solubilized in 12.8 mM C8E4 and the urea-induced unfolding transition of the protein was determined by fluorescence spectroscopy. The concentration of 12.8 mM C8E4 was chosen so that it would be below the CMC of the surfactant above 2 M urea. The unfolding curve was then re-measured taking into account the increase in the CMC of C8E4 at each urea concentration, so that the final concentration of C8E4 at each urea concentration was 30 mM above its CMC. A comparison of the two unfolding curves (Figure 8) shows that ompX is able to retain its tertiary structure up to higher urea concentrations in the presence of C8E4 micelles than when the surfactant concentration is below the CMC, at higher urea concentrations.
Figure 8.
Comparison of the unfolding curve of the integral membrane protein ompX solubilized in the surfactant C8E4 at a fixed surfactant concentration (12.8 mM, circles) and at variable surfactant concentrations that account for the changing CMC of C8E4 at each urea concentration (CMC + 30 mM, squares). The conformational state is characterized by the center of mass of the emitted intrinsic fluorescence intensity, with excitation at 280 nm.
For experiments to measure membrane protein stability with increasing urea concentration, a useful rule of thumb is to use a surfactant concentration about ten times above the CMC to ensure that there will be micelles present throughout the entire experiment. Further experiments52 show that the urea unfolding curve of an integral membrane protein is strongly affected by the aggregation state of the surfactant. As shown here, urea may also cause large structural changes in surfactant micelles, and these changes are also likely to affect the structure of complexes that these surfactants form with membrane proteins as they undergo urea-driven unfolding.
Conclusions
The CMCs of five nonionic surfactants (C8E4, C8E5, C10E6, C12E6 and C12E8) increase with increasing urea concentrations. The lower consolute boundary of all surfactants studied also increases with increasing urea concentration, implying that large micelle structural changes may be occurring. Small-angle neutron scattering confirmed an elongated to globular transition for surfactants with a high ratio of head group size to tail length (C12E6 and C8E4). Surfactants that form globular micelles in the absence of urea preserve this shape as the urea concentration is increased (C8E5 and C12E8). Direct form factor modeling quantifies this observation, allowing for a comparison of micelle aggregation number with distance from the cloud point as represented by the reduced temperature. This micelle shape evolution with urea concentration is surfactant-dependent, suggesting that urea-micelle interactions depend on head group size. Therefore, changing urea concentration causes shifts in the phase separation temperature, leading to analogous effects on micelle structure as for decreasing solution temperature. Practically, this study suggests that surfactant concentrations should be in a large excess (i.e., about tenfold) above the surfactant CMC during membrane protein urea unfolding experiments to avoid depleting the solution of micelles.
Acknowledgements
This publication was made possible by NIH grant P20 RR-015588 from the COBRE Program of the National Center for Research Resources. CLB gratefully acknowledges support through an NSF IGERT Graduate Fellowship DGE-0221651 and a fellowship from the Sloan Foundation. We also thank the National Institute of Standards and Technology, U.S. Department of Commerce, for providing the neutron research facilities used in this work.
References
- 1.Roseman M, Jencks WP. Interactions of urea and other polar compounds in water. J. Am. Chem. Soc. 1975;97:631–640. [Google Scholar]
- 2.Ruiz CC. A photophysical study of the urea effect on micellar properties of sodium dodecylsulfate aqueous solutions. Colloid Polymer Sci. 1995;273:1033–1040. [Google Scholar]
- 3.Ruiz CC, Sanchez FG. Effect of urea on aggregation behavior of Triton X-100 micellar solutions: a photophysical study. Journal of Colloid and Interface Science. 1994;165:110–115. [Google Scholar]
- 4.Briganti G, Puvvada S, Blankschtein D. Effect of urea on micellar properties of aqueous solutions of nonionic surfactants. J. Phys. Chem. 1991;95:8989–8995. [Google Scholar]
- 5.Whitney PL, Tanford C. Solubility of amino acid residues in aqueous urea solutions and its implications for the denaturation of proteins by urea. J. Biol. Chem. 1962;237:PC1735–PC1737. [PubMed] [Google Scholar]
- 6.Ben-Naim A, Yaacobi M. Effects of solutes on the strength of hydrophobic interaction and its temperature dependence. J. Phys. Chem. 1974;78:170–175. [Google Scholar]
- 7.Frank HS, Franks F. Structural approach to solvent power of water for hydrocarbons; urea as a structure breaker. J. Chem. Phys. 1968;48:4746–4757. [Google Scholar]
- 8.Wetlaufer DB, Malik SK, Stoller L, Coffin RL. Nonpolar group participation in the denaturation of proteins by urea and guanidinium salts. Model compound studies. J. Am. Chem. Soc. 1963;86:508–514. [Google Scholar]
- 9.Nozaki Y, Tanford C. The solubility of amino acids and related compounds in aqueous urea solutions. J. Biol. Chem. 1963;238:4074–4081. [PubMed] [Google Scholar]
- 10.Kuharski RA, Rossky PJ. Solvation of hydrophobic species in aqueous urea solution: a molecular dynamics study. J. Am. Chem. Soc. 1984;106:5794–5800. [Google Scholar]
- 11.Schick MJ. Effect of electrolyte and urea on micelle formation. J. Phys. Chem. 1964;68:3585–3592. [Google Scholar]
- 12.Ruiz CC. Micelle formation and microenvironmental properties of sodium dodecyl sulfate in aqueous urea solutions. Colloids and Surfaces A: Physicochemical and Engineering Aspects. 1999;147:349–357. [Google Scholar]
- 13.Bruning W, Holtzer A. The effect of urea on hydrophobic bonds: the critical micelle concentration of n-dodecyltrimethylammonium bromide in aqueous solutions of urea. J. Am. Chem. Soc. 1961;83:4865–4866. [Google Scholar]
- 14.Abu-Hamdiyyah M, Al-Mansour L. Effect of butylurea on the critical micelle concentration of sodium lauryl sulfate in water at different temperatures. J. Phys. Chem. 1979;83:2236–2243. [Google Scholar]
- 15.Asakawa T, Hashikawa M, Amada K, Miyagishi S. Effect of urea on micelle formation of fluorocarbon surfactants. Langmuir. 1995;11:2376–2379. [Google Scholar]
- 16.Mazer NA, Carey MC, Kwasnick RF, Benedek GB. Quasielastic light scattering studies of aqueous biliary lipid systems. Size, shape, and thermodynamics of bile salt micelles. Biochemistry. 1979;18:3064–3075. doi: 10.1021/bi00581a024. [DOI] [PubMed] [Google Scholar]
- 17.Blankschtein D, Thurston GM, Benedek GB. Phenomenological theory of equilibrium thermodynamic properties and phase separation of micellar solutions. J. Chem. Phys. 1986;15:7268–7288. [Google Scholar]
- 18.Herrmann KW, Brushmiller JG, Courchene WL. Micellar properties and critical opalescence of dimethyalkylphosphine oxide solutions. J. Phys. Chem. 1966;70:2909–2918. [Google Scholar]
- 19.Balmbra RR, Clunie JS, Corkill JM, Goodman JF. Variations in the micelle size of non-ionic detergents. Trans. Faraday Soc. 1964;60:979–985. [Google Scholar]
- 20.Kjellander R. Phase separation of non-ionic surfactant solutions. A treatment of the micellar interaction and form. J. Chem. Soc. Faraday Trans. 2. 1982;78:2025–2042. [Google Scholar]
- 21.Lindman B, Wennerström H. Nonionic micelles grow with increasing temperature. J. Phys. Chem. 1991;95:6053–6054. [Google Scholar]
- 22.Staples E, Tiddy GJT. Nuclear magnetic resonance technique to distinguish between micelle size changes and secondary aggreagation in anionic and nonionic surfactant solutions. J. Chem. Soc. Faraday Trans. 1. 1978;74:2530–2541. [Google Scholar]
- 23.Corti M, Digiorgio V. Micellar properties and critical fluctuations in aqueous solutions of nonionic amphiphiles. J. Phys. Chem. 1981;85:1442–1445. [Google Scholar]
- 24.Glatter O, Fritz G, Lindner H, Brunner-Popela J, Mittelbach R, Strey R, Egelhaaf SU. Nonionic micelles near the critical point: micellar growth and attractive interaction. Langmuir. 2000;16:8692–8701. [Google Scholar]
- 25.Han SK, Lee SM, Kim M, Schott H. Effect of protein denaturants on cloud point and krafft point of nonionic surfactants. J. Coll. Int. Sci. 1989;132:444–450. [Google Scholar]
- 26.Moller JV, Le Maire M. Detergent binding as a measure of hydrophobic surface area of integral membrane proteins. J. Biol. Chem. 1993;268:18659–18672. [PubMed] [Google Scholar]
- 27.Helenius A, Simons K. Solubilization of membrane proteins by detergents. BBA. 1975;415:29–79. doi: 10.1016/0304-4157(75)90016-7. [DOI] [PubMed] [Google Scholar]
- 28.Kleinschmidt JH, Wiener MC, Tamm LK. Outer membrane protein A of E. coli folds into detergent micelles, but not in the presence of monomeric detergent. Protein Science. 1999;8:2065–2071. doi: 10.1110/ps.8.10.2065. [DOI] [PMC free article] [PubMed] [Google Scholar]
- 29.Morgensen JE, Kleinschmidt JH, Schmidt AM, Otzen DR. Misfolding of a bacterial autotransporter. Protein Sci. 2005;14:2814–2827. doi: 10.1110/ps.051628705. [DOI] [PMC free article] [PubMed] [Google Scholar]
- 30.Vogt J, Schulz GE. The structure of the outer membrane protein OmpX from Escherichia coli reveals possible mechanisms of virulence. Structure. 1999;7:1301–1309. doi: 10.1016/s0969-2126(00)80063-5. [DOI] [PubMed] [Google Scholar]
- 31.Pautsch A, Vogt J, Model K, Siebold C, Schulz GE. Strategy for membrane protein crystallization exemplified with OmpA and OmpX. Proteins: Structure, Function, and Genetics. 1999;34:167–172. [PubMed] [Google Scholar]
- 32.Schmid B, Kromer M, Schulz GE. Expression of porin from Rhodopseudomonas blastica in Escherichia coli inclusion bodies and folding into exact native structure. FEBS Letters. 1996;381:111–114. doi: 10.1016/0014-5793(96)00080-4. [DOI] [PubMed] [Google Scholar]
- 33.Santonicola GM, Kaler EW. Mixtures of n-octyl-B-D-glucoside and triethylene glycol mono-n-octyl ether: phase behavior and micellar structure near the liquid-liquid phase boundary. Langmuir. 2005;21:9955–9963. doi: 10.1021/la050573v. [DOI] [PubMed] [Google Scholar]
- 34.Santonicola MG, Yocum MA, Lenhoff AM, Kaler EW. Self-assembly of medium-chain alkyl monoglucosides in ammonium sulfate solutions in poly(ethylene glycol) Langmuir. 2007;23:5358–5366. doi: 10.1021/la063427d. [DOI] [PubMed] [Google Scholar]
- 35.Kotlarchyk M, Chen SH. Analysis of small angle neutron scattering spectra from polydisperse interacting colloids. J. Chem. Phys. 1983;79:2461–2469. [Google Scholar]
- 36.Kaler EW. Small-angle scattering from complex fluids. In: Brumberger H, editor. Modern Aspects of Small-Angle Scattering. Dordrecht: Kluwer Academic Publishers; 1993. pp. 329–353. [Google Scholar]
- 37.Hubbard FPJ, Santonicola G, Kaler EW, Abbott NL. Small-angle neutron scattering from mixtures of sodium dodecyl sulfate and a cationic, bolaform surfactant containing azobenzene. Langmuir. 2005;21:6131–6136. doi: 10.1021/la050263c. [DOI] [PubMed] [Google Scholar]
- 38.Glatter O, Fritz G. Structure and interaction in dense colloidal systems:evaluation of scattering data by the generalized indirect Fourier transformation method. J. Phys.: Condens. Matter. 2006;18:S2403–S2419. [Google Scholar]
- 39.Porod G. General theory. In: Kratky O, editor. Small Angle X-ray Scattering. London: Academic Press; 1982. pp. 17–53. [Google Scholar]
- 40.Glatter O. Modern methods of data analysis in small-angle neutron scattering. In: Brumberger H, editor. Modern Aspects of Small-Angle Scattering. Dordrecht: Kluwer Academic Publishers; 1985. pp. 107–180. [Google Scholar]
- 41.Glatter O. Data evaluation in small angle scattering: calculation of the radial electron density distribution by means of indirect Fourier transform. Acta Physica Austriaca. 1977;47:83–102. [Google Scholar]
- 42.Zulauf M, Rosenbusch JP. Micelle clusters of octylhydroxyoligo(oxyethylenes) J. Phys. Chem. 1983;87:856–862. [Google Scholar]
- 43.Dai S, Tam KC. Isothermal titration calorimetric studies of alkyl phenol ethoxylate surfactants in aqueous solutions. Colloids and Surfaces A. 2003;229:157–168. [Google Scholar]
- 44.Meagher RJ, Hatton TA, Bose A. Enthalpy measurements in aqueous SDS/DTAB solutions using isothermal titration microcalorimetry. Langmuir. 1998;14:4081–4087. [Google Scholar]
- 45.Mitchell DJ, Tiddy GJT, Loraine W, Bostock T, McDonald MP. Phase behaviour of polyoxyethylene surfactants with water. J. Chem. Soc. Faraday Trans. 1983;79:975–1000. [Google Scholar]
- 46.Sjöblom J, Stenius P, Danielsson I. Phase equilibria of nonionic surfactants and the formation of microemulsions. In: Schick MJ, editor. Nonionic surfactants. New York: Marcel Dekker; 1987. pp. 369–431. [Google Scholar]
- 47.Percus JK, Yevick GJ. Analysis of classical statistical mechanics by means of collective coordinates. Phys. Rev. 1958;110:1–13. [Google Scholar]
- 48.Strunk H, Lang P, Findenegg GH. Clustering of micelles in aqueous solutions of tetraoxyethylene-n-octyl ether (C8E4) as monitored by static and dynamic light scattering. J. Phys. Chem. 1994;98:11557–11562. [Google Scholar]
- 49.Lang P, Glatter O. Small-angle X-ray scattering from aqueous solutions of tetra(oxyethylene)-n-octyl ether. Langmuir. 1996;12:1193–1198. [Google Scholar]
- 50.Brown W, Rymden R. Static and dynamical properties of a nonionic surfactant (C12E6) in aqueous solution. J. Phys. Chem. 1987;91:3565–3571. [Google Scholar]
- 51.Tanford C. The Hydrophobic Effect: Formation of Micelles and Biological Membranes. New York, NY: John Wiley and Sons; 1980. [Google Scholar]
- 52.Bianco CL. Role of Non-Ionic Surfactants in Promoting the Folding and Stability of Integral Membrane Proteins. Ph.D. thesis. Newark, DE: University of Delaware; 2008. p. 317. [Google Scholar]


