

Abstract
The goal of this study was to evaluate the performance of a computer-aided detection (CAD) system in full-field digital mammography (Senographe 2000D, General Electric, Buc, France) in finding out carcinomas depending on the parenchymal density. A total of 226 mediolateral oblique (MLO) and 186 craniocaudal (CC) mammographic views of histologically proven cancers were retrospectively evaluated with a digital CAD system (ImageChecker V2.3 R2 Technology, Los Altos, CA, USA). Malignant tumors were detected correctly by CAD in MLO view in 84.85% in breasts with parenchymal tissue density of the American College of Radiology (ACR) type 1, in 70.33% of the ACR type 2, in 68.12% of the ACR type 3, and in 69.70% of the ACR type 4. For the CC view, similar results were found according to the ACR types. Using the chi-square and McNemar tests, there was no statistical significance. However, a trend of better detection could be seen with decreasing ACR type. In conclusion, there seems to be a tendency for breast tissue density to affect the detection rate of breast cancer when using the CAD system.
Key Words: Full-field digital mammography, computer-aided detection (CAD), breast density, ACR types
Introduction
Breast cancer is the most common cancer in women over the age of 40 years.1 Early detection is believed to be important for improving prognosis and therapy with reduction of mortality and morbidity.2 Mammography is well established to detect breast cancer early. Several studies have shown that the detection rate of breast cancer can be improved by up to 15% by double reading.3–7 In the last few years, computer-aided diagnosis (CAD) was used for screen-film mammography. This technique requires a digitizer that converts the analog image to a digital image prior to implementation of the CAD algorithm.8–11 More recently, a new CAD system has become available that processes primary digital images and can be used directly on digital mammography images.12–15
Satija et al.16 evaluated 82,391 screening mammograms among 36,495 women aged 40–80 years and found that American College of Radiology (ACR) classes 1 and 2 breasts were associated with a relative risk of 0.39 at the age of 40 and 0.61 at the age of 80 with respect to the general population at the same age. The relative risk for ACR type 3 was 0.72 at age 40 and 1.13 at age 80. High breast tissue density is known to interfere with the interpretation of mammograms. Breast tissue density is classified into four types according to the BI-RADS lexicon of the American College of Radiology (ACR).17 Mandelson et al.18 evaluated breast density as a predictor of mammographic breast cancer detection. Sensitivity was 80% among women with fatty breast tissue (ACR type 1), but only 30% in women with extremely dense breast tissue (ACR type 4). There are many studies indicating that CAD is a useful tool to aid breast cancer detection and interpretation by radiologists.19–21 The following authors used secondarily digitized mammograms for evaluation in different CAD systems. Brem et al.20 found that the CAD system (Second Look 3.4, CADx Systems, Beavercreek, OH, USA) improved significantly the detection of breast cancer by increasing radiologist sensitivity by 21.2%. Baker et al.21 evaluated the sensitivity of commercially available CAD systems (ImageChecker M1000, Version 2.5, R2 Technology, Sunnyvale, CA, USA, and Second Look 4.0, CADx Systems) for revealing architectural distortion. They found that fewer than one half of the cases of architectural distortion were detected by these two CAD systems used for interpretation of screening mammograms. The authors concluded that considerable improvement in the sensitivity of CAD systems is needed for detecting this type of lesion. CAD may be particularly advantageous in patients with dense breasts, in which mammography is most challenging. However, often, secondary digitized mammograms were used. The primary CAD software (ImageChecker Version 2.3, R2 Technology, Los Altos, CA, USA), which we used with full-field digital mammography, was tested in a preliminary study identifying 55 out of 63 breast cancers with a sensitivity of 87.3% and 0.6 false positive per image.15 The results were similar to those of a large trial using screen-film mammograms, which were secondarily digitized with a sensitivity of 83.6% (906 of 1083 cancers) and about 1.0 false positive per image.19 It would therefore be useful to investigate the performance of a computer-aided detection system of full-field digital mammograms in dependence of breast density.
The goal of this study was to evaluate the clinical performance of a CAD system of a full-field digital mammography system in detecting carcinomas in breasts of different tissue densities.
Materials and Methods
The CAD system (ImageChecker V2.3; R2 Technology, Los Altos, CA, USA) was retrospectively applied on digital mammograms of 226 histologically proven carcinomas (Senographe 2000D, GE Medical Systems, Buc, France), which were retrospectively collected from the routine work of our diagnostic breast center. For this study, approval of the ethics committee prior to starting the study was received.
All patients underwent clinical course, ultrasound, and mammography when they present at our institution. The retrospectively evaluated cases included all cancers, which were seen at our daily routine work. Therefore, cancers were included into the study, which were only detected in mammography, only in sonography, or which were seen even only in MR mammography. No primary selection was performed. Two hundred twenty-six images in mediolateral oblique view (MLO) and 186 images in craniocaudal view (CC) were available. Some of the patients did not receive a CC view because of age and/or further diagnostic in MR mammography or because of previous mammograms of the tumor in analog technique.
Of the 226 images in MLO view, histology revealed 45 ductal carcinoma in situ (DCIS), 96 invasive ductal carcinomas (IDC), 41 invasive lobular carcinomas (ILC), 10 lobular carcinomas in situ (LCIS), 10 tubular carcinomas (TC), 2 invasive papillary carcinomas (IPC), 10 ductal-lobular carcinomas (DL), 4 angiosarcomas, 3 medullary carcinomas (MEC), 3 mucinous carcinomas (MUC), and 3 other entities. In CC view, of the 186 images, 31 DCIS, 83 IDC, 33 ILC, 9 LCIS, 8 TC, 2 IPC, 9 DL, 3 AS and MEC, 2 MUC, and 3 others were found.
The breast tissue was classified primary by the breast radiologist when the patient presented in our diagnostic breast center according to the BI-RADS categories in four ACR classes (Table 1). This means that all mammograms are categorized due to the BI-RADS classification including breast tissue density and the categories of the BI-RADS (classes 0–6). At that time, diagnosis and histology of suspicious lesions were not confirmed.
Table 1.
Classification of Breast Tissue Density According to the American College of Radiology17
| ACR type | Description | Diagnostic accuracy |
|---|---|---|
| 1 | Mostly fat | Very high |
| 2 | Fibroglandular | High |
| 3 | Heterogeneously dense | Limitation |
| 4 | Very dense | Limitation |
In the MLO view, of the 226 cases, 33 showed fatty breast density, 91 fibroglandular, 69 heterogeneously dense breast, and 33 extremely dense breast tissue. In CC view, breast tissue was fatty in 30 of the 186 cases, fibroglandular in 70, heterogeneously dense in 56, and extremely dense in 30.
All these cases were retrospectively seen from one radiologist on the workstation with the CAD prompts when histology was available. At that time, tumor localization on the preoperative mammography was well known because of the correlation to preoperative localization imaging, to specimen radiography, or to histological reports. CAD marks that were consistent with the histological result of carcinoma were counted as a true positive (tp), whereas CAD marks in other parenchyma areas were false positive (fp). Carcinomas not marked were considered as false negative (fn). Chi-square test was performed to compare independent frequencies; McNemar test was used to compare dependent frequencies.
Results
One hundred fifteen of the 186 breast cancers with images in MLO and CC projection were marked in MLO and CC view. Further 25 tumors were seen only in the CC and finally 17 tumors only in the MLO view. Twenty-nine of the tumors were not detected in either view. McNemar test showed no significant difference between the tumor detection in MLO or CC view (p = 0.2801). However, more tumors were seen in CC view than in MLO view. An example is shown in Figure 1.
Fig 1.
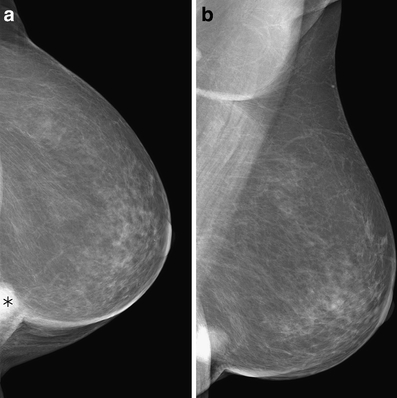
True positive marker in CC view (a); no marker in MLO view (b). Mass near the thoracic wall.
With respect to the breast tissue density, malignant tumors were marked correctly in MLO view with the CAD system in 84.85% in the ACR type 1, in 70.33% in the ACR type 2, in 68.12% in the ACR type 3, and in 69.70% in the ACR type 4 breasts. For the CC view, the markers were correctly placed in 86.67% in ACR type 1, 77.14% in ACR type 2, 73.21% in ACR type 3, and 63.33% in ACR type 4 breasts. Using the chi-square test, there was no statistical significance (p > 0.05). However, a trend of better detection could be seen with decreasing ACR type.
The differentiation of CAD prompts in dependence of microcalcifications, masses, or masses with microcalcifications is shown in Tables 2 and 3.
Table 2.
CAD Marks in Dependence of Breast Tissue Type (ACR) in MLO View
| ACR | MC | MA | No mark | MA + MC | Total |
|---|---|---|---|---|---|
| 1 | 0 | 22 | 6 | 5 | 33 |
| 2 | 16 | 47 | 23 | 5 | 91 |
| 3 | 19 | 16 | 31 | 3 | 69 |
| 4 | 12 | 3 | 17 | 1 | 33 |
| Total | 47 | 88 | 77 | 14 | 226 |
Differentiation between microcalcification (MC), mass (MA), and mass with microcalcification (MA + MC).
Table 3.
CAD Marks in Dependence of Breast Tissue Type (ACR) in CC View
| ACR | MC | MA | No mark | MA + MC | Total |
|---|---|---|---|---|---|
| 1 | 1 | 20 | 5 | 4 | 30 |
| 2 | 11 | 41 | 14 | 4 | 70 |
| 3 | 14 | 19 | 20 | 3 | 56 |
| 4 | 11 | 4 | 13 | 2 | 30 |
| Total | 37 | 84 | 52 | 13 | 186 |
Differentiation between microcalcification (MC), mass (MA), and mass with microcalcification (MA + MC).
In Figure 2, an example of different breast tissue density types and the marks placed by the CAD system are shown.
Fig 2.
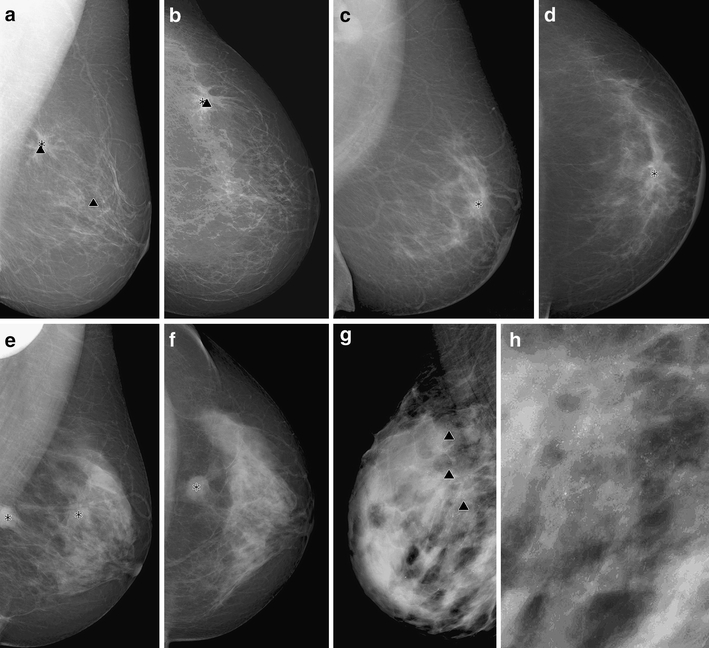
True-positive and false-positive CAD markers in different breast tissue types. (a, b) Breast cancer with true positive markers for the microcalcifications (∇) and the mass (*) of the tumor in the upper quadrant of the breast in MLO (a) and CC (b) view in a fatty-type breast (ACR type 1). False-positive marker in the middle of the breast (vessel calcification) in MLO view. (c, d) Mass in a fibroglandular breast tissue (ACR type 2) with true positive marker in MLO (c) and CC view (d). (e, f) True positive markers in a breast with heterogeneously dense breast tissue (ACR type 3) with a bifocal mass in MLO view (e). Only one marker in CC view (f). (g, h) True positive markers of a cancer with diffuse pleomorphic microcalcifications in an extremely dense breast (ACR type 4).
Discussion
In literature, there are different studies about the influence of breast tissue density on detection of breast cancers. Ho and Lam22 evaluated a total of 264 sets of bilateral screening mammograms taken in CC and MLO projections with secondarily digitized mammograms. The CAD system (Second Look, CADx Medical Systems, Version 1.1) detected 14 out of the total 15 cancers in fatty breasts with a sensitivity of 93.3% and 1.3 false-positive marks per image. In breasts with scattered fibroglandular tissue pattern, the sensitivity was 93.9% with 1.6 false-positive marks per image. In heterogeneously dense breasts, the sensitivity of the CAD system fell to 84.8% with 1.6 false-positive marks per image. The sensitivity of the CAD system dropped further to 64.3% in markedly dense breasts with 1.2 false-positive marks per image. The decrease in sensitivity in dense breasts was significant in this study (p = 0.046).22 Our study also revealed a tendency of increasing false-negative results with increased breast tissue by using a primary CAD system. The results for this CAD system, however, were not significantly different (p > 0.05).
Birdwell et al.23 showed no significant difference in CAD performance in dense and nondense breasts. They found missed cancers to be evenly distributed in mostly fatty and dense breasts (51 and 49%, respectively). The CAD system used in this study (R2 Technology V2.0; R2 Technology, Los Altos, CA, USA) consisted of a laser digitizer, a computer using proprietary signal-processing algorithms, and a customized motorized viewer with video display monitor. The original prior mammograms were digitized at 50-μm resolution with 12 bits of gray scale.23
Brem et al.24 revealed that breast density does not impact overall CAD detection of breast cancer. Ninety percent of cancers were detected in nondense breasts and 88% cancers in dense breasts. CAD sensitivity was not effected by breast density (p = 0.38). There were more false-positive marks on dense vs. nondense mammograms (p = 0.04).24
Malich et al.25 evaluated in a recent study the clinical impact of breast density and density of the lesion's background on the performance of a computer-aided detection system (Second Look 5.0, CADx Systems) in the detection of breast masses and microcalcifications. Overall breast density and density at a lesion's background do not appear to have a significant effect on CAD sensitivity or specificity for microcalcifications. CAD sensitivity for masses may be lowered in cases with heterogeneously and extremely dense breast, and CAD specificity for masses is highest in cases with extremely fatty breasts.25
The comparison of the different studies shows a lot of variations of the study designs. For example, there are differences in the patient population, in the pathologies of the mammograms (microcalcifications, masses, architectural distortion), in the histologies of the evaluated cases, and in the CAD systems used (digital vs. analog mammograms, Second Look of CADx Systems vs. ImageChecker of R2 Technology, different software versions). These facts could be the reasons for differences in the above-mentioned studies.
In conclusion, however, our results appear to be in line with a lot of the above-mentioned publications without significant effect of breast density in detection of breast cancer. However, there seems to be a tendency toward higher sensitivity for decreasing ACR types of the breast. The advantage of the presented CAD system is the use of a full-field digital mammography system with automatically shown prompts facilitating daily workflow. Therefore, these combination systems (CAD software and full-field digital mammography system) could be used in screening settings, perhaps substituting the second reader in the necessary double-reading process.
References
- 1.Moskowitz M. Screening for breast cancer: how effective are our test? A critical review. CA Cancer J Clin. 1983;33:26–39. doi: 10.3322/canjclin.33.1.26. [DOI] [PubMed] [Google Scholar]
- 2.Rennie J, Rusting R. Making headway against cancer. Sci Am. 1996;3:56–59. doi: 10.1038/scientificamerican0996-56. [DOI] [PubMed] [Google Scholar]
- 3.Bird RE. Professional quality assurance for mammography screening programs. Radiology. 1990;77:8–10. doi: 10.1148/radiology.177.2.2217807. [DOI] [PubMed] [Google Scholar]
- 4.Chan HP, Doi K, Vyborny CJ, Schmidt RA, Metz CE, Lam KL, Ogura T, Wu YZ, MacMahon H. Improvement in radiologists' detection of clustered microcalcifications on mammograms. The potential of computer-aided diagnosis. Invest Radiol. 1990;25:1102–1110. doi: 10.1097/00004424-199010000-00006. [DOI] [PubMed] [Google Scholar]
- 5.Zheng B, Chang YH, Staiger M, Good W, Gur D. Computer-aided detection of clustered microcalcifications in digitized mammograms. Acad Radiol. 1995;2:655–662. doi: 10.1016/S1076-6332(05)80431-3. [DOI] [PubMed] [Google Scholar]
- 6.Chan HP, Sahiner B, Helvie MA, Petrick N, Roubidoux MA, Wilson TE, Adler DD, Paramagul C, Newman JS, Sanjay-Gopal S. Improvement of radiologists' characterization of mammographic masses by using computer-aided diagnosis: an ROC study. Radiology. 1999;212:817–827. doi: 10.1148/radiology.212.3.r99au47817. [DOI] [PubMed] [Google Scholar]
- 7.Thurfjell EL, Lernevall KA, Taube AA. Benefit of independent double reading in a population-based mammography screening program. Radiology. 1994;191:241–244. doi: 10.1148/radiology.191.1.8134580. [DOI] [PubMed] [Google Scholar]
- 8.Malich A, Marx C, Facius M, Boehm T, Fleck M, Kaiser WA. Tumour detection rate of a new commercially available computer-aided detection system. Eur Radiol. 2001;11:2454–2459. doi: 10.1007/s003300101079. [DOI] [PubMed] [Google Scholar]
- 9.Vyborny CJ. Can computers help radiologists read mammograms? Radiology. 1994;191:315–317. doi: 10.1148/radiology.191.2.8153298. [DOI] [PubMed] [Google Scholar]
- 10.Doi K, MacMahon H, Katsuragawa S, Nishikawa RM, Jiang Y. Computer-aided diagnosis in radiology: potential and pitfalls. Eur Radiol. 1999;31:97–109. doi: 10.1016/S0720-048X(99)00016-9. [DOI] [PubMed] [Google Scholar]
- 11.Funovics M, Schamp S, Helbich TH, Lackner B, Wunderbaldinger P, Fuchsjäger M, Lechner G, Wolf G. Evaluation of a computer-assisted diagnosis system in breast carcinoma. Röfo Fortschr Geb Röntgenstr Neuen Bildgeb Verfahr. 2001;173:218–223. doi: 10.1055/s-2001-11608. [DOI] [PubMed] [Google Scholar]
- 12.Muller S. Full field digital mammography designed as a complete system. Eur Radiol. 1999;31:25–34. doi: 10.1016/S0720-048X(99)00066-2. [DOI] [PubMed] [Google Scholar]
- 13.Bick U. Full-field digital mammography. Röfo Fortschr Geb Röntgenstr Neuen Bildgeb Verfahr. 2000;173:957–964. doi: 10.1055/s-2000-9210. [DOI] [PubMed] [Google Scholar]
- 14.Obenauer S, Luftner-Nagel S, Heyden D, Munzel U, Baum F, Grabbe E. Screen-film vs full-field digital mammography: image quality, detectability and characterization of lesions. Eur Radiol. 2002;12:1697–1702. doi: 10.1007/s00330-001-1269-y. [DOI] [PubMed] [Google Scholar]
- 15.Baum F, Fischer U, Obenauer S, Grabbe E. Computer-aided detection in direct digital full-field mammography: initial results. Eur Radiol. 2002;12:3015–3017. doi: 10.1007/s00330-002-1393-3. [DOI] [PubMed] [Google Scholar]
- 16.Satija S, Moore RH, Michalson JS, et al. Breast tissue patterns as a risk factor for developing cancer (abstract) Radiology. 2000;217:446. [Google Scholar]
- 17.Illustrated breast imaging reporting and data system (BI-RADS) 3. Reston, VA: American College of Radiology; 1998. [Google Scholar]
- 18.Mandelson MT, Oestreicher N, Porter PL, White D, Finder CA, Taplin SH, White E. Breast density as a predictor of mammographic detection: comparison of interval- and screen-detected cancers. J Natl Cancer Inst. 2000;92:1081–1087. doi: 10.1093/jnci/92.13.1081. [DOI] [PubMed] [Google Scholar]
- 19.Warren Burhenne LJ, Wood SA, D'Orsi CJ, Feig SA, Kopans DB, O'Shaughnessy KF, Sickles EA, Tabar L, Vyborny CJ, Castellino RA. Potential contribution of computer-aided detection to the sensitivity of screening mammography. Radiology. 2000;215:554–562. doi: 10.1148/radiology.215.2.r00ma15554. [DOI] [PubMed] [Google Scholar]
- 20.Brem RF, Baum J, Lechner M, Kaplan S, Souders S, Naul LG, Hoffmeister J. Improvement in sensitivity of screening mammography with computer-aided detection: a multiinstitutional trial. Am J Roentgenol. 2003;181:687–693. doi: 10.2214/ajr.181.3.1810687. [DOI] [PubMed] [Google Scholar]
- 21.Baker JA, Rosen EL, Lo JY, Gimenez EI, Walsh R, Soo MS. Computer-aided detection (CAD) in screening mammography: sensitivity of commercial CAD systems for detecting architectural distortion. Am J Roentgenol. 2003;181:1083–1088. doi: 10.2214/ajr.181.4.1811083. [DOI] [PubMed] [Google Scholar]
- 22.Ho WT, Lam PW. Clinical performance of computer-assisted detection (CAD) system in detecting carcinoma in breasts of different densities. Clin Radiol. 2003;58:133–136. doi: 10.1053/crad.2002.1131. [DOI] [PubMed] [Google Scholar]
- 23.Birdwell RL, Ikeda DM, O'Shaugnessy KF, Sickles EA. Mammographic characteristics of 115 missed cancers later detected with screening mammography and the potential utility of computer-aided detection. Radiology. 2001;219:192–202. doi: 10.1148/radiology.219.1.r01ap16192. [DOI] [PubMed] [Google Scholar]
- 24.Brem RF, Hoffmeister JW, Rapelyea JA, Zisman G, Mohtashemi K, Jindal G, Disimio MP, Rogers SK. Impact of breast density on computer-aided detection for breast cancer. Am J Roentgenol. 2005;184:439–444. doi: 10.2214/ajr.184.2.01840439. [DOI] [PubMed] [Google Scholar]
- 25.Malich A, Fischer DR, Facius M, Petrovich A, Boettcher J, Marx C, Hansch A, Kaiser WA. Effect of breast density on computer aided detection. J Digit Imaging. 2005;18:227–233. doi: 10.1007/s10278-004-1047-x. [DOI] [PMC free article] [PubMed] [Google Scholar]