Abstract
Because of the large difference of the densities in the lung and other structures, the chest x-ray image behaves as a wide-range intensity distribution, which brings on a bit of difficulty to investigate the focus. In the paper, according to the intensity properties of the chest radiograph, the chest radiographic image is divided into three subregions, and a piecewise linear transformation model is established. An approach of automatic enhancement is presented, based on the gray-level normalization. The average enhanced ratios of three subregions of the normal and severe acute respiratory syndrome image are increased by 10.70% and 25.55%, respectively. The technique is proved to be effective through the evaluation of the improved images.
Key Words: Medical image processing, image enhancement, chest radiograph, SARS
Introduction
The chest radiograph is usually employed to diagnose the diseases in the thorax. It is often used especially to identify the lung disease. Sometimes it is demanded to diagnose the infection state of the lung rapidly in an emergency, such as the severe acute respiratory syndrome (SARS).
Image enhancement for chest radiograph is performed to improve the visualization of tissues and structures by optimizing some parameters, e.g., contrast, brightness, spatial resolution, and noise level, to find out various diseases in the chest. But the digitized chest radiographs suffer from poor quality in most of situations, so that the details of lung and mediastinum cannot be distinguished easily.
Because the x-ray attenuation across the lung is lower than other contents, the image of the lung becomes darker than the others on the chest radiograph. The traditional techniques of image enhancement apply the linear or S-form transformation to change the brightness and contrast, and the histogram equalization is often used for improving visual effect, which are popular in many medical image work stations so far. Because they are operated on the global area, they cannot meet the improved requirements simultaneously for the different parts of chest radiograph. In recent years, several local image enhancement algorithms have been presented.1–6 Some enhancement methods based on histogram equalization7–11 and modern signal processing techniques12,13 to improve the effect of the chest radiograph are given also.
In the paper, according to the gray-level properties of the different areas of the chest radiographic image, the global image is divided into three sections, and the adjusting effects of the piecewise linear transformation are analyzed. An approach of automatic enhancement is given by combing the histogram equalization with the gray-level transformation. It is shown that the details of the whole chest image are sharper.
Materials and Methods
Approval of the institutional review board of the Children Hospital of Shanxi Province was obtained prior to start of the study.
Analysis of Chest Radiograph and Automatic Enhancement Algorithm
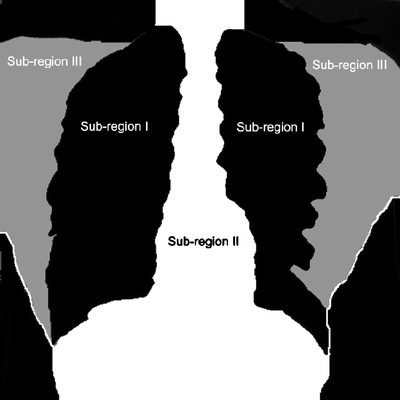
The appearance of chest radiograph indicates the lung area to be darker because of lower mass density and the close-grained structures brighter, such as spine, rib, and abdomen. According to the intensity of the different regions of chest radiograph, the image can be divided into three parts: subregion I standing for the lung part, subregion II being the spine, heart, and abdomen, and subregion III standing for the shoulders, as shown in Figure 1. The subregion I looks like darker, the subregion III brighter, and the subregion II brightest, especially in the abdomen area. The goal of the gray-level transformation is to achieve a flat intensity instead of strong black and white difference on the whole image for improving the visualization of the details.
Fig 1.
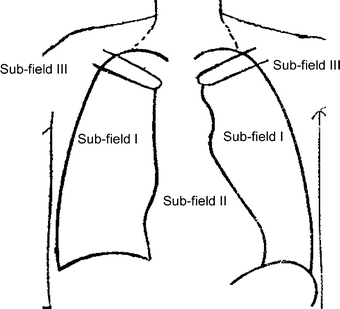
Divided parts of chest radiograph.
We can adjust the brightness and contrast of the subregions with a piecewise linear transformation, i.e., g(x,y) = L( f (x,y)). The two or three piecewise linear transformation is often used in actual situation.
Aiming at the intensity properties of the chest radiograph, we adopt three piecewise linear transformation, as shown in Figure 2. The equation is expressed by
 |
1 |
where
 |
Fig 2.
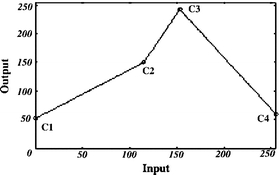
Gray-level transform of chest radiograph.
In Figure 2, the input corresponding with C1C2, C2C3, and C3C4 spans the gray-level range of the lung (subregion I), shoulder and top of spine (subregions II and III), and heart, abdomen, and middle and bottom of spine (subregion II), respectively, where  stand for the inputs of the point C1, C2, C3, and C4 for an 8-bit digital image.
The enhancement effect for the chest radiograph is determined by adjustment of the points C1, C2, C3, and C4, which are described in the following.
C1 adjusts the brightness and contrast of subregion I. The larger the slope of C1C2 is, the stronger the contrast is. The strong contrast is not expected usually because of an extra darkness. The contrast can be reduced with increase of brightness by increasing C1.
C2 mainly adjusts the contrast of subregion I, and it almost does not affect other subregions. So we can alone change the output of C2 to obtain the desired visualization of the lung region.
C3 adjusts the brightness of subregions II and III, but hardly affects subregion I. The output of C3 should not be larger; otherwise, the tops of subregions II and III are much more brighter, which causes the structures to be undistinguishable.
C4 adjusts the brightness and contrast of subregion II. It creates a negative effect when the output of C4 is less than that of C3.
Approach of Automatic Enhancement for Chest Radiograph
Although we found out the regulation of the chest radiographic image, based on its intensity properties, the direct gray-level transformation with Equation (1) is not enough because of the different patients, types of x-ray radiographic equipment, and imaging conditions, and the chest radiographic results are distinct from each other. Therefore, the ideal effect cannot be achieved automatically only with the linear gray-level transformation. It is necessary to normalize the gray-level distribution of the image. The histogram equalization processing gives an approach to force the image histogram to become uniform. To make the linear transformation of Equation (1) suitable to various chest radiographic images, we may first obtain the image of uniform histogram by means of the histogram equalization, which is a basis for performing the linear transformation in the next step.
The histogram equalization is expressed by
 |
2 |
where sk is the kth gray-level value of the image f (x,y), nk is the pixel number possessing the kth gray-level value, n is the total pixel number of the image, and L is the total gray-level number.
The equalized image can be obtained using the following expression
 |
3 |
In a word, the approach of the automatic enhancement for chest radiograph is shown in Figure 3, in which the piecewise linear transformation indicates Equation (1).
Fig 3.

Approach of automatic enhancement for chest radiograph.
Results and Discussions
The results of the enhanced chest radiographic images by means of the presented approach are shown in Figures 4 and 5. All of the applied parameters in Equation (1) are listed in Table 1.
Fig 4.
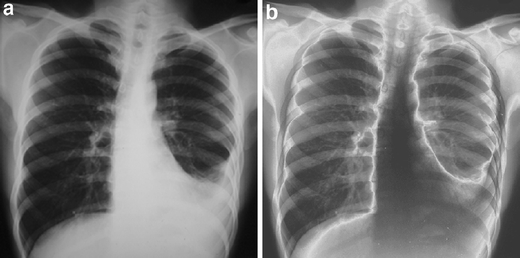
(a) Original normal chest radiographic image. (b) Processed image.
Fig 5.

(a) Original SARS radiographic image. (b) Processed image.
Table 1.
Parameters applied in equation (1) for processing chest radiographic images
 |
 |
 |
 |
 |
 |
 |
 |
|---|---|---|---|---|---|---|---|
| 0 | 115 | 153 | 255 | 52 | 150 | 225 | 60 |
The values of  are collected through the judgment of the radiologists by the visualization effect after processing typical chest radiographs, so they may be applicable for most of the chest radiographs.
It is shown that three subregions are improved completely in Figures 4(b) and 5(b) by comparing with their original images, where there is an appearance of negative effect in subregion II because the output of C4 is less than that of C3. It is easier to identify the pathological features of the small gobbet of the lung for the SARS patient in Figure 5(b).
The normal and the SARS radiographic images are divided approximately in accordance with Figure 1, as shown in Figures 6 and 7, respectively. To measure the enhanced effect, we may calculate the standard deviation of every subregion image by use of the division of Figures 6 and 7. The larger the standard deviation is, the more distinguishable the image structures are. Three subregion images are evaluated with their standard deviations, as shown in Table 2. The average enhanced ratio of three subregions of the normal and SARS images is increased by 10.70% and 25.55%, respectively. Thus, the processed images are obviously superior to the original ones.
Fig 6.
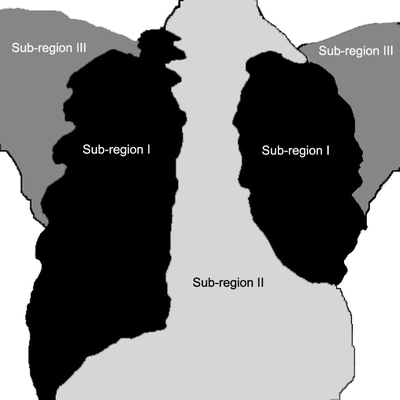
Subregion division of normal chest radiographic image.
Fig 7.
Subregion division of SARS chest radiographic image.
Table 2.
Three subregion standard deviations and enhanced ratios of normal and SARS chest radiographic image
| Subregion number | Normal | SARS | ||||
|---|---|---|---|---|---|---|
| Original image | Enhanced image | Enhanced ratio(%) | Original image | Enhanced image | Enhanced ratio(%) | |
| I | 8.80 | 9.47 | 7.61 | 9.37 | 10.60 | 13.13 |
| II | 10.02 | 10.43 | 4.09 | 6.58 | 9.81 | 49.09 |
| III | 9.27 | 11.16 | 20.39 | 9.35 | 10.70 | 14.44 |
| Average value | 9.36 | 10.35 | 10.70 | 8.43 | 10.37 | 25.55 |
Conclusions
Aiming at the automatic enhancement for the chest radiograph, the piecewise linear transformation model is established by dividing the image into three subregions, based on its gray-level properties. The histogram equalization is essential in attaining a normalization of the image before performing the piecewise linear transformation. The methodology of the automatic enhancement is proved to be effective through the evaluation of the improved images in the application of normal and SARS radiographic images. It provides an approach for the automatic enhancement and recognition of chest radiograph in the clinic.
References
- 1.Polesel A, Ramponi G, Mathews VJ. Image enhancement via adaptive unsharp masking. IEEE Trans Image Process. 2000;9:505–510. doi: 10.1109/83.826787. [DOI] [PubMed] [Google Scholar]
- 2.Cheng HD, Xu H. A novel fuzzy logic approach to contrast enhancement. Pattern Recogn. 2000;33:809–819. doi: 10.1016/S0031-3203(99)00096-5. [DOI] [Google Scholar]
- 3.Shimada T, Kodama N, Satoh H, Ishida T, Teru K, Iwasaka K, Tanaka H, Nishimura Y, Fukumoto I. Automated nodule-enhancement system for plain chest radiographs using a nodule-elimination filter. Med Imaging Technol. 2003;21(1):59–67. [Google Scholar]
- 4.Chen Z, Lin G, Zhang F, Jiang D, Ni L, Wang H. New method of enhancement of x-ray digital image about chest. Acta Photonica Sin. 2002;31(8):1020–1023. [Google Scholar]
- 5.McNitt-Gray M, Taira R, Eldredge S, Razavi M. Brightness and contract adjustments for different tissue densities in digital chest radiographs. Proc SPIE. 1991;1445:468–478. [Google Scholar]
- 6.Zong T, Lin H, Kao T. Adaptive local contrast enhancement method for medical images displayed on a video monitor. Med Eng Phys. 2000;22:79–87. doi: 10.1016/S1350-4533(00)00014-X. [DOI] [PubMed] [Google Scholar]
- 7.Sherrier RH, Johnson GA. Regionally adaptive histogram equalization of the chest. IEEE Trans Med Imag. 1987;MI-6:1–7. doi: 10.1109/TMI.1987.4307791. [DOI] [PubMed] [Google Scholar]
- 8.Stark JA. Adaptive contrast enhancement using generalization of histogram equalization. IEEE Trans Image Process. 2000;9(5):889–906. doi: 10.1109/83.841534. [DOI] [PubMed] [Google Scholar]
- 9.Pizer S, Amburn E, Austin J, Cromartie R, Geselowitz A, Greer T, Romeny BTH, Zimmerman J, Zuiderveld K. Adaptive histogram equalization and its variations. Comput Vis Graph Image Process. 1987;39:355–368. [Google Scholar]
- 10.Rehm K, Seeley G, Dallas W, Ovit R, Seeger J. Design and testing of artifact-suppressed adaptive histogram equalization: a contrast enhancement technique for display of digital chest radiographs. J Thorac Imaging. 1990;5(1):85–91. doi: 10.1097/00005382-199001000-00013. [DOI] [PubMed] [Google Scholar]
- 11.Rehm Kelly, Dallas William J.: Artifact suppression in digital chest radiographs enhanced with adaptive histogram equalization, Proc SPIE Medical Imaging III Conference, Newport Beach, CA 1092, pp. 290–300, 1989
- 12.Matozaki T. Image enhancement of chest radiography using wavelet transform. Trans Inst Electron Inf Commun Eng D-II. 2000;J83D-II(1):408–414. [Google Scholar]
- 13.Keserci B, Yoshida H. Computerized detection of pulmonary nodules in chest radiographs based on morphological features and wavelet snake model. Med Image Anal. 2002;6(4):431–447. doi: 10.1016/S1361-8415(02)00064-6. [DOI] [PubMed] [Google Scholar]


