Abstract
This paper focuses on the application of two image enhancement techniques for the picture archiving and communications systems imaging diagnostic workstation applied to computed radiography (CR) and digital radiography images. The first method is a contrast enhancement technique based on a class of nonlinear intensity transformations described by analytic transfer functions derived from Hurter and Driffield characteristic curves. The second method employs antialiasing techniques preventing the formation of Moiré patterns on subsampled CR images containing antiscatter grid lines, designed to achieve a good balance between artifact suppression and resolution degradation. These techniques are likely to become standard features for all high-end medical imaging workstations in the near future, and thus, we are suggesting that more powerful descriptions of these types of processing should be included in the Digital Imaging and Communications in Medicine standard.
Key words: Computed radiography imaging, contrast enhancement, antialiasing, picture archiving and communication systems
Introduction
One essential requirement of any medical imaging software is the optimal display of the image content to support the diagnosis process. For a general-purpose radiology workstation in a picture archiving and communications systems (PACS) environment, optimal image visualization is determined by many factors, such as acquisition parameters, device connectivity, hardware specificity, diagnostic workflow, and most importantly, the extent and quality of its image-processing and visualization techniques. In addition, the computational performance, interactivity, and usability of these techniques are essential for their widespread acceptance in radiology settings.
Dedicated and proprietary image-processing techniques are commonly used at the imaging device software level. Unlike these dedicated techniques, which may be tightly bound to the physics of the data generation and acquisition processes, a general-purpose radiology workstation is constrained to use image-processing algorithms that preserve as much as possible the original Digital Imaging and Communications in Medicine (DICOM) image data.
Therefore, the PACS workstation software is restricted to the refinement of the DICOM-defined image-processing operations: the intensity transformation and the resize transformation. Moreover, the workstation should be able to enhance images across modalities and across modality vendors, without any knowledge about the type and extent of processing already applied on the incoming images. In this context, our approach focuses on the design of flexible intensity and resize transformations, able to maintain the original image content, to attenuate acquisition artifacts, and to assist in a quality diagnosis.
At the intensity transformation level, we designed a powerful framework for defining analytic function descriptions, able to easily express a priori knowledge about the images to be visualized. We describe in this paper the application of a class of nonlinear intensity transformations derived from Hurter and Driffield characteristic curves, for the contrast enhancement of computed radiography (CR) and digital radiography (DR) images, well suited for different procedure types including chest, abdomen, and extremities examinations.
The image resize transformation may be considered one of the key advantages of the digital-imaging-based diagnosis when compared to the film-based diagnosis. It provides the radiologists the ability to examine the images at a desired detail level by performing simple interactive scaling operations. The transition from film to digital imaging has, however, its disadvantages. Undersampling of the original image to fit on a diagnostic workstation viewport may create visualization artifacts (Moiré patterns) because of the existence of high-frequency characteristic structures (e.g., produced by the antiscatter CR grid). These artifacts appear as ghost lines with their thickness and direction varying with the minification factors. The appearance of such artifacts may severely impede the diagnostic process in some radiology settings. To attenuate this kind of artifact, we designed a number of antialiasing methods suitable for interactive resize operations based on scale-dependent convolution kernels. The kernels are synthesized based on the minification factor and allow maintaining an acceptable balance between the original image values and the degree of artifact suppression.
Methods
Contrast Enhancement
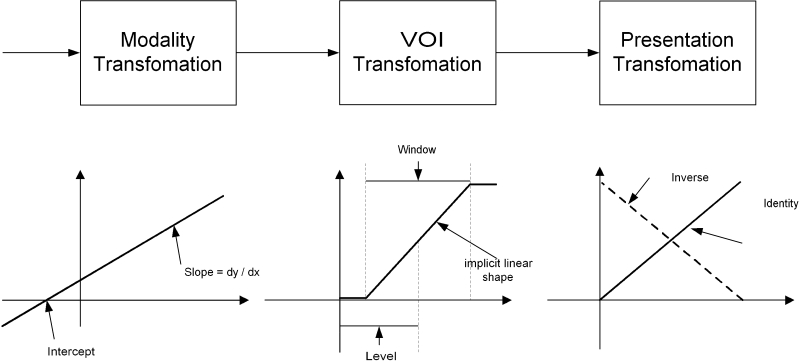
There are three intensity transformations described in the DICOM standard for monochrome images (Fig 1): the modality transformation, the value of interest (VOI) transformation, and the presentation transformation. These transformations are not mandatory, but when their descriptions are provided in the DICOM header of the image, they should be applied successively on the same image. The modality transformation is associated with a specific acquisition device of a given modality, and it is provided as a way to convert the raw device-dependent intensity values to physically meaningful values shared among modalities (e.g., Hounsfield units or optical density units). The VOI transformations describe a range of intensities of interest used to outline different anatomical structures/properties in the image. The presentation transformations are associated with a particular output (rendering) device and are used to adjust the image intensity values so that thesame image is perceived similarly on all rendering devices.
Fig 1.
DICOM intensity transformations.
These transformations may be linear or nonlinear. When they are linear, the intensity mappings are described implicitly by conveying only the relevant parameters of the mapping (slope and intercept for modality transformation, window and level for VOI transformation). When they are nonlinear, the intensity mappings are explicitly conveyed in the lookup table (LUT) data provided in the DICOM header or in the DICOM presentation associated with the image.
The intensity transformation chain employed by a PACS workstation needs to handle the above DICOM descriptions and, more importantly, needs to compensate for the missing parts of the DICOM intensity transformation chain. VOI transformations should be often estimated, generated, and modified interactively depending on the type of examination. Presentation transformation could compensate the use of non-DICOM-compliant rendering devices, or it could be used to compensate the differences between acquisition devices from different vendors. For these reasons, we designed a framework for the PACS workstation that allows the construction and interactive modification of LUTs based on analytic descriptors of arbitrary nonlinear transfer functions. In the remainder of this section, we describe the use of this framework in improving the quality of the contrast of CR images.
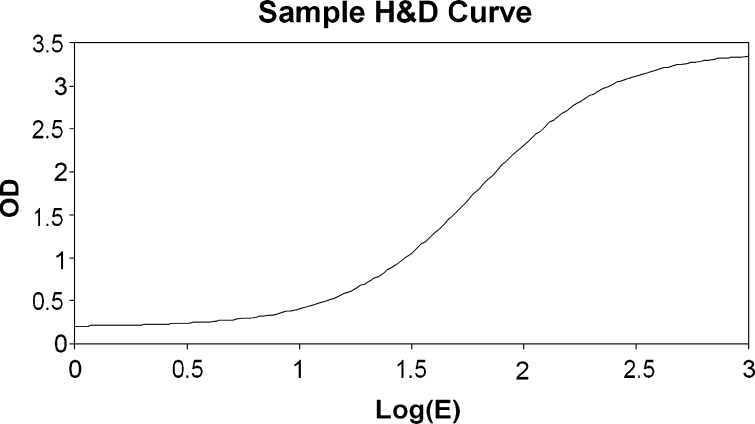
The intensity transformation is particularly important for projective modalities, such as CR, where image pixel values are tightly related to the underlying physical process of x-ray propagation, which, in turn, relies on photographic media processing. Hurter and Driffield1 were the first to study the relation between the light exposure and the optical density during the photographic process. The so-called H&D curve links the logarithm of the relative exposure log10(E) and the optical density D, and it is widely used to describe the characteristics of every photographic media. Their findings form the basis of sensitometry as a photographic science and evolved together with the technology of film processing.
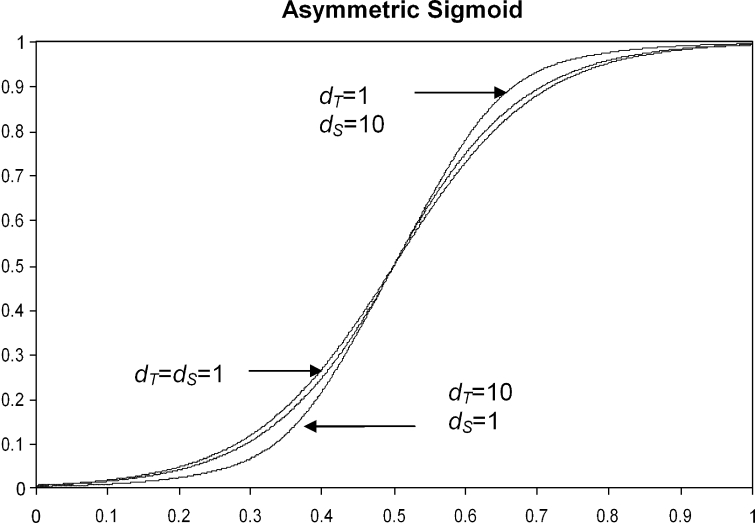
The H&D curve contains three regions (Fig 2): (1) the low-exposure region, where the optical density is approximately constant (the fog region); (2) the linear region, where the optical density is proportional to log10(E) (the active region); and (3) the high-exposure region, where the optical density reaches its upper bound (the saturation region). Many CR acquisition parameters may affect the shape of the H&D curve in each of these regions.2 A PACS workstation should be able to provide the user with a simple, flexible, yet powerful way of modifying and correcting the acquired intensity values. For this purpose, we designed an intensity transformation T(x) based on a linear combination of two asymmetric sigmoid transition functions (Fig 3) of the form:
 |
where xc is the center of the interval of values of x, c defines the overall curvature of the sigmoid, dT controls the inferior (toe) curvature, and dS controls the superior (shoulder) curvature of the asymmetric sigmoid. The above formulation allows an almost independent control of the “toe” and “shoulder” parts of the asymmetric sigmoid and thus provides the needed flexibility in modeling various H&D curves. We assessed the effectiveness of this contrast enhancement technique by using 5- and 3-megapixel grayscale monitors calibrated according to the DICOM Grayscale Standard Display Function. Qualified subjects established the parameters of the H&D curves for various exam types and acquisition devices.
Fig 2.
H&D sample curve: optical density versus logarithm of the exposure.
Fig 3.
Normalized asymmetric sigmoid shape; dT and dS control the curvature of the “toe” and “shoulder” parts.
Antialiasing
Image resampling has been a well-established field of image processing for over three decades. Classic in-depth studies and monographs of the various parts of the resampling process were available since the early 1990s.3,4 From the medical imaging perspective, the problems are still of utmost interest, especially for reconstructive modalities.5
Image resampling transforms a digital image from one coordinate system to another. The two coordinate systems are related to each other by a spatial transformation—the warping—expressed through a mapping function between the input and the output sampling grids. To obtain the output image, the inverse mapping function is applied to the output sampling grid, projecting it onto the input. Because the back-projected pixel positions do not coincide with the input pixel positions, the matching between the grids is achieved by converting the discrete input image samples into a continuous surface, i.e., by image reconstruction. After reconstruction and warping, image resampling needs two additional steps: the prefiltering of the warped image and the final sampling onto the output grid (Fig 4). The input image f(u), defined over the two-dimensional integer input grid, is reconstructed into fc(u) through convolution with the reconstruction filter r(u). The continuous input fc(u) is then warped according to mapping function x = m(u). The spatial transformation produces gc(x), the continuous warped output. Depending on the inverse of the mapping function u = m−1(x), gc(x) may have arbitrarily high frequencies, which could cause aliasing effects. Therefore, it needs to be band-limited by convolution with the low-pass filter h(x) to conform to the Nyquist rate of the output. The band-limited result g′(x) is then sampled by s(x), defined over the output sampling grid, to produce the discrete output g(x).
Fig 4.
The stages of the general resampling process.
This general processing chain could be simplified when m is invertible, and it can be expressed in terms of the Jacobian of the input–output mapping as m(u) = uJ (Appendix A). In these common cases (like resizing and rotation), the reconstruction and the prefilter convolution operations can be merged and then expressed either in input or in output image spaces6 (Fig 5). In the input space formulation, the prefilter must be warped through m−1. In the output space formulation, the reconstruction filter must be warped through m.
Fig 5.
The stages of the resampling process for resize transformations.
In the minification case, the ideal prefilter in input image space would be obtained by band-limiting the spectrum of the input image at the Nyquist frequency given by the minification factor to avoid the aliasing of the high frequencies of the output image spectrum. As the input is increasingly decimated when the minification factor is decreased, the prefilter must become broader and shorter. It becomes broader to average more neighboring pixels together, thereby further band-limiting the input. Because larger neighborhoods are used to compute each output pixel, the normalized weights applied to the input decrease to reflect the diminishing impact of each input sample. As a result, the prefilter grows shorter.
On the other hand, we would ideally like to use narrow filters in the spatial domain because this allows fewer computations and minimizes the spatial resolution loss induced by their low-pass characteristics. However, the reciprocal relationship between the spatial and frequency domains tells us that narrow fxilters in the spatial domain correspond to wide frequency spectrums. Thus, the trade-off between narrow filters in the spatial domain and good filter response in the frequency domain is at the heart of prefilter design.
The simplest prefiltering methods employed in practice are pure decimation (the impulse filter) and averaging (the box filter). Decimation (nearest neighbor) does not band-limit the frequency spectrum of the input image in view of minification, but it can be used successfully when the input image does not contain a significant amount of high frequencies. On the other hand, pure averaging has good antialiasing capabilities, but tends to reduce the spatial resolution through oversmoothing.
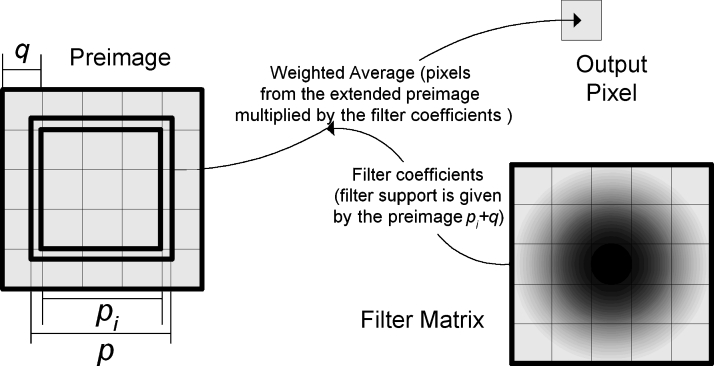
We analyzed several classes of prefilters (Table 1) and their antialiasing abilities in the context of preserving the optimal amount of spatial information from the input image. The support of these filters (the preimage) is given by the reciprocal of the minification factor p = 1/a, and it is rounded to the nearest integer pi to give the area from the input image participating in the formation of one output pixel (Fig 6). The preimage extension q controls the extent the preimage support should be modified to encompass more or fewer pixels. A positive value of q will widen the filter support, and a negative value will narrow it. We usually choose q = 1 to compensate the truncation of p to the nearest integer pi. The filter weights w(x, y) are computed depending on the preimage dimensions and then normalized to achieve unity filter gain.
Table 1.
Antialiasing Filters; (x, y) = (0,0) Corresponds to the Center of the Preimage Defined by q and pi
| Name | Filter Weights |
|---|---|
| Trapezoidal |  |
| Pyramid |  |
| Gaussian |  |
Fig 6.
Preimage parameters and the antialiasing filter kernel support.
We evaluated the effect of the antialiasing filters on CR images exposing antiscatter grid artifacts, mainly chest CR images acquired by portable x-ray units. The filtered images were visualized on 3-megapixel grayscale monitors and subjectively evaluated to design the filters as narrow as possible and still obtain an acceptable degree of aliasing suppression (total suppression for more than 80% of the useful minification range). We assessed the amount of change induced by the filtering operations using objective measures, and then we used line-pair phantom images for subjective evaluation of the spatial resolution degradation.
We used frequency domain filtering as the reference and computed the root mean square error and the standard deviation between the reference images and the images obtained through convolution with the scale-dependent filters for the useful range of minification factors. We also compared the scale-dependent antialiasing methods with classic preconditioning of the images through filtering using an invariant fixed support kernel applied as a preprocessing step on the original image. This filter (a light 3 × 3 Gaussian, with the normalized coefficients 0.14, 0.38, and 0.14) was designed to attenuate the Moiré effects for almost all the minification scales of interest to the same extent as the other methods. The minification method in this case was the decimation.
Results
Contrast Enhancement
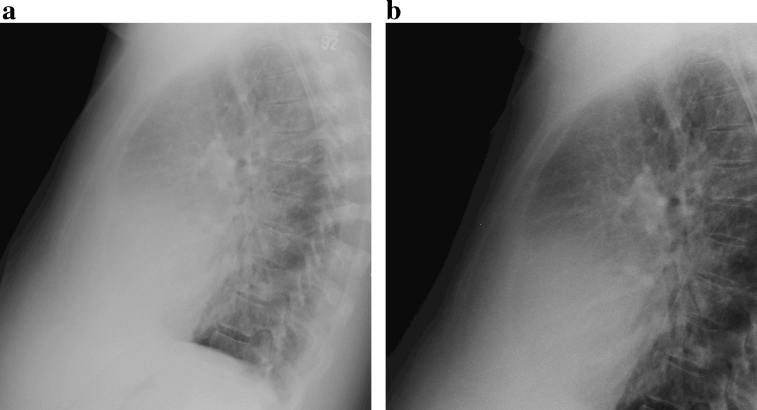
The proposed contrast enhancement technique was assessed in clinical environment for the most used exam types (chest, abdomen, and extremities) for images acquired by CR and DR units from various vendors. The radiologists were asked to assess the images before and after the application of the enhancement technique. During the evaluation, it was determined that an optimal enhancement could be achieved by using different H&D intensity transformation parameters. We found that these parameters depend significantly on the exam type/patient orientation and especially on the modality vendor.
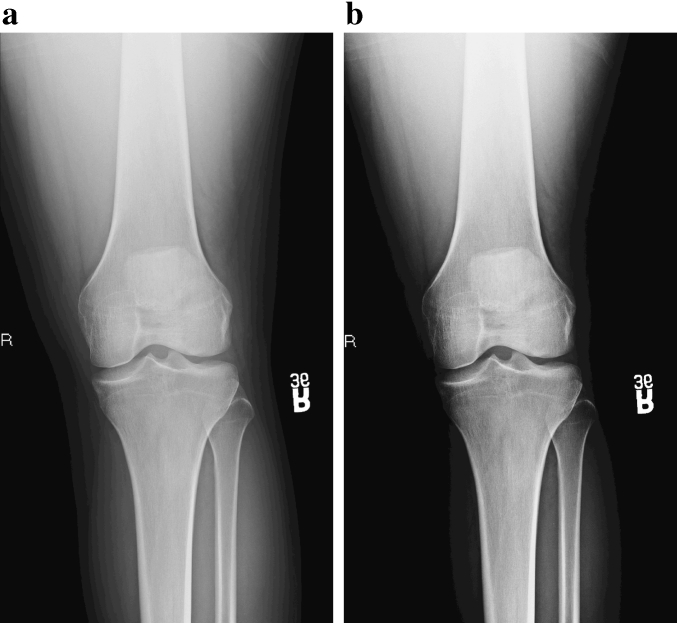
Table 2 shows the set of H&D parameters for a typical CR unit for various exam types. Most of the chest and abdomen exams required H&D curves with lower curvatures, and extremities/bones exams favored high curvature settings. The sets of parameters for the same exam type for different CR units are similar when compared on a relative scale, but very dissimilar on an absolute scale. This is because of specific unit configuration and postprocessing applied after acquisition at the unit level. Figures 7 and 8 illustrate typical enhancement achieved through H&D intensity transformation for a chest (PA) and a knee (AP) exam by using the parameters from Table 2.
Table 2.
H&D Transformation Parameters for a Typical CR Unit
| Exam Type | H&D Intensity Transformation Parameters | ||
|---|---|---|---|
| Gain (c) | Toe Curvature (dT) | Shoulder Curvature (dS) | |
| Abdomen (KUB) | 0.10 | 0.3 | 1.0 |
| Abdomen (UPRIGHT) | 0.20 | 0.9 | 1.3 |
| Chest (PA) | 0.10 | 0.2 | 0.5 |
| Chest (AP) | 0.10 | 0.5 | 1.0 |
| CSpine (AP, LL) | 0.20 | 0.9 | 1.3 |
| CSpine (OBL) | 0.25 | 2.0 | 4.0 |
| LSpine (AP) | 0.15 | 0.3 | 2.0 |
| LSpine (LAT, OBL) | 0.15 | 0.3 | 2.0 |
| Elbow (LL) | 0.10 | 0.5 | 1.0 |
| Extremity (AP, PA) | 0.20 | 0.9 | 1.3 |
| Foot (AP) | 0.20 | 0.9 | 1.3 |
| Foot (LL) | 0.25 | 1.5 | 5.0 |
| Knee (AP, OBL) | 0.10 | 0.5 | 1.0 |
Fig 7.
H&D intensity transformation for chest exams: (a) linear intensity transformation in the range [0, 4096); (b) H&D intensity transformation in the same range with c = 0.1, dT = 0.2, and dS = 0.5.
Fig 8.
H&D intensity transformation for knee exam: (a) linear intensity transformation in the range [0, 4096); (b) H&D intensity transformation in the same range with c = 0.1, dT = 0.5, and dS = 1.
Although there are many modalities already applying the H&D-like VOI transformation to enhance the image quality in view of a better diagnostic, our approach proved to be very flexible and thus convenient to use in radiology settings. The main benefit of the proposed approach is to allow the full customization of the H&D curve by taking into account the characteristics of the CR unit, the exam types, and the radiologist preferences.
Antialiasing
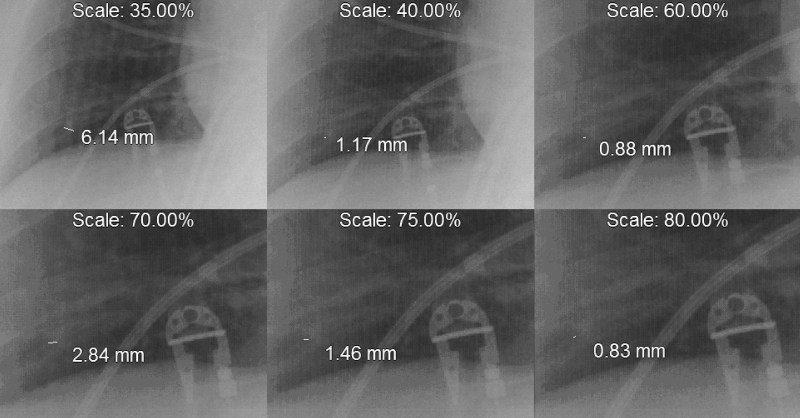
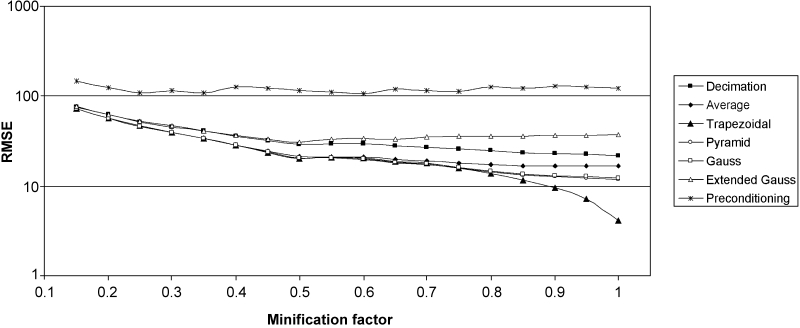
Typical results obtained for a representative CR image containing grid artifacts (Fig 9) are given in Figure 10. The results show that the scale-dependent filtered images are closer to the optimal images than the preconditioned images. The differences between the optimal and the filtered images are not significant when the filters are designed as narrow as possible yet attenuating the Moiré patterns almost everywhere. Even when the preimage is extended significantly (q = 2 for the extended Gaussian in Figure 10), the local resolution loss is still close to the one obtained when decimation is used (but no artifact is suppressed).
Fig 9.
Image showing ghost lines due to aliasing at different minification scales.
Fig 10.
Quantitative comparison of the filtering methods. Optimal filtered images are used as references (root mean square error as a function of the minification factor for each resampling method).
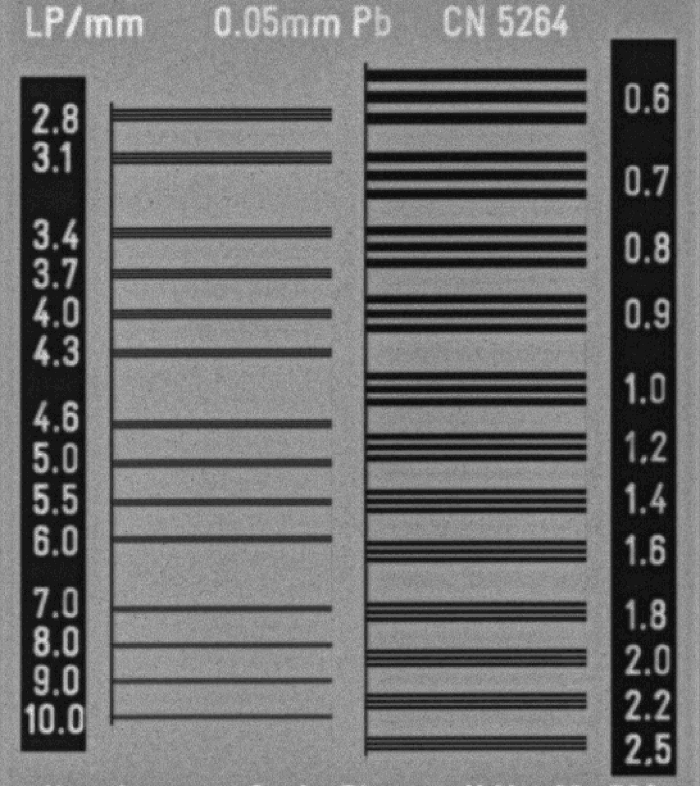
These results allowed us to refine further the comparison between these methods by assessing the perceived resolution losses. We noticed that the differences between the optimal and the scale-dependent filtered images are more significant in the regions with sharper transitions in the original image (Fig 11). To assess the behavior of these methods in the neighborhood of high gradient regions, the same filters were applied on a standard line-pair phantom image (Fig 12) obtained from the same modality.
Fig 11.
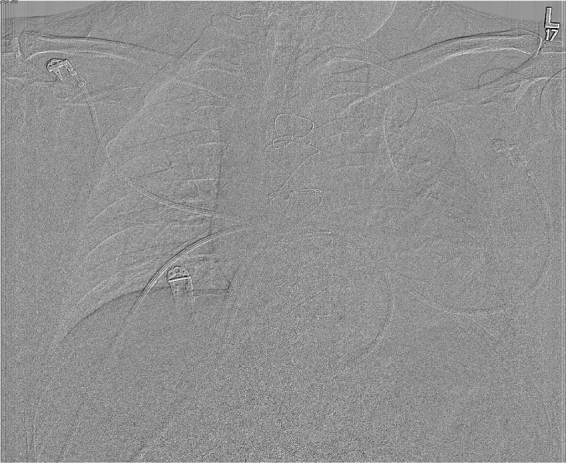
Difference between the optimal and Gaussian (g = 0 and q = 2) filtered images, outlining the resolution degradation on the high gradient regions.
Fig 12.
CR line-pair phantom image.
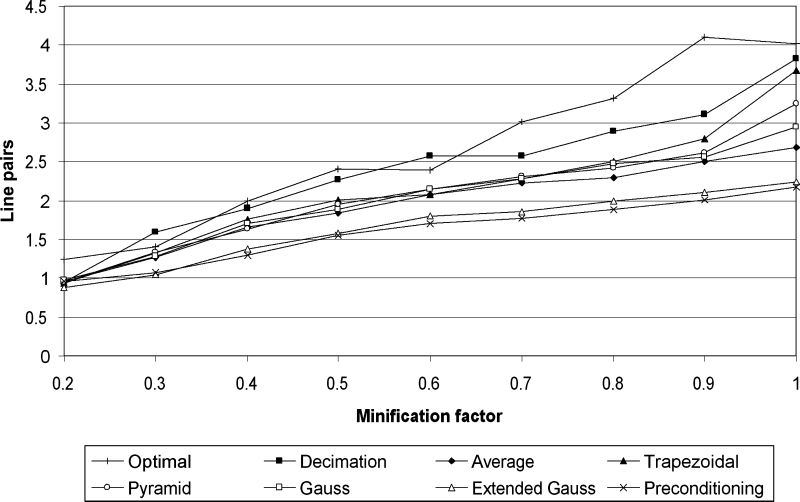
Ten subjects with various degrees of training in image-processing analysis (none of them radiologists) were asked to record the maximum perceived resolution for each method on the same range of minification factors of interest. They recorded the last discernable line-pair phantom or each minification factor for all the prefiltering methods. The averaged results (Fig 13) show that the optimal filtering is the best suited in preserving the spatial resolution (as expected), followed by decimation. The trapezoidal, pyramidal, and Gaussian antialiasing filters performed better than simple averaging. Preconditioning with a light Gaussian filter is the worst in preserving the spatial resolution, and it is similar to antialiasing using a Gaussian on a wider preimage extension (q = 2). Consequently, the proposed scale-dependent antialiasing filters designed to reject most of the aliasing effects do not significantly degrade the spatial resolution of the images. However, once we employ wider filters (such as the extended Gaussian) or scale-invariant filters (such as the preconditioning filter), the spatial resolution of the resulting images starts to degrade significantly.
Fig 13.
Perceived spatial resolution for each reconstruction method (discernable line pairs per millimeter versus the minification factor); averages for 10 observers on CR line-pair phantom image.
Discussion
Although the modalities generating the images and the PACS workstations receiving them are able to perform advanced image-processing tasks, they are not yet able to interchange and thus interpret essential information related to the characteristics of the medical images that would help high-quality visualization in view of better diagnosis.
In the case of the intensity transformations, the DICOM definitions of the nonlinear VOI LUTs are bound to the data given by values as provided by the modality, and thus, even when the modality is generating complex nonlinear transfer functions, the PACS workstation user is not able to modify their relevant parameters. Instead, the original VOI LUT is discarded, and an analytic function description, such as the H&D curve described above, needs to be used to achieve and fine-tune a quality contrast. By using analytic descriptors of the transfer functions as an alternate DICOM definition and by transmitting only the relevant parameters of these functions, the modality would be able to provide enriched image information, and the PACS workstation workflow and overall user experience would be greatly improved.
In the case of the resize transformations, the modality is the best positioned to know about the frequency characteristics of every class of images that are generated because it has the knowledge about the entire specific physics of the acquisition devices and processes. Many modality workstations already apply antialiasing filters when displaying acquired images, but the information about these filters is lost when the image is exposed to the PACS workstation. In the current site setting, the workstation itself provides the resampling filters on-demand, after the aliasing has occurred and the issue has impeded the diagnosis process and has been finally signaled as an image quality problem. To avoid this kind of workflow interruption, the modality could provide an enhanced DICOM descriptor to send the antialiasing filter in analytic form as a function of the minification factor. The PACS workstation would be able to interpret, realize, and apply these filters as described in the previous sections. In this way, the communication between modalities and PACS would be enhanced to achieve an automated high-quality resampling process without impeding the diagnosis.
Conclusions
The results of both image enhancement techniques were very encouraging. The application of the nonlinear LUTs demonstrated a significant improvement in the contrast enhancement of CR chest and extremity studies. In addition, we observed that the proposed antialiasing techniques are able to maintain an optimal balance between the artifact removal and spatial resolution loss.
We believe that the above image enhancement techniques will become standard features for all high-end medical imaging workstations in the near future, and thus, we are suggesting that more powerful descriptions of these types of processing should be included in the DICOM standard.
Acknowledgments
The authors would like to gratefully acknowledge many fruitful discussions with Mark Ruthmeyer on contrast enhancement techniques. The other members of the radiology departments of St. Luke's Episcopal Hospital, Texas Medical Center, and our colleagues from MIG are also acknowledged for their valuable support.
Appendix A
Prefilter Design for Affine Warping
The reconstructed output g(x) in Figure 4 can be expressed in the general form as:
 |
where
 |
is the resampling filter that specifies the weight of the input sample at location k for an output sample at location x as an output space integral. In the input space, the resampling filter is given by:
 |
where ∣J∣ is the determinant of the Jacobian of the mapping function m(u).
When the warping is an affine transformation, the Jacobian matrix is constant, and the resampling filter can be expressed as a convolution between the reconstruction filter and the warped prefilter as follows:
 |
The entire resampling process can then be reduced to a single convolution:
 |
In the case of magnification, one could ignore the prefilter h because no high frequencies are introduced into the output upon magnification. On the other hand, minification introduces high frequencies but does not require any reconstruction of the input image because the input grid covers the output grid everywhere. Consequently, in this case, we can ignore the reconstruction filter r.
It is noticeable here that the reconstruction filter expressed in the input image space is invariant with respect to the parameters of the magnification transformation. In the frequency domain, this is reflected in the fact that the frequency spectrum of the magnified image does not contain frequency components higher than the input image.
In the case of minification, the output image is a subsampled version of the input image, and thus its frequency spectrum may contain higher frequencies. This is evident in the above equations by the dependency of the resampling filter on the inverse warp mapping, namely, that the Jacobian of the warp mapping is proportional to the minification factor.
References
- 1.Hurter F, Driffield V: Photochemical Investigations and a new method of determination of the sensitiveness of photographic plates. J Soc Chem Ind 1890
- 2.Tingberg A, Herrmann C, Lanhede B, Almen A, Sandborg M, McVey G, Mattsson S, Panzer W, Besjakov J, Mansson LG, Kheddache S, Carlsson G, Dance DR, Tylen U, Zankl M. Influence of the characteristic curve on the clinical image quality of lumbar spine and chest radiographs. Br J Radiol. 2004;77:204–215. doi: 10.1259/bjr/22642890. [DOI] [PubMed] [Google Scholar]
- 3.Wolberg G. Digital Image Warping. Los Alamitos, CA: IEEE Computer Society Press; 1990. [Google Scholar]
- 4.Dodgson N: Image Resampling, PhD Thesis, Computer Laboratory, University of Cambridge, UK, Technical Report CR 26, 1992
- 5.Natteter F, Wubbeling F, editors. Mathematical Methods in Image Reconstruction. Philadelphia, PA: SIAM; 2001. [Google Scholar]
- 6.Heckbert P: Fundamentals of Texture Mapping and Image Warping, Chapter 3: Resampling Filters, Masters Thesis, Dept. of EECS, University of California at Berkeley, Technical Report UCB/CSD 89/516, 1989


