Abstract
This study was undertaken to investigate a useful image blurring index. This work is based on our previously developed method, the Moran peak ratio. Medical images are often deteriorated by noise or blurring. Image processing techniques are used to eliminate these two factors. The denoising process may improve image visibility with a trade-off of edge blurring and may introduce undesirable effects in an image. These effects also exist in images reconstructed using the lossy image compression technique. Blurring and degradation in image quality increases with an increase in the lossy image compression ratio. Objective image quality metrics [e.g., normalized mean square error (NMSE)] currently do not provide spatial information about image blurring. In this article, the Moran peak ratio is proposed for quantitative measurement of blurring in medical images. We show that the quantity of image blurring is dependent upon the ratio between the processed peak of Moran's Z histogram and the original image. The peak ratio of Moran's Z histogram can be used to quantify the degree of image blurring. This method produces better results than the standard gray level distribution deviation. The proposed method can also be used to discern blurriness in an image using different image compression algorithms.
Key words: Moran peak ratio, image blurring, image quality
Introduction
Medical images are often deteriorated by noise during the production or reconstruction process. Noise degrades the quality of medical images. Also, blurring is always present in image acquisition, especially in medical image acquisition processes. This stems from the inaccuracies imposed by the nature of scanners or motion blurring from a moving body. Image enhancement is traditionally used to diminish noise and improve image quality, but is often accompanied by undesirable effects. Smoothing filters, such as average or median for spatial domain and low-pass filters for the frequency domain, are used to eliminate noise in the image. However, the trade-off is a blurred edge.1
Reducing the image data volume and increasing the information flow efficiency has been explored in image compression.2 Compression algorithms can be either lossless (reversible) or lossy (irreversible). Lossless compression methods use redundancy within an image to efficiently reduce the image size (bit rates), allowing perfect reconstruction but achieving only 2:1–4:1 reduction for medical images.2,3 To have a substantial practical impact, much higher compression ratios (e.g., 10:1 or higher) are desirable. Higher degrees of compression are only possible using lossy, or irreversible, compression techniques. Unfortunately, this compression method is obtained at the expense of image degradation, i.e., the image quality declines as the compression ratio is increased.4,5 The first effect of lossy image compression is the removal of uncorrelated high-frequency noise. In the regions of medium and high, blurriness increases with image compression ratio.6,7
Generally, two categories of methods have been used to evaluate image quality: (1) the pixel value numerical analysis before and after compression, i.e., the mean square error (MSE), or the normalized root mean square error (NMSE); and (2) subjective observer evaluation, i.e., receiver operating characteristic (ROC).4,8,9 However, both MSE and NMSE do not correlate well with image quality measurements and ROC studies are time-consuming.2,4 Burgul et al.9 found that NMSE was most sensitive to degradation, but completely ignored all of the spatial information. Wong et al.4 suggested that NMSE does not provide any information regarding the loss of spatial location or spatial frequency. Because of the inherent drawbacks associated with the above methods, there has been an interest in developing a quantitative image quality measurement method. The Moran statistics were originally introduced by Chuang and Huang10 to estimate the noise level in medical images. This statistic is a function of the spatial autocorrelation of mapped data.11 A higher Moran Z value (higher spatial autocorrelation) means that there is a greater correlation between the pixels and that the image is smoother.10
Recently, a Q index was suggested by Wang and Bovic12 for image quality estimation. This index estimated image quality based on local regions instead of from pixels with an 8 × 8 window size, as indicated by their study. Their article also introduced that concept that the human visual system is to extract structural information, i.e., a local region, from the viewing field. This is done so a measurement of structural information can provide a good approximation to perceived image distortion.13 Recently, the Moran statistics was applied to measure structure information of images from a local region, as suggested by Chen et al.13–15 Blurred regions in an image may increase the number of high Z values. A peak in the high Z value area will be produced if we estimate every local region Z value in an image and show frequency data in a histogram. The peak height in the histogram represents how many smoother areas there are in an image. The ratio of peak heights in the histograms between the manipulated and original images can be used as an index of image quality.14 They showed that the measurement of spatial autocorrelation of Moran statistics is a good index on the structure variation (sharper or smoother) of images. For lossy wavelet image compression, the Moran peak ratio corresponds well to quality degradation of medical images.14
In this work, we use Moran statistics for the quantitative blurring measurement in digital images. In the following, we first introduce the Moran statistics and peak ratio of histograms. This method is then applied to evaluate the degree of blurring in images produced using different filters or two wavelet-based lossy image compression softwares. In the final section, a discussion and conclusions are presented.
Materials and Methods
The Moran Statistics
The Moran statistics is used to evaluate the randomness of mapped data by measuring spatial autocorrelation.11 The Moran parameter measurement J was calculated as:
 |
1 |
where xi is the gray level for pixel i,  is the mean gray level of the window, S0 = 2(2mn − m − n), m and n are the number of rows and columns in the window, N is the total number of pixels in the window, and δij = 1 if pixel i and j are adjacent and 0 otherwise. The numerator and the denominator is a measure of the covariance and of the variance among the pixels, respectively. A larger J value means greater correlation between the pixels and that the image is smoother or blurred. When the size of N is large enough, the variable J approximately follows a normal distribution with the mean and variance given by
 |
2 |
and
 |
3 |
where  , S1 = 2S0, and S2 = 8(8mn − 7m − 7n + 4). We can use the standardized normal statistic
 |
4 |
to determine the blurring of an image.
Z histogram and Peak Ratio
The Moran Z value of each pixel is represented with a centered 9 × 9 window.14 After that, a Z histogram is produced by collecting the Z values from all pixels. This Z histogram had been proven to correspond well to the image variation in spatial properties.14,15 Spatial correlation increases with image blurring and accompanies increase in Z value. This Z value may increase at higher Z value areas to form a peak. We define the peak ratio as the ratio of highest peak values in the Z histograms between the manipulated and original images.14
The Average and Median Filter
Smoothing filters are used for blurring and for noise reduction. For spatial domain operation, the average or median filter is well known and commonly used for image enhancement. These filters can also be easily extended to obtain modified results by increasing the size of the window while maintaining the structure and function of the filters.1
Ideal Low-Pass Filter
An ideal low-pass filter (ILPF) completely filters all frequencies above the cut-off frequency while passing those below unchanged. It can be realized mathematically by multiplying with the rectangular function in the frequency domain. If an image was transformed into the frequency domain using fast Fourier transform (FFT) and centered, a two-dimensional ILPF satisfies the relation.8
 |
5 |
where D0 is a specified nonnegative quantity, and D(u, v) is the distance from point (u, v) to the origin of the frequency plane; that is,
 |
6 |
The B percent that passed in the filtered image can be defined as:
 |
7 |
where PT and P are the power of each point in the frequency domain of original and blurred images, respectively.
High-Boost Filter
A high-pass filtered image can be obtained using the difference between the original image and a low-pass filtered version of that image, i.e.,
 |
8 |
The High-Boost filter modifies the above formula using the original image multiplied by an amplification factor A, i.e.,
 |
9 |
When A = 1, a standard high-pass filter was used. As A > 1, part of the original image has been added back into the high-pass result, which partially restores the low-frequency components lost in the high-pass filtering operation. The image becomes more blurred when A is increased. The mask used for high-boost spatial filtering is shown as below8
 |
where w = 9A − 1, and A > 1.
Lossy Image Compression
Two wavelet compression softwares “ViewMed” (version 1.0.0.228. 2002, which was provided courtesy of the Pegasus Imaging Corporation, http://www.jpg.com/medical) and “JJ2000” (JJ2000 version 4.1, available on the Internet at http://jj2000.epfl.ch) were used in this study to demonstrate the usefulness of the Moran peak ratio in blurring evaluation. The image compression ratio is a measure of the original image size vs. the compressed image size.
Experiments and Results
We randomly chose nine CT images, including five body and four head images, and 10 mammographic images for this study. These CT images were from two serial 3D studies using a GE 9800 scanner with an image size 512 × 512 and 12 bits deep. The mammographic images were digitized from film at a size of 2,048 × 2,048 × 12 bits with an Eikonix 1412 CCD camera. Mammographic images were provided courtesy of the National Expert and Training Centre for Breast Cancer Screening and the Department of Radiology at the University of Nijmegen, the Netherlands. To generate images with various degrees of blurring, four filters (average, median, high-boost, and ideal low pass) with various mask sizes, cut-off frequencies, and amplification factors were employed on nine CT images. Because of the large image size, mammographic images require large storage facilities and long transmission times. Therefore, disk space saving is a requirement of picture archival and communications system (PACS) by the use of image compression technology.16 Two wavelet-based image compression softwares were used to compress these mammographic images at various compression ratios. The Moran test was then applied to all of these processed images to evaluate the image blurring or deblurring. Only the body and head regions of CT images were tested to avoid the areas outside of the patient.
The Average and Median Filters
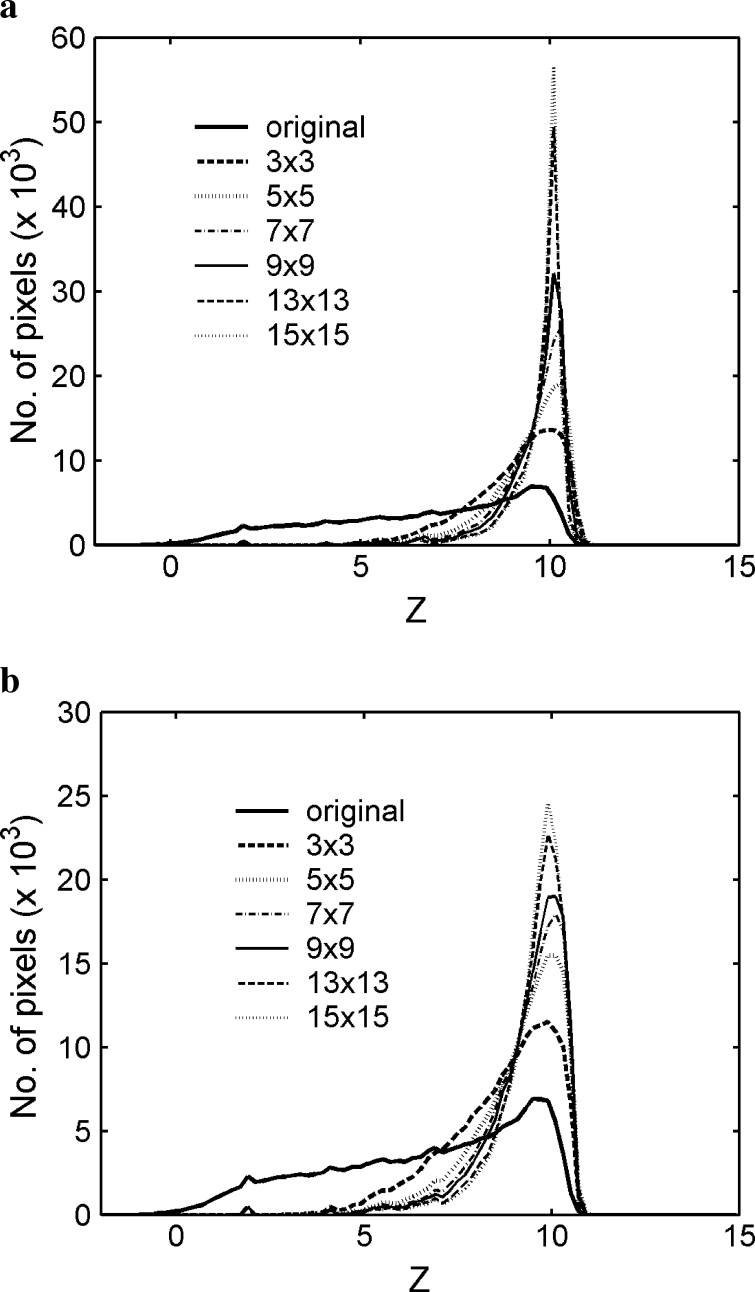
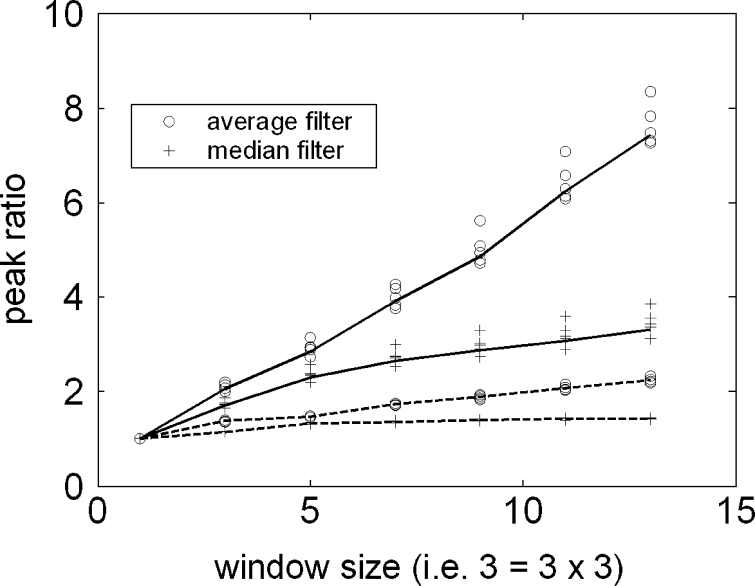
CT body images were filtered using average and median filters with window sizes of 3, 5, 7, 9, 11, and 13 (3 = 3 × 3). The degree of image blurring increased with the increase in window size. The Moran Z histograms for the manipulated and original images are shown in Figure 1(a) for the average filter and Figure 1(b) for the median filter, respectively. The peak heights in both figures increased with the window size. The greatest number of pixels can be normalized to the original image peak corresponding to various windows, as indicated in Figure 2. The number of blurred pixels depends upon the window size. This figure shows that the average filter produced more blurred images than the median filter for equal window sizes. Because the CT head image is less structural than the body, filters had a lesser blurring effect on the images. The CT head and body images were grouped using the peak ratios, as indicated in Figure 2.
Fig. 1.
Z histograms of various masks applied to a CT body image for (a) average filter and (b) median filter.
Fig. 2.
Peak ratios of average and median filters for nine CT images (five body and four head images) as a function of mask sizes ( — = body image, – – = head image).
Ideal Low-Pass Filter
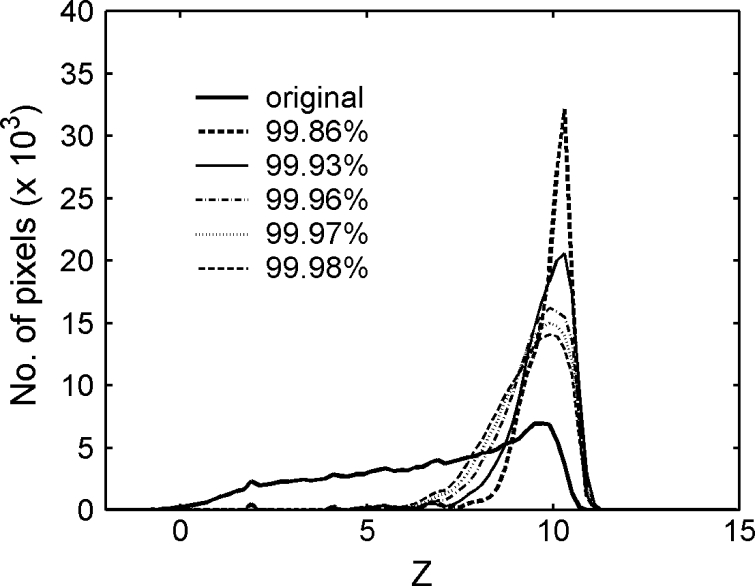
A CT body image was transformed into the frequency domain using FFT and filtered using an ideal low-pass filter (ILPF). We estimated the Z histograms from the blurred and original images as before. The number of pixels within higher Z areas increased with the increase in image blurring, as noted in Figure 3. This figure demonstrates that the Moran test is sensitive to image blurring and the pixels in the lower Z areas are moved into high Z values as the blurring increases. In Figure 3, the high-frequency power of the CT image was cut off at 0.14%.
Fig. 3.
Z histograms of ideal low-pass filter for various power percentages.
High-Boost Filter
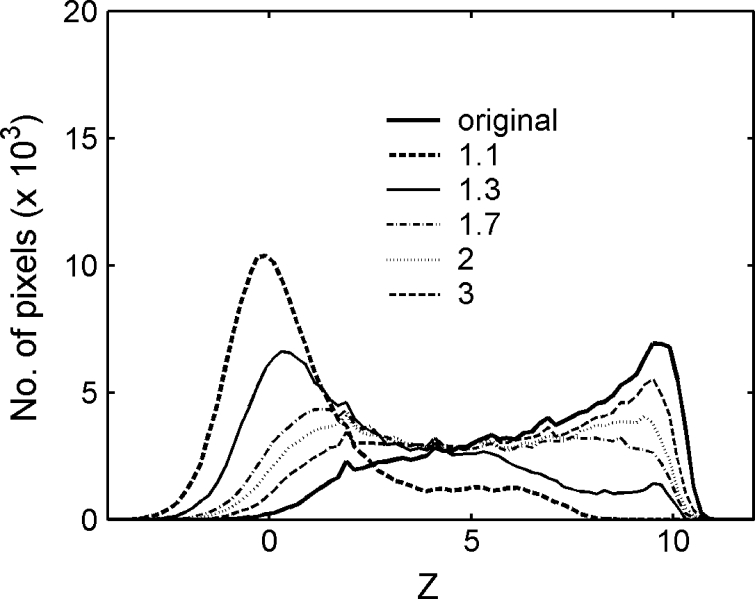
The Moran peak ratio was applied to evaluate the blurring in these filtered CT body images under various A values (A = 1.1, 1.3, 1.7, and 2, 3). As shown in Figure 4, the Z histogram shifted from left to right with increasing A. Smoothness of the filtered image clearly increased with A.
Fig. 4.
Z histograms of high-boost filter of a CT body image under various amplification factors.
Lossy Image Compression
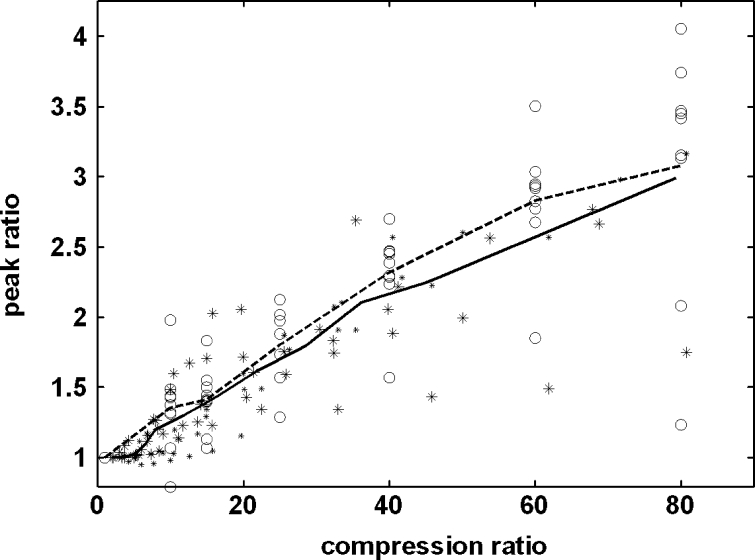
The peak ratio with various compression ratios (up to 80) for two image compression softwares is shown in Figure 5. The peak altitudes increase with increasing compression ratio, indicating that the image is becoming smoother.13 Obviously, the number of blurred pixels increased with an increase in the image compression ratio for both softwares. On average, the peak ratio of the reconstructed image using the “ViewMed” image compression software showed more blurring than JJ2000 for an equal compression ratio, as indicated in this figure. Note that an increasing spatial variation of images is in the region of higher compression ratio. This indicates that there are highly varied effects on images for high compression ratios.
Fig. 5.
The peak ratios of 10 reconstructed mammographic images using two compression software in various compression ratios (—* = JJ2000, – – ○ = ViewMed).
Discussion
The Moran peak ratio demonstrates that an average filter affects image blurring more than a median filter for an equal mask size. The ILPF effect in image blurring was consistent with the filtering percentage. Image blurring and sharpening using high-boost filters was also detected by the Moran statistics. The peak ratios and number of pixels on high Z values depended on the increase in compression ratio. The peak ratio obviously discerned image blurriness affected by different compression algorithms.
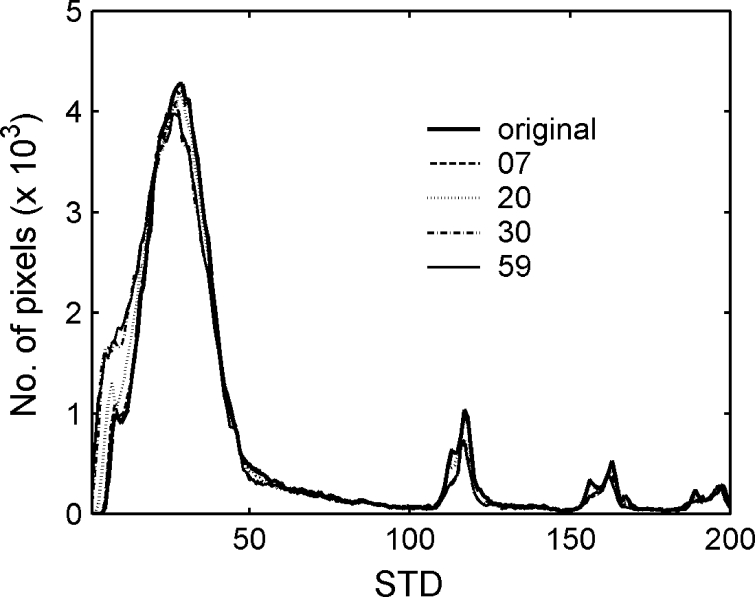
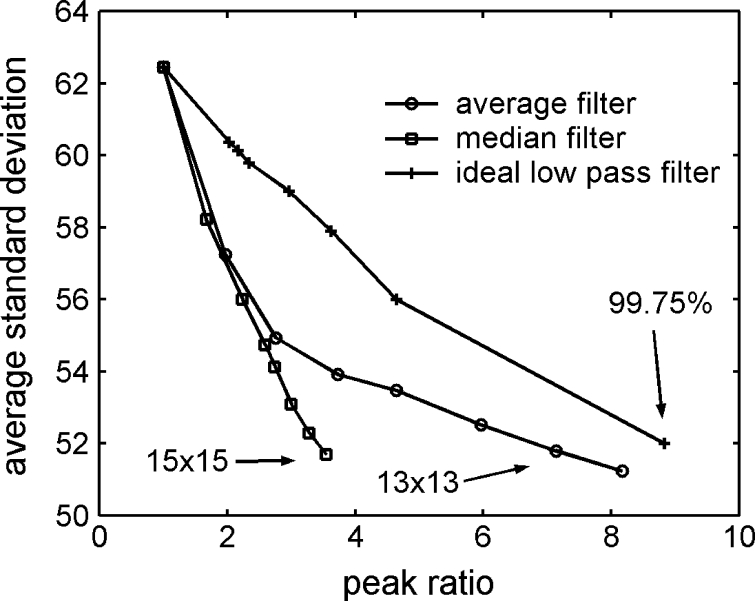
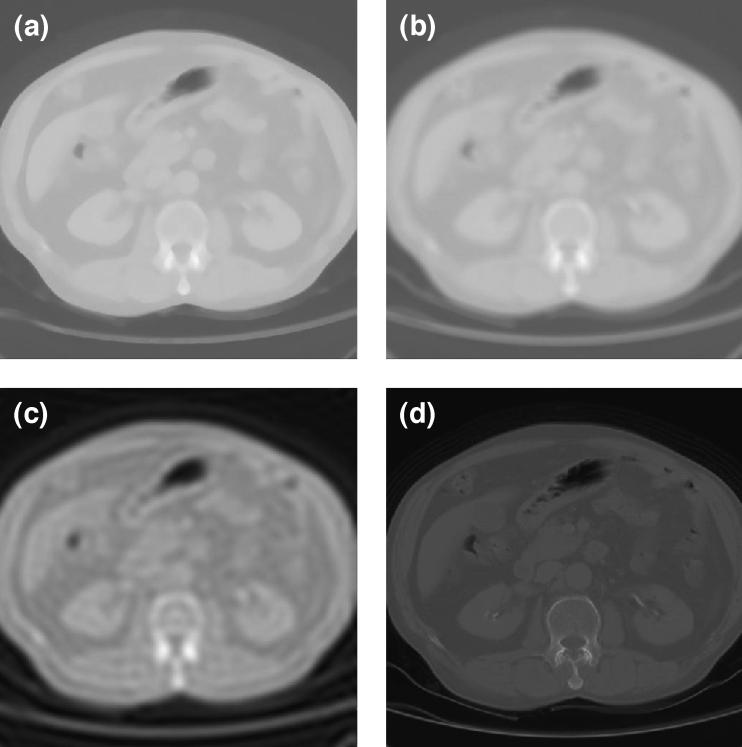
In general, the standard deviation (STD) value in a mask shows variation in the gray level between the pixels and might be used as a blurring measurement. However, the variance corresponds poorly to image blurring. An STD value of each pixel can also be represented with a window centered on it (as with Moran Z value). A histogram of STD values can be produced by collecting the STD values from all pixels in an image, and then show frequency data in a bar graph. For comparison to Moran peak ratio, histograms of STD values using a 9 × 9 window from an original CT body image with various compression ratios are shown in Figure 6. There is only a minor difference in the histograms between the original and reconstructed images for compression ratios even up to 59. This is because the STD value is affected more by structural differences than blurring. Figure 7 illustrates the relationship between the mean STD value in the histogram and the Moran peak ratio for the three low-pass filters: average, median, and ILPF at various degrees of smoothing. The peak ratio increased with mean STD decreasing for all three filters. Note that the ILPF filter has the highest peak ratio, followed by the average and median filters, but the same mean STD values (ca. 51.8–52.3). These images have the same mean STD values, but different image qualities. As shown in Figure 8(a) and (b), images are filtered using the median and average filters with the same 13 × 13 mask size; panel (c) is filtered using ILPF with a 99.75% passage, and panel (d) is an original image for comparison. It is obvious that Figure 8(c) is more blurred than Figure 8(a) and (b) when compared with the original image Figure 8(d). ILPF produced the blurriest image (highest peak ratio), followed by the average and median filters, as indicated in Figure 7. A good correlation between image blurring and the Moran peak ratio is easily demonstrated.
Fig. 6.
STD values histograms of lossy image compression of a CT body image using various compression ratios.
Fig. 7.
Average STD value compare to peak ratios of a CT body image. This image was premanipulated by average, median filter with various mask size and ILPF with various passed percent.
Fig. 8.
A comparison among filtered CT body images, with different peak ratios but the same average STD value by: (a) a median filter with mask 13 × 13, (b) an average filter with mask 13 × 13, (c) ILPF with 99.75% passage.
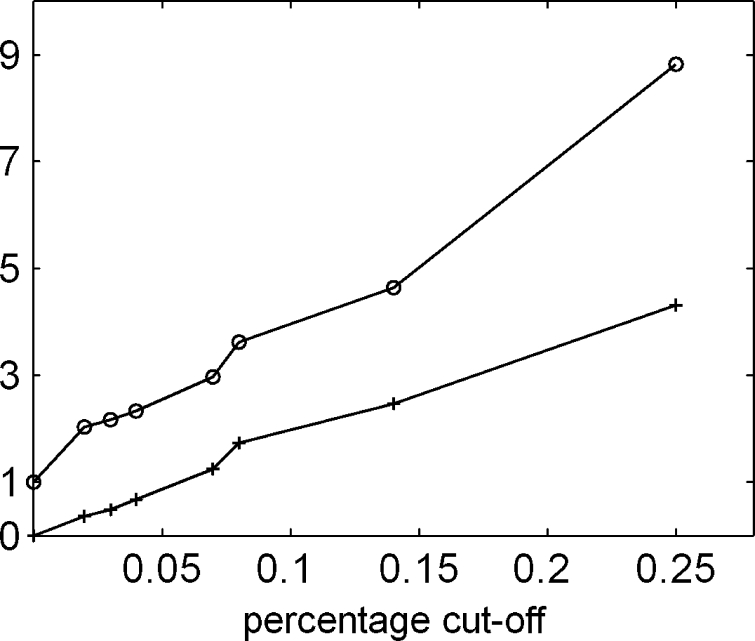
Figure 9 plots the peak ratio and NMSE as a function of degrees of percentage cut-off of power using ILPF. The peak ratio was demonstrated to increase with the increasing degrees of power cut-off and was very consistent with NMSE. This result indicated that the Moran peak ratio is a useful index for image blurring.
Fig. 9.
The peak ratio (○) and NMSE (+) vs. degrees of percentage cutoff of power to simulate the effect of blurring.
Conclusion
In this work, we applied Moran statistics for image blurring measurements. This quantitative image blurring capability was demonstrated using various manipulated images. The proposed method was shown to be very sensitive to image blurring and consistent with the results of NMSE. This method proves to be better than the standard gray level distribution deviation. It can also be used to discern the blurriness in images by image compression algorithms.
Acknowledgments
This work is supported in part by research grant NSC 93-2320-B-075 -007 from the National Science Council and in part by research grant SZI09303003 from Shu-Zen College of Medicine and Management, Taiwan.
References
- 1.Paranjape RB. Fundamental enhancement technique. In: Bankman IN, editor. Handbook of Medical Imaging Processing and Analysis. San Diego: Academic Press; 2000. pp. 3–18. [Google Scholar]
- 2.Erickson BJ: Irreversible compression of medical images. The Society for Computer Applications in Radiology (SCAR) http://www.scarnet.org, 2000
- 3.Okkalides D, Efremides S. Quality assessment of DSA, ultrasound and CT digital images compressed with the JPEG protocol. Phys Med Biol. 1994;39:1407–1421. doi: 10.1088/0031-9155/39/9/008. [DOI] [PubMed] [Google Scholar]
- 4.Wong S, Zaremba L, Gooden D, Huang HK. Radiologic image compression—a review. Proc IEEE. 1995;83:194–219. doi: 10.1109/5.364466. [DOI] [Google Scholar]
- 5.Goldberg MA. Image data compression. J Digit Imaging. 1998;11:230–232. doi: 10.1007/BF03168323. [DOI] [PMC free article] [PubMed] [Google Scholar]
- 6.Ritenour ER, Maidment ADA, Hendee WR. Lossy compression should not be used in certain imaging applications such as chest radiography. Med Phys. 1999;26:1773–1775. doi: 10.1118/1.598783. [DOI] [PubMed] [Google Scholar]
- 7.Persons K, Palisson P, Manduca A, Erickson BJ, Savcenko V. An analytical look at the effects of compression on medical images. J Digit Imaging. 1997;10:60–66. doi: 10.1007/BF03168659. [DOI] [PMC free article] [PubMed] [Google Scholar]
- 8.Gonzalez RC, Woods RE. Digital Image Processing. Singapore: Addison-Wesley; 1992. pp. 3–18. [Google Scholar]
- 9.Burgul R, Gilbert FJ, Undrill PE. Methods of measurement of image quality in teleultrasound. Br J Radiol. 2000;73:1306–1312. doi: 10.1259/bjr.73.876.11205675. [DOI] [PubMed] [Google Scholar]
- 10.Chuang KS, Huang HK. Assessment of noise in a digital image using the join-count statistic and Moran test. Phys Med Biol. 1992;37:357–369. doi: 10.1088/0031-9155/37/2/004. [DOI] [PubMed] [Google Scholar]
- 11.Cliff AD, Ord JK. Spatial Process: Models and Applications. London, UK: Pion; 1981. [Google Scholar]
- 12.Wang Z, Bovic AC. A universal image quality index. IEEE Signal Process Lett. 2002;3:81–84. doi: 10.1109/97.995823. [DOI] [Google Scholar]
- 13.Chen TJ, Chuang KS, Wu J, Chen SC, Hwang IM, Jan ML. A novel image quality index using Moran I statistics. Phys Med Biol. 2003;48:N131–N137. doi: 10.1088/0031-9155/48/8/402. [DOI] [PubMed] [Google Scholar]
- 14.Chen TJ, Chuang KS, Wu J, Chen SC, Hwang IM, Jan ML. Quality degradation in lossy wavelet image compression. J Digit Imaging. 2003;16:210–215. doi: 10.1007/s10278-003-1652-0. [DOI] [PMC free article] [PubMed] [Google Scholar]
- 15.Chen TJ, Chuang KS, Chiang YC, Chang JH, Liu RS. A statistical method for evaluation quality of medical images: Case study in bit discarding and image compression. Comput Med Imaging Graph. 2004;28:167–175. doi: 10.1016/j.compmedimag.2004.01.003. [DOI] [PubMed] [Google Scholar]
- 16.Suryanarayanan S, Karellas A, Vedantham S, Waldrop CJ, D'orsi CJ. A perceptual evaluation of JPEG2000 image compression for digital mammography: Contrast-detail characteristics. J Digit Imaging. 2004;17:64–70. doi: 10.1007/s10278-003-1728-x. [DOI] [PMC free article] [PubMed] [Google Scholar]


