

Abstract
The ability to analyze and merge data across sites, vendors, and field strengths depends on one's ability to acquire images with the same image quality including image smoothness, signal-to-noise ratio (SNR) and contrast-to-noise ratio (CNR). SNR can be used to compare different magnetic resonance scanners as a measure of comparability between the systems. This study looks at the SNR and CNR ratios in structural fast spin-echo T2-weighted scans acquired in five individuals across ten sites that are part of Functional Imaging Research of Schizophrenia Testbed Biomedical Informatics Research Network (fBIRN). Different manufacturers, field strengths, gradient coils, and RF coils were used at these sites. The SNR of gray matter was fairly uniform (41.3–43.3) across scanners at 1.5 T. The higher field scanners produced images with significantly higher SNR values (44.5–108.7 at 3 T and 50.8 at 4 T). Similar results were obtained for CNR measurements between gray/white matter at 1.5 T (9.5–10.2), again increasing at higher fields (10.1–28.9 at 3 T and 10.9 at 4 T).
Key words: Image quality, signal-to-noise (S/N), magnetic resonance imaging (MRI)
Introduction
The signal/noise ratio (SNR) is an important characteristic of magnetic resonance (MR) imaging scanners. This metric allows for comparison between various scanners. An extension of the SNR measurement is contrast/noise ratio (CNR), which is clinically an important measure of scanner performance. The goal of MR exams is to differentiate various tissue types to make a differential diagnosis (lesion vs. normal), or to make quantitative measurements (gray matter vs. white matter). The reliability of these measures is in part determined by the contrast in the images between the tissue types of interest.
Multicenter imaging studies are becoming increasingly important. There are several ongoing large multicenter studies that are being undertaken to study several psychiatric and neurological disorders. These include a study of the Neurobiological Predictors of Huntington's Disease (PREDICT), the National Institute on Aging Neuroimaging Initiative Study of Alzheimer's Disease, the Mental Illness and Neurosciences Discovery (MIND) Clinical Imaging Study of Schizophrenia, and European Multicenter Association Study of Schizophrenia (EMASS), to name a few. The majority of these studies acquire images with the same scan parameters as far as can be provided by the scanning software. These studies have, in general, avoided differences in field strength by acquiring images at only a single field strength (traditionally 1.5 T). Multicenter studies offer the following benefits: (1) the ability to study diversified subject populations that may not be available at any individual site; (2) the ability to collect a large cohort of subjects in a fairly rapid manner; (3) the ability to generalize findings, or to limit findings to a particular phenotype; (4) it provides an opportunity to compare image analysis methods if the data is shared between sites.
Conducting studies across sites and merging data require an understanding of the differences in image quality that arise from collecting data across manufacturers, field strengths, gradient coils, and RF coils. Differences in image distortions, image smoothness, signal-to-noise ratio, and sequence implementations may result in data that are difficult to merge. For example, at 3 T, as compared to 1.5 T, we expect that the MR signal will be greater, thus providing images with superior SNR.
The data used in this study were collected as part of the Functional Imaging Research of Schizophrenia Testbed Biomedical Informatics Research Network (fBIRN). BIRN is a National Institutes of Health (NIH)–National Center for Research Resources (NCRR)-sponsored initiative that fosters large-scale biomedical science collaborations by utilizing emerging cyberinfrastructure (high-speed networks, distributed high-performance computing, and the necessary software and data integration capabilities). The fBIRN initiative includes a team of 11 research laboratories located at The University of Iowa (Iowa), Massachusetts General Hospital (MGH), Brigham and Women's Hospital (BWH), Duke University Medical Center (Duke), University of North Carolina (UNC), University of California Irvine (UCI), University of California Los Angeles (UCLA), University of California San Diego (UCSD), University of New Mexico (UNM), University of Minnesota (UMN), and Stanford. This group is studying regional brain dysfunctions related to the progression and treatment of schizophrenia.
To our knowledge, there has been very little work published on the comparability of scans acquired across sites and vendors. Currently, one of the better descriptions of differences in anatomical imaging sequences and the resulting volumetric measurements across pulse sequences is the quantification of measurement errors of the caudate.1 As a first step toward identifying and quantifying sources of variance in image data across sites, the present study strives to measure differences in image quality measured as signal-to-noise ratio and contrast-to-noise ratio across sites, vendors, and field strengths (Table 1).
Table 1.
fBIRN Sites and Hardware
| Site | Manufacturer | Field Strength (T) | Scanner | Coil |
|---|---|---|---|---|
| Iowa | GE | 1.5 | CV/i | TR quadrature head |
| UNM | Siemens | 1.5 | Sonata | RO quadrature head |
| UMN | Siemens | 3.0 | Trio | TR quadrature head |
| MGH | Siemens | 3.0 | Trio | TR quadrature head |
| Duke/UNC | GE | 4.0 | NV/i | TR quadrature head |
| Duke/UNC | GE | 1.5 | NV/i | TR quadrature head |
| BWH | GE | 3.0 | VH/i | GE TR Research Coil |
| UCSD | Siemens | 1.5 | Symphony | RO quadrature head |
| UCI | Phillips/Picker | 1.5 | Eclipse | RO quadrature head |
| Stanford | GE | 3.0 | CV/NVi | Elliptical quadrature head |
| UCLA | Siemens | 3.0 | Allegro | TR quadrature head |
TR = transmit and receive; RO = receive only.
Materials and Methods
Six subjects consented to participate in the study at Stanford and the University of Minnesota. International Review Board (IRB) approval was obtained at all sites, and separate informed consent was obtained from each subject at each of the sites. The subjects traveled to each of the sites and were imaged twice within 48 h. One subject dropped out halfway through the study and thus data from only five subjects was collected on ten scanners at nine sites. UCLA was unable to participate in this part of the study because their scanner was not yet installed.
Image Acquisition
The T2-weighted images that were collected as part of a larger fMRI study are the subject of the analysis presented in this report. Further analysis of the other fMRI data is currently underway.2–4 The protocol for the acquisition of the fast spin-echo T2 images was as follows: TE = 68 ms, TR = 4,000 ms, NEX = 1, echo train length = 12, FOV = 220 × 220 mm, matrix = 256 × 192, slice thickness/gap = 5.0/0.0 mm. The T2 image sets were in the same plane as the fMR images and were acquired for image coregistration. The goal was to obtain oblique axial images along the AC–PC line. Only one angle of rotation was used to acquire the images. Even though the T2 scans were explicitly described in the original protocol, some deviations in the protocol T2 sequence existed. The actual parameters run at each site are outlined in Table 2. Data were collected twice on each scanner for every subject within a 48-h time period.
Table 2.
Summary of T2 Scan Parameters Used at Each of the fBIRN Sites
| Site | Field (T) | TE (ms) | TR (ms) | Number of Echoes | FOV (mm) | Matrix | BW (Hz/pixel) | Slice Thickness (mm) | NEX | Coil |
|---|---|---|---|---|---|---|---|---|---|---|
| Iowa | 1.5 | 70 | 4,000 | 12 | 220 × 220 | 256 × 192 | 122 | 4.0 | 1 | T/R Head |
| UNM | 1.5 | 70 | 4,000 | 11 | 220 × 220 | 256 × 192 | 130 | 4.0 | 1 | R/O Head |
| UMN | 3.0 | 68 | 4,000 | 13 | 220 × 165 | 256 × 192 | 145 | 4.0 | 1 | T/R Head |
| MGH | 3.0 | 15 | 7,850 | 7 | 220 × 220 | 256 × 256 | 123 | 4.0 | 1 | T/R Head |
| Duke/UNC | 4.0 | 56 | 9,000 | 4 | 220 × 165 | 256 × 192 | 125 | 4.0 | 1 | T/R Head |
| Duke/UNC | 1.5 | 70 | 4,000 | 12 | 220 × 220 | 256 × 192 | 125 | 4.0 | 1 | T/R Head |
| BWH | 3.0 | 66 | 4,000 | 7 | 220 × 220 | 256 × 192 | 122 | 4.0 | 1 | T/R Head |
| UCSD | 1.5 | 72 | 4,000 | 13 | 220 × 220 | 256 × 192 | 300 | 4.0 | 1 | R/O Head |
| UCI | 1.5 | 75 | 8,144 | 12 | 220 × 220 | 256 × 256 | 93 | 4.0 | 1 | R/O Head |
| Stanford | 3.0 | 68 | 5,000 | 12 | 220 × 220 | 256 × 192 | 122 | 4.0 | 1 | T/R Head |
Once the data were collected, they were uploaded onto the BIRN Storage Resource Broker (SRB), where they could be accessed by all sites in the fBIRN consortium. Data from all sites were downloaded to the University of Iowa Department of Radiology's Image Processing Laboratory for analysis.
Image Analysis
Data from the sites were in a variety of formats, therefore they were converted into standard Analyze 7.5 image format. The first scan acquired at the University of Iowa was used as that subject's template image for subsequent registration. For each subject, a rater manually traced regions of interest (ROIs) defining samples of relatively pure gray matter (GM), white matter (WM), cerebral spinal fluid (CSF), and air. In choosing the air ROI, the rater was careful to avoid regions that might contain motion artifacts (ghosting and ringing) and regions of zero padding in the image. The CSF ROIs were chosen in the ventricle region while avoiding the choroid plexus. The gray matter definitions included samples in both cortical and basal gray matter regions. The basal regions contained voxels from both the right and left caudate and putamen (Fig. 1). Cortical gray matter regions were defined in inferior frontal regions as well as the insular cortex. The white matter included regions from the left and right frontal and posterior temporal regions. The ROIs were chosen away from the border or edge of these tissues, so that slight errors and partial volume artifacts from the image coregistration would not bias the results. ROI definitions were generated using the BRAINS2 image analysis toolkit.5–7
Fig 1.

Example of ROIs used for SNR and CNR measurements. The figure shows air (white), CSF (dark gray), gray matter (light gray), and white matter (black). ROIs are shown with a width of three voxels for visualization purposes only. This image shows the manually defined ROIs for this subject.
Once the ROI definition was completed, the template image was coregistered to all the other scans obtained for this subject at all of the other sites. The Insight Toolkit (ITK)8 (http://www.itk.org) multiresolution mutual information registration algorithm was used for the coregistration.9,10 This application was customized to permit saving of the six parameter affine transformation and all parameters were defined by the operator at the command line. For this study, the following set of parameters was used: reslice shrink factor = 1 along x, y, and z; standard shrink factor = 1 along x, y, and z; number of levels = 6; number of iterations at each level = 2,500; learning rates = 1 × 10⁻⁴, 1 × 10⁻⁵, 5 × 10⁻⁶, 1 × 10⁻⁶, 5 × 10⁻⁷, 1 × 10⁻⁷; and translation scale = 250. The BRAINS2 ROIs were converted into binary images and realigned using the affine transformation generated to coregister the T2-weighted scans. The coregistered ROIs were used to obtain image intensity measurements of the mean and the first four moments of the image intensity distribution within each of the ROIs using BRAINS2. Separate measurements were obtained for both scanning sessions.
Based on the image intensity distributions, measurements of SNR (gray matter) and CNR (gray matter/white matter) for the images were obtained. SNR was computed as
 |
1 |
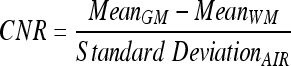
Separate measurements were obtained for the cortical and basal ganglia regions. CNR measurements were defined as
 |
2 |
For two-dimensional MR imaging examinations, the SNR is related to the field of view (FOVx × FOVy), the number of averages (NEX), the bandwidth (BW), the matrix size (Nx × Ny), proton density (ρ), TE, TR, T1, T2, and a constant (K). For this study, we assumed the following form of the equation.
 |
3 |
Given that the echo times used were short relative to the T1 of gray matter, less than 1/10 T1, the longitudinal recovery of the magnetization during data acquisition was ignored.
The proton density in the previous equation is to first approximation linearly related to the field strength of the static magnetic field, B0.11 Therefore, SNR is linearly related to the main magnetic field, and ρ can be replaced by B0. Equation (3) can be written as
 |
4 |
where K is a scanner and coil characteristic, B0 is the strength of the main magnetic field, and M is related to the scan parameters. Rearranging the equation allows one to solve for the constant K for each scanner. For this analysis, the following assumptions were made for the T2 values of gray matter at different field strengths: 85 ms at 1.5 T, 60 ms at 3 T, and 45 ms at 4 T. These values were derived from the literature for the caudate and putamen based on several studies.12–15 Similarly, T1 values for gray matter of 1,200 ms for 1.5 T, 1,350 ms for 3 T, and 1,500 ms at 4 T were used in this analysis as reported in the literature.12,16,17
Results
The results for SNR were remarkably stable across 1.5-T scanners with values ranging from 41.3 to 43.3 (Fig. 2) for the basal ganglia ROIs. The SNR differed by less than 5% across the five 1.5-T sites even though differences in the hardware and scan parameters used to collect the images existed (Table 3). These differences include the number of echoes in the fast-spin echo sequence, the types of coils, and different scanner manufacturers. The sites with 1.5-T scanners did have the least amount of deviation in terms of scanning parameters. As a group, the SNR at higher fields increased. SNR measurements ranged from 44.5 to 108.7 at 3 T, and 50.8 at 4 T. At higher fields, variability in the measures was greater, and this was statistically significant (Levene's test, df = 1,89, p < 0.001). This variability at 3 T produced a 60% difference in SNR values at the extremes. Scan parameters and coils used on high-field systems were more variable as well. An ANOVA analysis revealed that there was a site effect (F = 52.78, p < 0.0001), no visit effect (F = 0.57, p = 0.492), a field effect (low vs. high) (F = 48.18, p < 0.0001), no manufacturer effect (F = 0.19, p = 0.665). Although there was an overall field effect (higher field having a greater SNR), each site was compared to each of the other sites by using a comparison of least square means. Results showed that only 60% of the comparisons of the basal gray matter ROIs had a larger SNR at higher field as compared to lower field scanners.
Fig 2.

SNR for gray matter. The graph shows the individual SNR values for each of the scans at each of the sites. The sites are grouped by field strength and scanner manufacturer. (SIE-1.5 T = Siemens 1.5 T, SIE-3.0 T = Siemens 3.0 T, GE-1.5 T = General Electric 1.5 T, GE-3.0 T = General Electric 3.0 T). A total of ten measurements (5 subjects × 2 measurements/subject) should exist for all sites. A couple of sites (UCI and BWH) had technical problems that generated incomplete data for some of the measurements.
Table 3.
SNR Measurements
| Site | Field (T) | SNR Basal Ganglia | SNR Cortical GM | SNR WM | CNR GM-WM |
|---|---|---|---|---|---|
| Iowa | 1.5 | 42.9 | 51.8 | 35.0 | 9.9 |
| UNM | 1.5 | 43.4 | 50.2 | 32.9 | 10.4 |
| UMN | 3.0 | 50.1 | 62.2 | 39.6 | 12.6 |
| MGH | 3.0 | 108.7 | 108.2 | 81.1 | 28.4 |
| Duke/UNC | 4.0 | 56.9 | 70.4 | 44.3 | 12.6 |
| Duke/UNC | 1.5 | 41.3 | 49.3 | 31.6 | 9.7 |
| BWH | 3.0 | 44.4 | 51.5 | 33.9 | 10.4 |
| UCSD | 1.5 | 42.5 | 48.2 | 32.6 | 9.9 |
| UCI | 1.5 | 46.2 | 53.9 | 36.4 | 11.1 |
| Stanford | 3.0 | 104.2 | 121.9 | 83.1 | 24.2 |
SNR measurements in the cortical regions were stable at 1.5 T like the basal ganglia regions; however, these regions had a higher SNR ratio compared to the basal ganglia regions. At 1.5 T, SNR ranged from 48.3 to 53.9, whereas 3-T scanners ranged from 62.9 to 121.9. At 4 T, SNR value for cortical gray matter was 76.6. These are significantly higher than the SNR measurements obtained in the basal ganglia region (p = 0.0003). CNR measurements were again similar across 1.5-T scanners ranging from 9.5 to 10.2 with a general increase at higher fields (10.1–28.9 at 3 T and 10.9 at 4 T) (Fig. 3). CNR results are summarized in Fig. 3.
Fig 3.

CNR for gray matter and white matter. The graph shows the individual CNR values for each of the scans at each of the sites. The sites are grouped by field strength. A total of ten measurements (5 subjects × 2 measurements) should exist for all sites. A couple of sites (UCI and BWH) had technical problems that generated incomplete data for some of the measurements.
The scanner and coil constant K was variable across scanners and was not influenced by scanner manufacturer. Values for K ranged from 0.594 (BWH) to 1.4 (Stanford), both of which were GE 3 T scanners. The coil used at Stanford was a locally custom built coil, whereas the coil used at BWH was a quadrature head coil developed by the manufacturer. There are several sources for the variation in coil sensitivity at higher fields. It is well known that sample-dependent loading and tuning shifts impede the performance of large coils especially at higher fields. There are proposed methods to correct these tuning asymmetries, but they are not routinely implemented.18,19 Although the subjects were the same from site to site, positioning within the coil was variable. Local intensity shift artifacts are another source of potential variations in SNR between coils.20,21 These artifacts may result from asymmetric coil loading, improper tuning of rod currents, or mismatched size of coil elements.22
Discussion
The measured SNR and CNR across vendors and coils were fairly uniform across the 1.5-T field strength scanners. This held true even though both receive only and transmit/receive head coils were used and subtle differences existed in the scan parameters. In general, higher field scanners significantly improved the SNR using the same imaging parameters for the T2-weighted fast spin-echo images analyzed in this study. However, it was found that not all 3-T scanners in this study had the same benefit from the increased field. The higher field scanners also exhibited a larger variance in the SNR values obtained, due in part to the variability in scan parameters used. Optimizing of scan parameters at higher fields to account for the different T1 and T2 relaxation times further increased the SNR values obtained as seen in the large sequence parameter constant computed for the MGH site (Table 4). SNR was greater in the gray matter regions closer to the receive coil (cortical ROIs) compared to gray matter in the center of the coil (basal ROIs) (Fig. 4). Increase in SNR and CNR at higher field strengths and its large variation is a potential source of a site bias in studies acquired across these systems. The following approaches could be taken to eliminate the site bias: (1) scan parameters could be adjusted to provide similar SNR/CNR measures across field strengths, (2) image processing techniques could be developed that are immune to SNR/CNR differences, or (3) statistical approaches could be employed to control for these factors such as using SNR as a covariate when analyzing this data.
Table 4.
Scanner and Coil Constant
| Site | Sequence Parameter Constant (B0 × M) | Scanner and Coil Constant (K) |
|---|---|---|
| Iowa | 50.2 | 0.858 |
| UNM | 48.5 | 0.894 |
| UMN | 49.7 | 1.01 |
| MGH | 158.8 | 0.616 |
| Duke/UNC 4.0 T | 67.3 | 0.845 |
| Duke/UNC 1.5 T | 49.5 | 0.835 |
| BWH | 74.7 | 0.594 |
| UCSD | 31.2 | 1.36 |
| UCI | 48.6 | 0.760 |
| Stanford | 74.4 | 1.40 |
Fig 4.

Example of ROIs used for SNR and CNR measurements fit from the defined scan acquired at the University of Iowa to a scan collected on the Brigham and Women's scanner. The figure shows air (white), CSF (dark gray), gray matter (light gray), and white matter (black). ROIS are shown with a width of three voxels for visualization purposes only.
The quality of the receiver coil is also a potential source of variability across scanners. The characteristics of these coils can vary widely at higher fields, which is still a developing technology for clinical scanners. All 1.5-T scanners acquired data using standard manufacturer coils. There has been substantial development and testing of these systems over the past 20 years. The coils used on 3-T scanners included an assortment of different coils with no two coils being the same. This may have played a substantial role in the findings that not all 3-T scanners had significantly greater SNR as compared to the 1.5T scanners. Increased variation in the measured SNR levels at higher fields is likely due in part to the increased sensitivity to coil loading at higher frequencies. These factors should be considered when developing across-site protocols.
The ability to combine and merge data collected across MR scanners and field strengths is a challenge the BIRN initiative is presently pursuing. The first step in this process is identifying the differences in image quality (SNR, CNR, smoothness, geometric distortion) that exist across scanner manufacturers and field strengths. Next, methods to account/compensate for these differences need to be fully developed to allow these data to be merged.
To facilitate studies and development of cross-site protocols, it may be possible to develop a phantom with tissue characteristics of gray matter, white matter, and CSF. The benefits of this type of data are very appealing because the phantom would not suffer from motion artifacts (bulk motion as well as cardiac and respiratory pulsatility), and is an easier and cheaper solution to quantify SNR characteristics in an MR scanner.
Acknowledgments
This work was collected as part of the Functional Imaging Research of Schizophrenia Testbed (FIRST), Biomedical Informatics Research Network (BIRN). The authors would like to thank all of the people who have worked so hard to make the fBIRN project successful and who helped to collect this data. This work was supported in part by the following NIH NCRR Grant: NCRR P41RR13218.
References
- 1.Gurleyik K, Haacke E. Quantification of errors in volume measurements of the caudate nucleus using magnetic resonance imaging. J Magn Reson Imaging. 2002;15:353–363. doi: 10.1002/jmri.10083. [DOI] [PubMed] [Google Scholar]
- 2.Zou K, Greve D, Wang M, Pieper S, Warfield S, White N, Vangel M, Kikinis R, Wells W, BIRN F: A prospective multi-institute study of the reproducibility of fMRI: A preliminary report from the biomedical informatics research group. In: International Conference on Medical Image Computing and Computer Assisted Intervention. 2, 2004, pp 769–776
- 3.Zou K, Greve DN, Wang M, Pieper S, Warfield S, White NS, Manandhar S, Brown CG, Vangel MG, Kikinis R, Wells WM, BIRN F Factors impacting the reproducibility of functional MR Imaging: Preliminary results of a prospective multiinstitutional study by the biomedical informatics research network. Radiology. 2005;237:781–789. doi: 10.1148/radiol.2373041630. [DOI] [PMC free article] [PubMed] [Google Scholar]
- 4.Friedman L, Magnotta V, Posse S, BIRN F: Scanner differences in the smoothness of fMRI images: Implications for multi-center studies, In: International Society for Magnetic Resonance in Medicine, 2004, p 1074
- 5.Andreasen N, Cohen G, Harris G, Cizadlo T. Image processing for the study of brain structure and function: Problems and programs. J Neuropsychiatry Clin Neurosci. 1992;4:125–133. doi: 10.1176/jnp.4.2.125. [DOI] [PubMed] [Google Scholar]
- 6.Andreasen N, Cizadlo T, Harris G, Cizadlo T. Voxel processing techniques for the antemortem study of neuroanatomy and neuropathology using magnetic resonance imaging. J Neuropsychiatry Clin Neurosci. 1993;5:121–130. doi: 10.1176/jnp.5.2.121. [DOI] [PubMed] [Google Scholar]
- 7.Magnotta V, Harris G, Andreasen N, Yuh W, Heckel D. Structural MR image processing using the BRAINS2 toolbox. Comput Med Imaging Graph. 2002;26:251–264. doi: 10.1016/S0895-6111(02)00011-3. [DOI] [PubMed] [Google Scholar]
- 8.Ibanez L, Schroeder W, Ng L, Cates J: The ITK Software Guide: The Insight Segmentation and Registration Toolkit (version 1.4), Kitware Inc, Clifton Park, NY, 2003
- 9.Viola P, Wells W. International Conference on Computer Vision. Los Alamitos, CA: IEEE Computer Society Press; 1995. Alignment by maximization of mutual information; pp. 16–23. [Google Scholar]
- 10.Maes F, Collignon A, Vandermeulen D, Marchal G, Suetens P. Multi-modality image registration by maximization of mutual information. IEEE Trans Med Imaging. 1997;16:187–198. doi: 10.1109/42.563664. [DOI] [PubMed] [Google Scholar]
- 11.Bottomley P, Hardy C, Argersinger R, Pfeifer L. A review of normal tissue hydrogen NMR relaxation times and relaxation mechanisms from 1–100 MHz: dependence on tissue type, NMR frequency, temperature, species, excision, and age. Med Phys. 1998;11:425–448. doi: 10.1118/1.595535. [DOI] [PubMed] [Google Scholar]
- 12.Jezzard P, Duewell S, Balaban R. MR relaxation times in human brain: Measurements at 4 T. Radiology. 1996;199:773–779. doi: 10.1148/radiology.199.3.8638004. [DOI] [PubMed] [Google Scholar]
- 13.Gelman N, Gorell J, Baker P, Savage R, Spickler E, Windham J, Knight R. MR imaging of human brain at 3.0t: Preliminary report on transverse relation rates and relation to estimated iron content. Radiology. 1999;210:759–767. doi: 10.1148/radiology.210.3.r99fe41759. [DOI] [PubMed] [Google Scholar]
- 14.Georgiades C, Itoh R, Golay X, Zijl P, Melhem E. MR imaging of the human brain at 1.5 T: Regional variations in transverse relation rates in the cerebral cortex. Radiology. 1999;210:759–767. [PMC free article] [PubMed] [Google Scholar]
- 15.Vymazaland J, Babis M, Brooks RA, Filip K, Dezortova M, Hajek M. T1 and T2 alterations in the brains of patients with hepatic cirrhosis. AJNR. 1996;17:333–336. [PMC free article] [PubMed] [Google Scholar]
- 16.Wansapura J, Holland S, Dunn R, Ball W. NMR relaxation times in the human brain at 3.0 tesla. J Magn Reson Imaging. 1999;9:531–538. doi: 10.1002/(SICI)1522-2586(199904)9:4<531::AID-JMRI4>3.0.CO;2-L. [DOI] [PubMed] [Google Scholar]
- 17.Whittal K, MacKay A, Graeb A, Nugent R, Li K, Paty W. In vivo measurement of T2 distributions and water contents in normal human brain. Magn Reson Med. 1997;37:34–43. doi: 10.1002/mrm.1910370107. [DOI] [PubMed] [Google Scholar]
- 18.Doty FD, Entzminger G, Hauck C, Staab JP. Practical aspects of birdcage coils. J Magn Reson. 1999;138:144–154. doi: 10.1006/jmre.1998.1703. [DOI] [PubMed] [Google Scholar]
- 19.Tropp JS: Method of correcting an asymmetry in an NMR radio frequency coil and an improved radio frequency coil having N-fold symmetry and reduced eddy current, US Patent No 5,196,797, 1993
- 20.Wardenier P: Local intensity shift artifact (LISA). In: Society of Magnetic Resonance in Medicine 1989, 1998, pp 1175
- 21.Jones RW, Witte RF. Signal intensity artifacts in clinical MR imaging. Radiographics. 2000;20:893–901. doi: 10.1148/radiographics.20.3.g00ma19893. [DOI] [PubMed] [Google Scholar]
- 22.Vij K, Jones R, Boskamp E: The asymmetric birdcage design: a quadrature neck coil application. In: Society of Magnetic Resonance in Medicine 1992, 1992, p 1040