Abstract
The steady state response motion of a base excited cantilever beam with circular cross-section excited by a unidirectional displacement will fall along a straight line. However, achieving straight-line motion with a real cantilever beam of circular cross-section is difficult to accomplish. This is due to the fact that nonlinear effects, small deviations from circularity, asymmetric boundary conditions, and actuator cross coupling can induce whirling. The vast majority of previous work on cantilever beam whirling has focused on the effects of system nonlinearities. We show that whirling is a much broader problem in the design of resonant beam scanners in that the onset of whirling does not depend on large amplitude of motion. Rather, whirling is the norm in real systems due to small system asymmetries and actuator cross coupling. It is therefore necessary to control the growth of the whirling motion when a unidirectional beam motion is desired. We have developed a novel technique to identify the two eigen directions of the beam. Base excitation generated by virtual electrodes along these orthogonal eigen axes of the cantilever beam system generates tip vibration without whirl. This leads to accurate open loop control of the motion of the beam through the combined actuation of two pairs of orthogonally placed actuator electrodes.
1 Introduction
Weak unidirectional excitation of the root of a symmetric cantilever beam results in motion of the free end along the same direction. However, this is not true for non-symmetric cantilever beams. These beams generally undergo a whirling motion during unidirectional excitation. Cantilever beams with a high Q Factor are especially susceptible to whirling near resonance due to small geometry related non-symmetry.
Significant attention has been given to the study of whirling during forced nonlinear vibration of cantilevered beams. Haight and King [1] were able to predict the excitation frequencies at which whirling occurs. Hyer [2] extended Haight and King’s work by quantitatively analyzing whirling motion. It was concluded that stable whirling motion exists near the resonant frequencies of the beam. Crespo da Silva and Glynn [3] derived a complete set of torsional-flexural-flexural partial integro-differential equations for a base excited cantilever beam. Pai and Nayfeh [4] extended Crespo da Silva and Glynn’s work to include gravitational forces. They worked with beams that had one-to-one internal resonance, in that the linear bending natural frequency in one plane was approximately equal to the linear bending natural frequency in the other plane. They found that by biasing the natural frequency ratio a small amount the beam would develop non-planar motion.
Experimental work on nonlinear characteristics of cantilever beams has also been actively pursued. Nayfeh and Nayfeh [5] studied the in-plane and out-of-plane response motion of slender and cylindrical cantilever beams actuated near resonance. Krauss and Nayfeh [6] experimentally identified nonlinear parameters associated with a rectangular and steel cantilever beam. Oueini and Nayfeh [7] used a sensor to feedback a nonlinear damping term that was proportional to cubic velocity for a rectangular cantilever to eliminate unwanted vibration. Smithwick et al. [8,9] analyzed whirl of small cylindrical beams in the context of it being a nonlinear phenomenon due to large fiber displacements and hysteresis from a piezoelectric actuator. Smithwick et al. [10] then developed a hybrid offline adaptive feedback/online open loop tracking controller to minimize the effects of these nonlinearities during actuation.
In our development of ultrathin scanning fiber endoscopes (SFE) [11–14] we have experienced that whirl in small cantilever beams can be a problem even for small excitation levels. In the case of the SFE we are exciting a cantilevered optical fiber that is a few millimeters in length and 125 microns in diameter. We have determined that the whirling is not due to nonlinearity in our systems, but instead due to a lack of alignment and symmetry within the system. Just like a point mass that is supported by asymmetric springs, an asymmetric beam will move in a whirling pattern when excited along a straight line. In addition, the warping of the cross-section of a non-circular beam as it bends [15, 16] can contribute to whirling motion due to the development of axial forces even though the amplitude of motion is small.
For beam oscillators that are not small it is usually straight forward to achieve whirl free motion since it is relatively easy to manufacture a close to perfect symmetric cross-section using normal manufacturing tolerances. However, achieving linear motion, i.e. no whirling, with a very small beam oscillator is much more difficult. Due to limitations in manufacturing and assembly it becomes harder to control the geometry of the oscillator/actuator as the size of the system approaches micrometer scales. Elimination of these significant non-symmetries can be prohibitively expensive and significantly increases the complexity of the manufacturing process. Adding sensors to monitor unwanted vibrations [7] is often not desirable, as is the case for the SFE, due to the increase in cost and complexity of the manufacturing process.
It is also important to accurately control the geometry and the action of the beam’s actuator. For micro-optical scanners this becomes a significant problem, because small variations in the actuator material and geometry can result in significant changes in the action of the actuators. Micro-fabrication is an inherently difficult process and as these actuators become smaller the actuation force may not act along its intended direction. The intended quadrant actuation becomes less unidirectional in action and does not necessarily impart equal actuation force to the optical fiber in each of the four directions. Actuation intended to act in two orthogonal directions might actually be actuation in nonorthogonal and non-collinear directions. Multi-directional response motion of the optical fiber can also occur when opposing electrodes are not parallel. The resulting crosstalk between actuator directions may contribute to un-intended and multi-directional motion.
Additionally, for small beams it is difficult to accurately control the geometry and the quality of the boundary conditions. For example, variation in the interface between the beam and actuator in the SFE is caused by the fact that epoxy is introduced between the two components. The small size and difficultly in achieving uniform consistency and distribution of adhesive cause a less than perfect epoxy interface. A boundary condition with non-symmetric stiffness will cause the global vibratory response of the beam to depend on the direction of motion. An isotropic attachment point for the scanning fiber is ideal, but not achievable with micro-optical scanners.
In this paper we will develop an actuation scheme to overcome the difficulties identified above and achieve whirl free motion of small, cantilevered beams. Combining input drive forces through the quadrant actuator can negate the inherent misalignment of the scanning fiber system to produce planar response motion. The achieved straight-line response in two orthogonal directions allows us to accurately identify important system parameters and to precisely and intuitively control the motion of the micro-optical scanner.
2 Whirling and Fiber Asymmetry
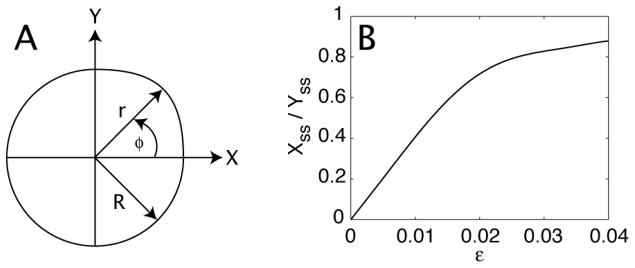
We begin by showing that very small beam asymmetries can cause whirling of a cantilevered beam. The response of a cantilever beam excited at the fixed end with a unidirectional harmonic displacement near the first resonant frequency was obtained using finite element analysis. The non-symmetry was introduced with a small perturbation of the radius in one of the four in the cross-sectional quadrants of the beam as seen in Figure 1A. The radius of the non-symmetric quadrant was defined as:
| (1) |
where R is the non-dimensional radius of the cantilever beam, ε is a small number that represents the change in radius within one quadrant of the cross-section, and φ is an angle measured from the X-axis that describes the location of the change in radius as shown in Figure 1A.
Figure 1.
(A) an axial view of a circular cantilever beam with radius R and non-symmetry in one quadrant with radius r. (B) finite element model results showing the steady state X/Y displacement ratio corresponding to the small changes in radius symmetry.
The ratio of motion perpendicular to the direction of actuation can be seen in Figure 1B, where the response ratio is the steady state X-displacement divided by the steady state Y-displacement. A unidirectional harmonic base excitation was applied along the Y-axis of the numerical model, which was an exact dimensional match of the scanning fiber and had the material properties of glass. As the value of ε slowly increased, the response ratio also increased, signifying cantilever beam whirling. It is clear from Figure 1 that significant whirling motion at resonance can occur with less than one percent of radius change in a cantilever beam. In the actual scanning fiber system there are many other potential non-symmetries that can cause whirling during excitation. Identifying a drive scheme that can eliminate the effects of all the non-symmetry and misalignment within the scanning fiber system is important for removing whirling response motion.
3 Experimental Setup
We present the results of experiments conducted on a small, circular cross-section cantilever made from glass optical fiber (460-HP, Nufern, East Granby, CT). The length of the cantilever was 4.3 mm and the diameter of its cross-section was 125 μm, with the first natural frequency being roughly 5 KHz. The optical fiber was fixed to a piezoelectric tube (piezo-tube) actuator that had inside diameter of 250 μm and an outside diameter of 450 μm. An endoscopic lens package (PENTAX, Tokyo, Japan) focuses the scanned light from the vibrating tip of the optical fiber. The scanning assembly was positioned directly in front of a position sensitive detector (PSD) (DL-10, UDT Sensors, Inc., Hawthorne, CA). The bench-top fiber optic probe was nearly identical to past probes that have previously been described in detail [11], which were designed to image at 15 frames per second. The PSD provided the real time measurements of the optical fiber tip location in the two lateral dimensions X and Y.
Unique to the resonant fiber scanning system is that the laser light is conveyed through the mechanical scanner while being guided within a single strand of optical fiber. This is unlike mirror-based scanning systems, which have light delivery and mechanical scanning that is decoupled, thus susceptible to misalignment and contamination. The light source used in this experiment was a 635 nm laser diode (4S1FC635, Thorlabs, Inc., Newton, NJ). Light projected from the scanning fiber was detected by a 1 cm2 PSD and recorded using a high-speed data acquisition card (PCI-6115, National Instruments, Corp., Austin, TX) installed in a personal computer (Dell DIM8400 4 CPU 3.20 GHz). Custom software written in LabVIEW (LabVIEW 8.5, National Instruments, Corp., Austin, TX) was used to create the drive signals applied to the piezo-tube actuator and collect the voltage output from the PSD. The voltage signals output from the PSD were converted into displacement measurements representing the laser dot displacement on the surface of the PSD.
4 Standard Excitation
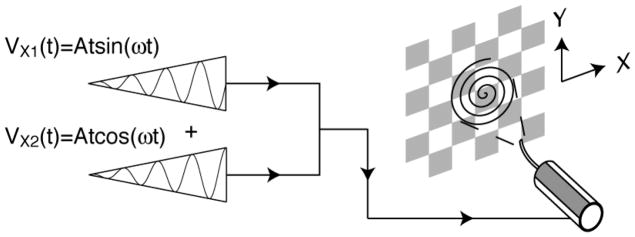
The piezoelectric tube actuator has two pairs of thin film metal electrodes, X1 and X2, which transform the input drive voltage signals into mechanical strains that cause the scanning fiber to deflect. The generalized drive voltages are a pair of sinusoids with some form of amplitude modulation given by the following:
| (2) |
| (3) |
where f(t) is the amplitude modulation function that describes the voltage amplitude in terms of being either a constant value or a linear ramp and ω is the drive frequency. The resulting motion of the scanning fiber to a pair of harmonic signals with linear ramp amplitude modulation is shown in Figure 2.
Figure 2.
The piezoelectric tube actuator is driven with a pair of amplitude modulated sinusoid signals applied to the X1 and X2-electrodes.
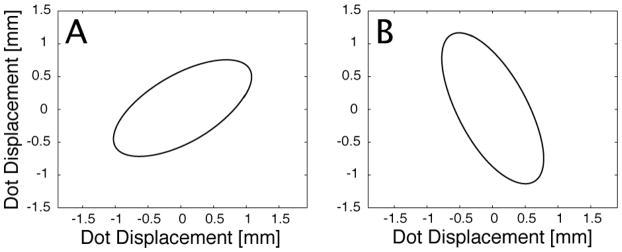
Cross-coupled response motion is quite evident in the scanning fiber system when the system was actuated with only one of the two pairs of piezo-tube electrodes. Figure 3A shows the steady state response of the scanning optical fiber to an actuation, 4 V at 5040 Hz, of the X1 electrode of the piezo-tube and no X2 electrode input. Figure 3B shows the steady state response when we reverse the input so that the X2 electrode alone is actuated with 4 V at 5040 Hz. The experimental data shown in Figure 3 is from the perspective of the PSD coordinates, X and Y.
Figure 3.
Experimental data that shows one cycle of steady state motion (A) while actuating the X1 electrode only. (B) while actuating the X2 electrode only.
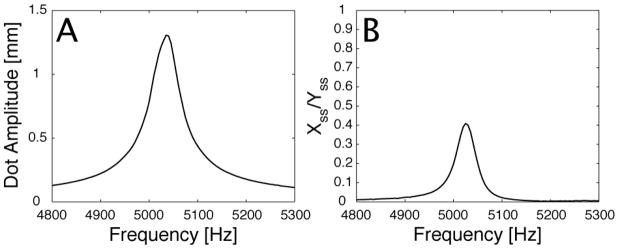
This whirling motion only occurs near the resonant frequency of the scanning fiber. Figure 4A shows the frequency response of the scanning fiber along the Y-direction to a 4 V input applied to the X2 electrode on the piezo-tube. Figure 4B shows presence of whirling near the resonant frequency of the scanning fiber by quantifying the steady state response ratio. Similar to data presented in Figure 4A, the experimental data presented in Figure 4B was generated by actuating the scanning fiber with a 4 V input applied the X2 electrode on the piezo-tube. At each frequency value the maximum steady state displacement along the X and Y-axes of the PSD were measured and used to calculate the response ratio.
Figure 4.
Experimental data showing (A) the frequency response of the scanning fiber system. (B) the ratio of whirling motion present in the frequency response using standard excitation.
5 Whirl Free Excitation
In order to effectively control the response of the scanning fiber, the cross-coupled response motion shown in Figure 3 needed to be eliminated. It is paramount to excite the fiber in two uncoupled and orthogonal directions. These two straight-line responses correspond to the eigen directions of the scanning fiber system. Forcing the fiber along these directions requires a combined activation of the X1 and X2 electrodes, which effectively created two pairs of virtual electrodes.
The virtual electrodes, VE1 and VE2, are combinations of the thin film metal electrodes on the piezo-tube actuator. The response motion of the scanning fiber to input actuation applied through the virtual electrodes are straight lines. Generalized virtual electrode input voltages are given by:
| (4) |
| (5) |
where f(t) is the amplitude modulation function that describes the voltage amplitude in terms of being either a constant value or a linear ramp and ω is the drive frequency, θ1 and θ2 describe the numerical combination of the piezo-tube electrodes that correspond to each virtual electrode, while x̂1 and x̂2 are used to indicate how each real electrode pair was actuated. Custom software identified the angles θ1 and θ2 by using a metric to measure the relative circularity of the resulting steady state ellipse at increasing values of θi, where i=1,2.
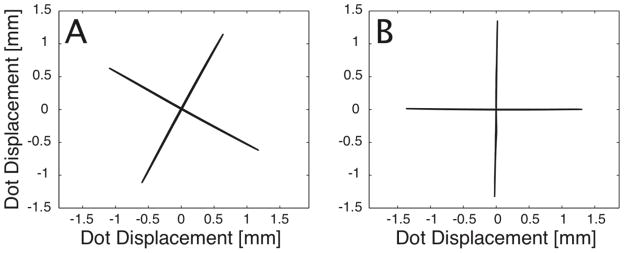
Figure 5A shows the steady state responses of the scanning fiber to an input, 4 V at 5040 Hz, applied to one of the two pairs virtual electrodes individually. It is evident from these resulting response motions that the cross coupling previously measured has been almost completely eliminated with the application of actuation through the virtual electrodes. Figure 5B shows the steady state virtual electrode response motion after mapping the eigen direction response to line up with the PSD axes.
Figure 5.
Experimental data that (A) shows the response of actuating the scanning fiber with the virtual electrodes. (B) maps the response motion to line up with the PSD axes.
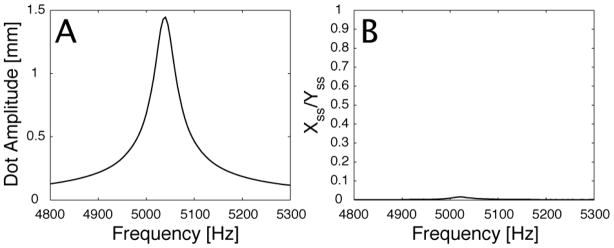
Figure 6A shows the frequency response of the scanning fiber to a 4 V input applied to the VE2 virtual electrode. The response of the transformed scanning fiber system was measured by the Y-axis of the PSD. Figure 6B shows the near complete removal of whirling near the resonant frequency of the scanning fiber by actuation with the virtual electrodes. The experimental data presented in Figure 6B was generated by actuating the scanning fiber with a 4 V input applied the VE2 virtual electrode and mapping the response to the Y-axis of the PSD. At each frequency value the maximum steady state displacement along the X and Y-axes of the PSD were measured and used to calculate the response ratio.
Figure 6.
Experimental data showing (A) the frequency response of the scanning fiber system. (B) the ratio of whirling motion present in the frequency response using whirl free excitation.
6 Amplitude and Frequency Relationship
In order to achieve efficient scanning, the time between successive outward spiral scans has to be minimized. Stopping the motion of the scanning fiber between each frame was done with the same actuators that are used for scanning. Motion braking consists of several cycles of uniform amplitude sinusoid input, applied by the virtual electrodes, that perfectly counteracts the tip motion of the scanning fiber. For motion braking to work correctly, the frequency of the motion braking input needed to match the damped natural frequency of the free motion of the scanning fiber. Without an exact match between damped natural frequency of the scanning fiber and the motion braking drive frequency the tip displacement of the scanning fiber will increase once the forced response becomes larger than the free response. Therefore, an accurate identification of the damped natural frequency of the scanning fiber during free decay is critical.
The experimental data shown in Figure 7 represents laser dot amplitude versus damped natural frequency as the optical fiber’s motion decays freely. Figure 7A shows roughly a 15 Hz frequency shift as the amplitude decreases to less than 0.25 mm on the X-axis of the PSD, while Figure 7B shows roughly a 40 Hz frequency shift as the amplitude decreases to less than 0.45 mm on the Y-axis of the PSD. The frequency values shown in Figure 7 were obtained by observing the time between successive zero crossings of the PSD axes of the light spot projected from the scanning fiber during free decay.
Figure 7.
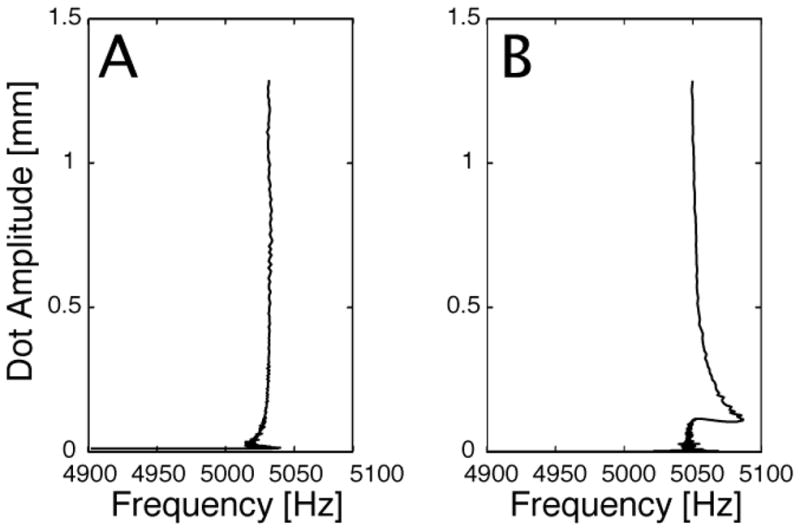
Experimental data showing the measured damped natural frequency of the untransformed scanning fiber system as a function of free decay amplitude (A) from the perspective of the X-axis of the PSD. (B) from the perspective of the Y-axis of the PSD.
In subsequent investigations, it was found that actuating the scanning fiber with the virtual electrodes and mapping the response to the PSD axes significantly reduced the seemingly non-constant relationship between the amplitude of the scanning fiber and the observed damped natural frequency during free decay. The change in observed frequency of the transformed scanning fiber system is shown in Figures 8A and 8B in reference to the X and Y PSD axes, respectively. Figure 8 shows that the damped natural frequency was essentially independent of the tip amplitude of the fiber, with a variation in frequency of less than 3 Hz for over 98% of the amplitude variation.
Figure 8.
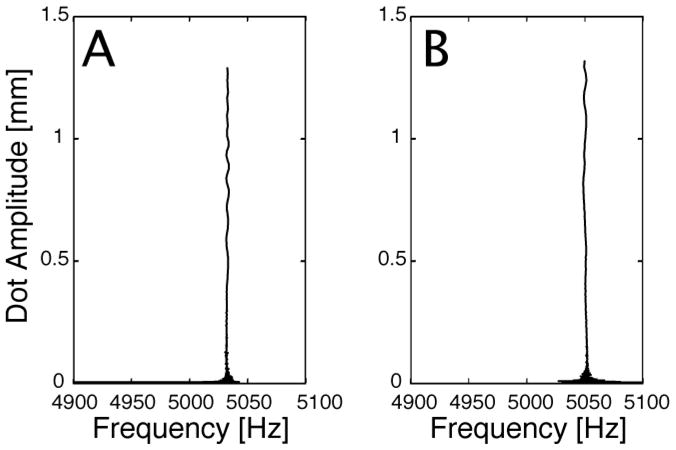
Experimental data showing the measured damped natural frequency of the transformed scanning fiber system as a function of free decay amplitude (A) from the perspective of the X-axis of the PSD. (B) from the perspective of the Y-axis of the PSD.
The non-constant relationship shown in Figure 7 can be attributed to free motion whirling and the method for measuring frequency. The vibration frequency was measured by timing successive zero crossings using the axes of the silicon position sensitive detector. The non-periodic whirling motion during the free motion caused the time between crossings on one axis to decrease while the time between crossings on the other axis to increase. When the scanning fiber was forced into one of the unidirectional system eigen directions the free motion response remained aligned with the eigen direction and the free vibration frequency became independent of tip amplitude.
7 System Linearity
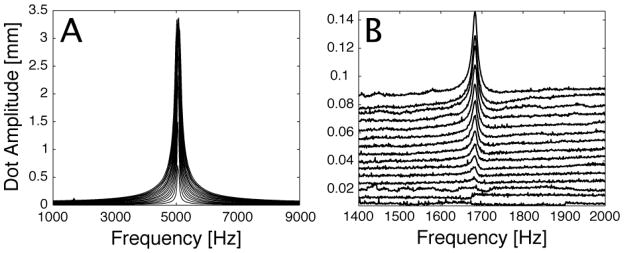
As previously stated the whirling of the fiber during normal operation is not due nonlinear behavior of the fiber contrary to what is described in [8–10]. This was established by increasing the input drive voltage applied to the virtual electrodes nearly eightfold of the normal maximum. A maximum voltage level of 30 V was used to limit the risk in depoling the piezoelectric material. Figure 9A shows a series of frequency response data for the scanning fiber that correspond to incrementally increasing the drive voltage amplitude, from 2 V to 30 V, applied to the VE2 virtual electrode. The first resonant peak, centered around 5039 Hz, is symmetric and does not have any indication of softening or hardening characteristics. Barely visible at 1680 Hz is the one-third, f1/3, super harmonic that results from driving the scanning fiber with large base excitation.
Figure 9.
Experimental data showing the (A) frequency response of the scanning fiber system to incremental increases of the drive voltage amplitude from 2 V to 30 V applied to the VE2 virtual electrode. (B) isolation of the one-third super harmonic.
The peak amplitude of the one-third super harmonic was roughly 66 times smaller than the peak amplitude of the first resonant peak for equal excitation voltages. It is worth noting that the one-third super harmonic was an actual nonlinear response of the scanning fiber system was not a nonlinearity induced by the amplifier used to actuate the piezo-tube actuator. The amplifier was tested for nonlinear response at typical scanning fiber voltage levels as well as at elevated levels, resulting in no significant response three times the actuation frequency.
The one-third super harmonic can be seen more clearly in Figure 9B and only became visible when the input drive voltage was greater than 10 V, which was twice the normal excitation level. The symmetric appearance of the main resonance peak in conjunction with the lack of significant super harmonic response for normal excitation levels gives strong indication that the system was indeed linear.
8 System Parameter Identification
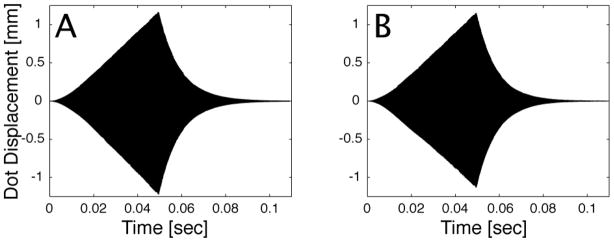
Once the virtual electrodes, VE1 and VE2, that drive the scanning fiber in the eigen direction axes were identified the characteristic system parameters for efficient actuation were determined. These parameters were the damped natural frequency of the scanning fiber system along the eigen direction axes and the braking phase. With these parameters identified, the scanner can be controlled efficiently and predictably. The phase is required in order to start the motion braking input at the correct point to counteract the motion of the tip of the scanning fiber. Figures 10A and 10B show 250 cycles of scanning fiber response to a linearly increasing amplitude modulated sinusoidal input followed by 300 cycles of free decay.
Figure 10.
Experimental data showing the time history of the transformed scanning fiber system during outward scanning followed by a period of free decay (A) for the X-axis. (B) for the Y-axis.
Immediately before the onset of free decay, two displacement observations were made to determine the phase of the scanning fiber. During the free decay of the scanning fiber the damped natural frequency for each eigen direction was calculated by observing the time between successive zero crossings. The tip displacement, the natural frequency values and the sampling rate were used to calculate the instantaneous velocity and phase needed to start motion braking, φbr, which is given by:
| (6) |
where the constants Aj and Bj are functions of fiber tip displacement, velocity, and natural frequency given by:
| (7) |
| (8) |
where xtbj and vtbj are the tip displacement and velocity at the start of braking, respectively, tb is the time at the onset of braking, and ωdj is the damped natural frequency in the jth eigen direction.
Precise identification of the natural frequencies and phase allows the fiber to be stopped in a few cycles as can be seen in Figures 11A and 11B. Both figures show 250 cycles of scanning fiber response to linearly increasing amplitude modulated sinusoidal inputs followed by five cycles of motion braking that reduced the motion of the scanning fiber by 99.80% from its maximum displacement. At the conclusion of the motion braking cycles, the system was allowed to vibrate freely.
Figure 11.
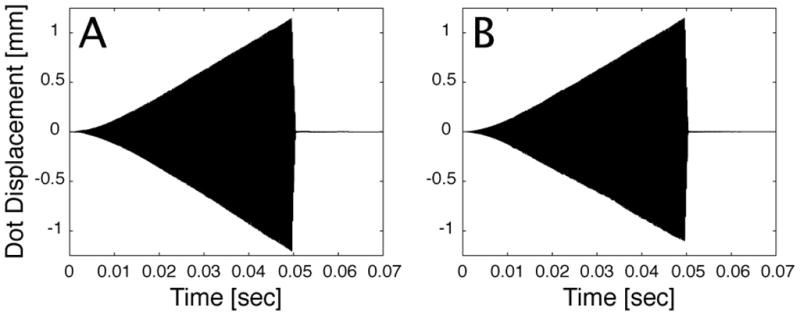
Experimental data showing the time history of the transformed scanning fiber system during outward scanning followed by motion braking with precise parameter identification (A) for the X-axis. (B) for the Y-axis.
Obtaining accurate estimates of the natural frequencies and phase are important for good braking performance. Figures 12A and 12B show the consequences of small errors in these parameters. Both figures show 250 cycles of scanning fiber response to linearly increasing amplitude modulated sinusoidal input followed by seven cycles of motion braking with misidentified natural frequency values, the braking drive frequencies were set 5 Hz higher than the measured damped natural frequency values. Figures 12A and 12B show the amplitude of the scanning fiber decreases roughly 40% very quickly, but then changes direction and starts increasing in amplitude after roughly five cycles of motion braking. The scanning fiber is then allowed to decay freely after the motion braking cycles end.
Figure 12.
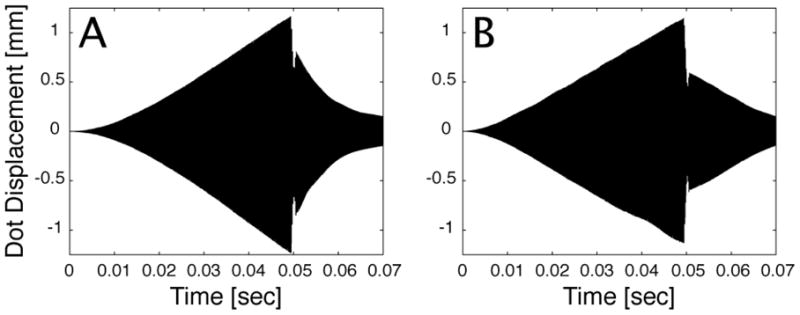
Experimental data showing the time history of the transformed scanning fiber system during outward scanning followed by motion braking with parameter misidentification (A) for the X-axis. (B) for the Y-axis
8 Conclusions
In this article we addressed the problem of eliminating whirling motion during open loop control of a scanning fiber. The scanning fiber system exhibited a significant amount of multi-directional response motion when subjected to unidirectional excitation from a quadrant piezoelectric tube attached to the root of the optical fiber. Similarly, whirling of the fiber ensued when the piezo-tube actuation was stopped. Previous researchers concluded that the whirling motion seen near resonance was the result of nonlinear effects caused by large beam displacements. Based on these results, whirling motion of the scanning fiber was not due to nonlinearities, but due to non-symmetry within the cantilevered optical fiber, piezoelectric tube actuator and the epoxy join coupling them.
Our inability to force the scanning optical fiber into unidirectional response with either real pair of parallel electrodes led to the concept and development of virtual electrodes. The virtual electrodes are a combination of the four real micro-electrodes with imperfect geometry that actuate the scanning fiber system along its two eigen directions. This results in response motion free of cross coupling in both eigen directions, which means the unidirectional response motion of the two system eigen directions are orthogonal to each other. The forced whirling motions previous researchers observed in cantilever beams near resonance were completely eliminated once the actuation voltages were applied through the virtual electrodes. The motion of the scanning fiber remained unidirectional when the voltages applied to the virtual electrodes were increased nearly eightfold the normal operational values.
Actuating the scanning fiber system with the virtual electrodes identified of the system’s eigen response directions, which then allowed for the alignment of these eigen directions with the axes of the position sensitive detector. Before this axis alignment, the measured free motion decay frequency changed as the tip amplitude decreased. When the eigen directions of the scanning fiber were aligned with the axes of the position sensitive detector, the observed free vibration frequency became independent of tip amplitude. This independent relationship is beneficial for two reasons. First the motion braking drive frequency can remain constant for the duration and secondly the entire period of free decay does not need to be measured to accurately identify the damped natural frequency.
The newly achieved ability to actuate the scanning fiber system in two orthogonal directions without cross coupling greatly improved the ability to effectively control the motion of the scanning fiber with open loop control. The standard outward scanning trajectory for the scanning fiber was a spiral scan pattern. Creating this spiral scan pattern was greatly simplified by using the virtual electrodes. Voltage applied to one virtual electrode produced a displacement in one axis of motion that did not effect the displacement of the second axis of motion due to cross coupling. Similarly, the motion braking input required to quickly stop the motion of the scanning fiber was applied to one virtual electrode axis without interfering with the motion braking of the second axis.
Acknowledgments
The National Cancer Institute, NIH R33CA094303 (PI-Seibel) and R01EB008119 (PI-Seibel) provided funding for this work, and prototype development was funded in part from PENTAX (HOYA Corp., Tokyo, Japan). C.D. Melville and R.S. Johnston provided the custom fabricated prototype used for testing and for helpful discussions.
Footnotes
Publisher's Disclaimer: This is a PDF file of an unedited manuscript that has been accepted for publication. As a service to our customers we are providing this early version of the manuscript. The manuscript will undergo copyediting, typesetting, and review of the resulting proof before it is published in its final citable form. Please note that during the production process errors may be discovered which could affect the content, and all legal disclaimers that apply to the journal pertain.
References
- 1.Haight EC, King WW. Stability of Nonlinear Oscillations of an Elastic Rod. Journal of the Acoustical Society of America. 1972;52(3):899–911. [Google Scholar]
- 2.Hyer MW. Whirling of a Base-Excited Cantilever Beam. Journal of Acoustical Society of America. 1979;65(4):931–939. [Google Scholar]
- 3.Crespo da Silva MRM, Glynn CC. Nonlinear Flexural-Flexural-Torsional Dynamics of Inextensional Beams I & II. Journal of Structural Mechanics. 1978;6(4):437–461. [Google Scholar]
- 4.Pai PF, Nayfeh AH. Non-Linear Non-Planar Oscillations of a Cantilever Beam Under Lateral Base Excitation. International Journal of Non-Linear Mechanics. 1990;25(5):455–474. [Google Scholar]
- 5.Nayfeh SA, Nayfeh AH. Energy Transfer From High- to Low-Frequency Modes in a Flexible Structure via Modulation. Journal of Vibration and Acoustics, Transactions of the ASME. 1994;116(2):203–207. [Google Scholar]
- 6.Krauss RW, Nayfeh AH. Experimental Nonlinear Identification of a Single Mode of a Transversely Excited Beam. Nonlinear Dynamics. 1999;18(1):69–87. [Google Scholar]
- 7.Oueini SS, Nayfeh AH. Single-Mode Control of a Cantilever Beam Under Principal Parametric Excitation. Journal of Sound and Vibration. 1999;224(1):33–47. [Google Scholar]
- 8.Smithwick QYJ, Vagners J, Reinhall PG, Seibel EJ. A Nonlinear State-Space Model of a Resonating Single Fiber Scanner for Tracking Control: Theory and Experiment. Transactions – American Society of Mechanical Engineers Journal of Dynamic Systems Measurement and Control. 2004;126(3):88–101. [Google Scholar]
- 9.Smithwick QYJ, Vagners J, Reinhall PG, Seibel EJ. An Error Space Controller for a Resonating Fiber Scanner: Simulation and Implementation. Transactions – American Society of Mechanical Engineers Journal of Dynamic Systems Measurement and Control. 2006;128(4):899–913. [Google Scholar]
- 10.Smithwick QYJ, Vagners J, Johnston RS, Seibel EJ. A Hybrid Nonlinear Adaptive Tracking Controller for a Resonating Fiber Microscanner. Transactions – American Society of Mechanical Engineers Journal of Dynamic Systems Measurement and Control. 2010;132(1):1–13. [Google Scholar]
- 11.Seibel EJ, Johnston RS, Melville CD. A Full-Color Scanning Fiber Endoscope. Optical Fibers and Sensors for Medical Diagnostics and Treatment Applications VI – Proceedings of SPIE. 2006;6083:608303. [Google Scholar]
- 12.Seibel EJ. 1-mm Catheterscope. Optical Fibers and Sensors for Medical Diagnostics and Treatment Applications VIII – Proceedings of SPIE. 2008;6852:685207. [Google Scholar]
- 13.Seibel EJ, Brown CM, Dominitz JA, Kimmey MB. Scanning Single Fiber Endoscopy: A new platform technology for integrated laser imaging, diagnosis, and future therapies. GI Endoscopy Clinics of North America. 2008;18(3):467–478. doi: 10.1016/j.giec.2008.05.001. [DOI] [PMC free article] [PubMed] [Google Scholar]
- 14.Seibel EJ, Carroll RE, Dominitz JA, Johnston RS, Melville CD, Lee CM, Seitz SM, Kimmey MB. Tethered Capsule Endoscopy, A Low-Cost and High-Performance Alternative Technology for the Screening of Esophageal Cancers and Barrett’s Esophagus. IEEE Transactions on Biomedical Engineering. 2008;55(3):1032–1042. doi: 10.1109/TBME.2008.915680. [DOI] [PubMed] [Google Scholar]
- 15.Love AEH. A Treatise on the Mathematical Theory of Elasticity. Dover Publications; 1944. [Google Scholar]
- 16.Ewing MS. Another Second Order Beam Vibration Theory: Explicit Bending Warping Flexibility and Restraint. Journal of Sound and Vibration. 1990;137(1):43–51. [Google Scholar]


