Abstract
Background
The advent of fluorescent nanosensors has enabled intracellular monitoring of several physiological analytes, which was previously not possible with molecular dyes or other invasive techniques. We have extended the capability of these sensors to include the detection of small molecules with the development of glucose-sensitive nano-optodes. Herein, we discuss the design and development of glucose-sensitive nano-optodes, which have been proven functional both in vitro and in vivo.
Methods
Throughout the design process, each of the sensor formulations was evaluated based on their response to changes in glucose levels. The percent change in signal, sensor reversibility, and the overall fluorescence intensity were the specific parameters used to assess each formulation.
Results
A hydrophobic boronic acid was selected that yielded a fully reversible fluorescence response to glucose in accordance with the sensor mechanism. The change in fluorescence signal in response to glucose was approximately 11%. The use of different additives or chromophores did not improve the response; however, modifications to the plasticized polymeric membrane extended sensor lifetime.
Conclusions
Sensors were developed that yielded a dynamic response to glucose and through further modification of the components, sensor lifetime was improved. By following specific design criteria for the macrosensors, the sensors were miniaturized into nano-optodes that track changes in glucose levels in vivo.
Keywords: boronic acid, bulk optodes, fluorescent sensors, glucose monitoring
Introduction
Current continuous glucose monitoring systems rely primarily on electrochemical biosensors using glucose oxidase and glucose dehydrogenase.1,2 These implantable sensors monitor glucose levels in the blood or interstitial fluid by measuring the oxidation of glucose in enzymatic reactions. Their longterm use, however, has been hampered by sensor degradation due to, in part, foreign body responses at the sight of implantation.3–5 In an effort to improve sensor lifetime in vivo, murine models for testing implantable glucose sensors have been developed to understand the mechanisms for sensor degradation.5,6 Though improvements have been made, the dependence of the sensor mechanism on enzymatic reactions and electrochemical readout still remains a limitation.
In response to the shortcomings of current techniques, researchers have developed alternative methods such as optical approaches for continuously monitoring glucose levels. For example, glucose sensing contact lenses that use photonic crystal sensors are being developed for noninvasive glucose monitoring.7,8 These sensors swell in the presence of glucose, causing a shift in the diffraction wavelength of the sensor. Near-infrared spectroscopy can also be used to measure glucose noninvasively and has been successful in extracting glucose measurement information from transmission spectra across the human tongue.9 In other work, fluorescence resonance energy transfer can report changes in glucose concentrations using a competitive binding assay encapsulated by a hydrogel particle.10,11 In this article, we present the use of glucose nano-optodes based on ion-selective optode technology as a noninvasive glucose monitoring tool.
Since the 1960s, ion-selective electrodes (ISEs) have been developed to measure a variety of important physiological analytes.12 More recently, bulk optodes have been developed as an optical counterpart to electronic ISEs. These optodes are composed of a plasticized polymeric membrane in which recognition elements, fluorescent indicators, and additives are encapsulated.12,13 Mechanistically, optodes function through the bulk extraction of an analyte into the membrane by the recognition element. This extraction causes a concentration change within the membrane and alters the optical signal of the optode. For example, in the case of ion-selective optodes, extraction of ions generates a shift in the pH within the membrane. In order to maintain the charge balance of the membrane, the protonation state of the chromophore changes resulting in a measurable change in the optical signal.12,13 Through the use of different recognition elements and fluorescent molecules, bulk optodes have been developed for measuring sodium, potassium, calcium, chloride, and a host of other analytes.12 Furthermore, this technology has been miniaturized and developed into fluorescent nanosensors that have enabled the intracellular measurements of several physiological analytes.14–21
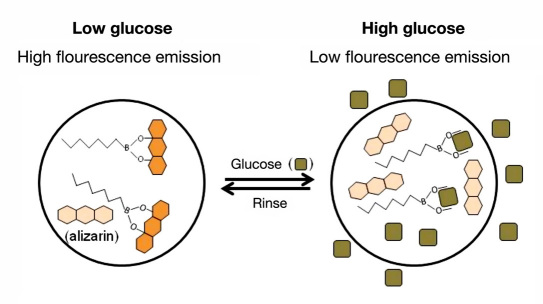
We have reported on the development of glucose-sensitive nano-optodes that extend ion-selective optode technology to the detection of small molecules.22 In our glucose nano-optodes, dynamic changes in glucose concentrations are monitored using a competitive-binding scheme between a hydrophobic boronic acid recognition molecule, a chromophore, and glucose.23,24 In the absence of glucose, the boronic acid is bound to the diol-containing alizarin, generating a fluorescent complex (Figure 1 ). When glucose is introduced into the system, glucose binds with the boronic acid, displacing the alizarin which renders it nonfluorescent. Competitive binding of this sort has been used in the development of other saccharide sensors23,25 and exploits the well-established affinity of boronic acids for diol moieties.26,27 Unlike other assays using this principle, our sensor components are encapsulated in a hydrophobic polymeric membrane imparting such benefits as decreased interference from other biomolecules,17 the use of nonbiological components, and sensor reversibility.22 The sensors are miniaturized to the nanoscale where the response time is on the order of seconds to minutes22 and it is possible to implant the sensors into the skin much like a tattoo. Thus far, we have demonstrated the functionality of these sensors both in vitro and in vivo,22 and we discuss herein the detailed development of the sensor formulation and optimization.
Figure 1.
Representation of the sensor mechanism. At low glucose concentrations, the boronic acid is bound to alizarin, generating a highly fluorescent species. As the concentration of glucose increases, glucose is extracted into the sensor displacing the alizarin resulting in a nonfluorescent species.
Materials and Methods
Materials
Bis(2-ethylhexyl) sebacate (DOS) (≥97.0%), 2-nitrophenyl octyl ether (NPOE) (≥99.0%), dipentyl phthalate (DPP) (≥99.0%), tris(2-ethylhexyl) phosphate (TEP) (≥99.0%), tetrabutylammonium bromide (TBAB) (≥99.0%), tetrabutyl ammonium chloride (TBAC) (≥99.0%), tetrabutyl-ammonium iodide (TBAI), N-(3-dimethyl-aminopropyl)-N’-ethylcarbodiimide hydrochloride (EDC·HCl) (≥98.0%), poly(vinyl chloride) (high molecular weight) (PVC), alizarin red S (ARS), and polyurethane (PUR) were all obtained from Fluka (St. Louis, MO). Alizarin, tetrahydrofuran anhydrous (THF) (≥99.9%), D-(+)-glucose (ACS reagent grade), dichloromethane (DCM), thionyl chloride (SOCl2), pyridine (PY), and 2-propanol (IPA) (≥99.5%) were purchased from Sigma-Aldrich Corp. (St. Louis, MO). 4-mercaptophenyl-boronic acid (90%), 3-octanone, polycaprolactone (PCL), octylamine (99%), and 7,8-dihydroxy-4-methyl-coumarin (7,8-DHMC) (97%) were purchased from Sigma-Aldrich Corp. Octylboronic acid (>97%) was obtained from Synthonix, Inc. (Wake Forest, NC). Phosphate-buffered saline (PBS) (1×, pH 7.4) was purchased as a solution from Invitrogen Corp. (Carlsbad, CA). N,N-dimethylformamide (DMF) (≥99%) and alizarin-3-methyliminodiacetic acid were acquired from Sigma-Aldrich Corp. Poly(vinylidene chloride/acrylonitrile) (P(VDC/AN) (80:20) was purchased from Polysciences, Inc. (Warrington, PA) and α,ω-dicarboxy terminated poly(methyl methacrylate) (PMMA(COOH)2) was obtained from Polymer Source Inc. (Montreal, Canada). Commercially available materials were used without further purification.
Polymer Composition of the Optode
The optode from which the glucose sensors are made contains five main components: polymer, plasticizer, boronic acid derivative, chromophore, and additive. The design of the sensor was obtained by optimizing each component. In all cases, the basic polymer optode was made from the following components: 30 mg of polymer, 60 μl of plasticizer, a boronic acid derivative, an additive, and a chromophore (see Tables 1–5 ). These materials were charged into a glass vial and then dissolved in 500 μl of THF. All formulations listed in Tables 1–5 formed optodes. Formulations that did not form optodes such as those containing poly(methyl methacrylate) have been excluded from the tables. Of note, composition is reported in mass as is standard in optode formulations.
Table 1.
Composition of Optodes with Different Boronic Acids
| Polymer | Plasticizer | Boronic acid | Additive | Chromophore |
|---|---|---|---|---|
| PVC | NPOE | 1 mg 4-mercaptophenylboronic acid | 0.5 mg TDMAC | 1 mg alizarin |
| PVC | NPOE | 5 mg 2-ethoxypyridine-3-boronic acid | 1 mg TDMAC | 0.5 mg alizarin |
| PVC | NPOE | 1 mg octylboronic acid | 1 mg TDMAC | 1 mg alizarin |
| PVC | NPOE | 1 mg 3-aminophenylboronic acid | 0.5 mg TDMAC | 1 mg alizarin |
Table 2.
Composition of Optodes with Different Additives
| Polymer | Plasticizer | Boronic acid | Additive | Chromophore |
|---|---|---|---|---|
| PVC | NPOE | 1 mg octylboronic acid | 0.5 mg TBAC | 1 mg alizarin |
| PVC | NPOE | 1 mg octylboronic acid | 0.5 mg TBAB | 1 mg alizarin |
| PVC | NPOE | 1 mg octylboronic acid | 0.75 TBAI | 1 mg alizarin |
| PVC | NPOE | 1 mg octylboronic acid | 1 mg TDMAC | 1 mg alizarin |
Table 3.
Composition of Optodes with Different Polymers
| Polymer | Plasticizer | Boronic acid | Additive | Chromophore |
|---|---|---|---|---|
| PVC-COOH | DOS | 3 mg octylboronic acid | 4 mg TDMAC | 1 mg alizarin |
| PVC | DOS | 3 mg octylboronic acid | 4 mg TDMAC | 1 mg alizarin |
| P(VDC/AN) | DOS | 3 mg octylboronic acid | 4 mg TDMAC | 1 mg alizarin |
| PMMA(COOH)2 | DOS | 3 mg octylboronic acid | 4 mg TDMAC | 1 mg alizarin |
| PCL | DOS | 3 mg octylboronic acid | 4 mg TDMAC | 1 mg alizarin |
| PUR | DOS | 3 mg octylboronic acid | 4 mg TDMAC | 1 mg alizarin |
Table 4.
Composition of Optodes with Different Plasticizers
| Polymer | Plasticizer | Boronic acid | Additive | Chromophore |
|---|---|---|---|---|
| PVC-COOH | DOS | 3 mg octylboronic acid | 4 mg TDMAC | 1 mg alizarin |
| PVC-COOH | NPOE | 3 mg octylboronic acid | 4 mg TDMAC | 1 mg alizarin |
| PVC-COOH | DPP | 3 mg octylboronic acid | 4 mg TDMAC | 1 mg alizarin |
| PVC-COOH | 3-octanone | 3 mg octylboronic acid | 4 mg TDMAC | 1 mg alizarin |
| PVC-COOH | TEP | 3 mg octylboronic acid | 4 mg TDMAC | 1 mg alizarin |
Chromophore Synthesis
Compound A was prepared by initially treating ARS with SOCl2 at 40 °C (Figure 2 ). After 65 hours, the reaction was cooled and PY and IPA were added directly to the mixture. The flask was then heated at 65 °C for an additional 18 hours. Upon cooling and removal of all volatiles, a brown powder was yielded. The crude product was used directly without further purification.
Figure 2.
Synthesis of Compound A.
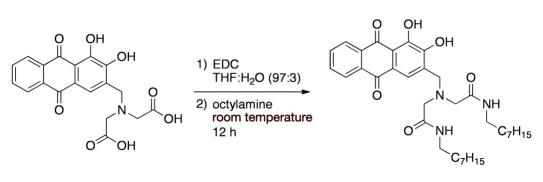
Compound B was prepared via reacting EDC·HCl with alizarin-3-methyliminodiacetic acid followed by the addition of octylamine at room temperature (Figure 3 ). After 12 hours, solvents were removed and the crude product was used without further purification.
Figure 3.
Synthesis of Compound B.
Macrosensor Response to Glucose
The fluorescence data was acquired on a Spectramax Gemini EM microplate fluorometer (Molecular Device Inc., Sunnyvale, CA). The excitation and emission wavelengths for the chromophores are listed in Table 5 . Optode (2 μl) from each formulation listed above was pipetted onto a glass cover slip on the bottom of a 96-well optical bottom well-plate. The optodes were allowed to dry for at least 15 minutes forming macrosensors. After drying, each optode was hydrated in 200 μl of PBS (pH 7.4) for at least 1 hour in order to equilibrate the sensors with the surrounding aqueous solution. After the optodes were hydrated, the PBS solution was removed from all wells and 200 μl of 1 M (18,000 mg/dl) glucose in PBS (pH 7.4) was added to the experimental wells and 200 μl of fresh PBS was added to the control wells. High glucose concentrations were used to obtain the maximum fluorescence response from the sensors. Fluorescence measurements were taken with a 360-μs acquisition time at a sampling rate of 13 acquisitions per hour. The fluorescence response of the sensors was tracked for at least 60 minutes, at which time the fluorescence signal leveled off.22 At the end of this period, both the PBS and 1 M glucose solution were removed and 200 μl of fresh PBS was added to all wells. Fluorescence measurements were acquired again in 360 μs acquisition times at a sampling rate of 13 acquisitions per hour. For each macrosensor, an average intensity was calculated from the final 2–3 intensity readings after the signal leveled off. This average was normalized to the average intensity reading from the initial solution change. By normalizing the intensities of each sensor, the responses between the control and experimental wells and also between different sensor formulations could be compared. The normalized values for each sensor were then averaged for both the control and glucose wells, respectively. The percent change in fluorescence response was then determined as the difference between the average normalized values. This value, which is typically negative, was inverted for purposes of presenting a clear graphical representation of the data.
Table 5.
Composition of Optodes with Different Chromophores
| Polymer | Plasticizer | Boronic acid | Additive | Chromophore | Excitation/Emission wavelengths (nm) |
|---|---|---|---|---|---|
| PVC-COOH | DOS | 1 mg octylboronic acid | 1 mg TDMAC | 1 mg alizarin | 460/570 |
| PVC-COOH | DOS | 1 mg octylboronic acid | 1 mg TDMAC | 1 mg 7,8-DHMC | 360/470 |
| PVC-COOH | DOS | 1 mg octylboronic acid | 1 mg TDMAC | 1 mg ARS | 420/590 |
| PVC-COOH | DOS | 1 mg octylboronic acid | 1 mg TDMAC | 1 mg Compound A | 420/590 |
| PVC-COOH | DOS | 1 mg octylboronic acid | 1 mg TDMAC | 1 mg Compound B | 460/570 |
Results
Sensor Response and Reversibility
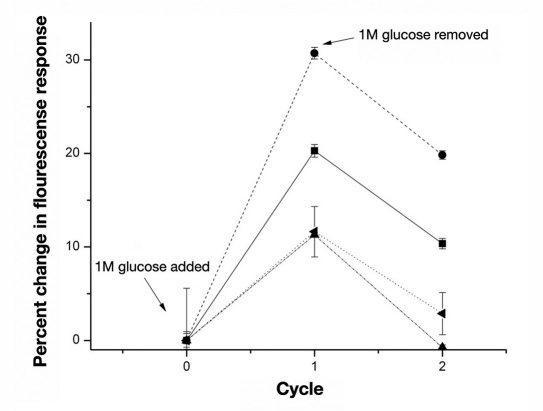
In our sensors, boronic acid derivatives are the main recognition elements and are responsible for the dynamic fluorescence response to glucose. Due to its importance, boronic acid selection was the starting point for the glucose sensor design. Figure 4 shows the percent change in fluorescence response and reversibility for macrosensors containing different boronic acids. Each sensor formulation showed a response to glucose. 2-ethoxy-pyridine-3-boronic acid had the greatest percent change of 30.7 ± 0.6%, but only sensors with octylboronic acid demonstrated almost full fluorescence reversibility as their fluorescence intensities recovered back to baseline after glucose was removed. Since octylboronic acid yielded a response complying with the sensor mechanism, all further sensor formulations used this boronic acid as the main sensing component.
Figure 4.
Reversibility of the glucose macrosensors composed of different boronic acids. Each cycle represents a time frame of at least 1 hour. The macrosensors contained either 4-mercaptophenylboronic acid (■, ncontrol = 7 and nglucose = 7), 2-ethoxypyridine-3-boronic acid (●, ncontrol = 6 and nglucose = 7), octylboronic acid (▲, ncontrol = 8 and nglucose = 8), or 3-aminophenylboronic acid (◄, ncontrol = 8 and nglucose = 8).
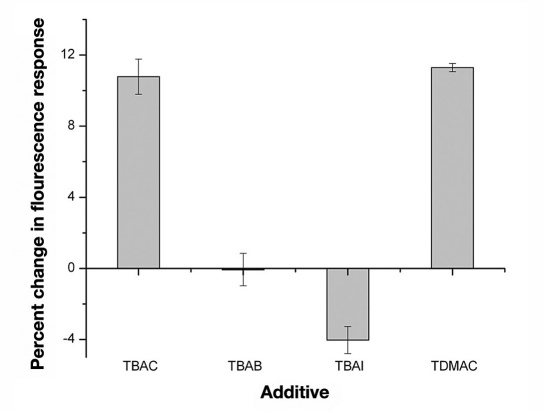
Though octylboronic acid yielded a reversible fluorescence response to glucose, further modifications to the design were necessary to increase the percent change in fluorescence upon addition of glucose. We explored the use of several additives that could aid in the extraction of glucose into the sensor. TBAC and TDMAC showed the two greatest responses to changes in glucose concentrations with 10.8 ± 1.0% and 11.3 ± 0.2% decreases, respectively (Figure 5 ). TDMAC with its extended carbon chains was selected as the additive because we speculated that it would be less predisposed than TBAC to leach out of the sensor.
Figure 5.
Percent change in fluorescence of the macrosensors in response to glucose after at least 1 hour. The macrosensors contained either the additive TBAC (ncontrol = 7 and nglucose = 8), TBAB (ncontrol = 8 and nglucose = 8), TBAI (ncontrol = 8 and nglucose = 8), or TDMAC (ncontrol = 8 and nglucose = 8).
Fluorescence Intensity Optimization
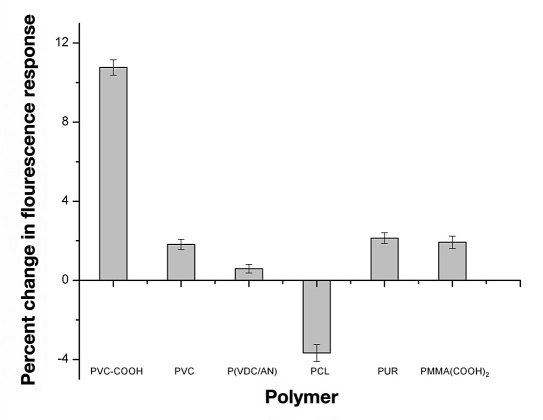
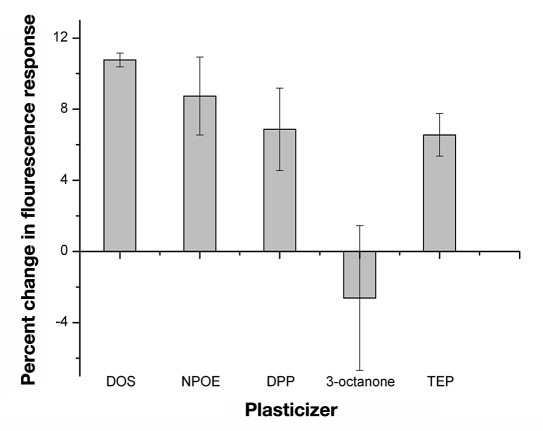
Sensors composed of the traditional plasticized-PVC-based polymeric membrane yielded the desired response to glucose; however, these sensors began to lose their fluorescence intensity immediately upon hydration (data not shown). Since the octylboronic acid and alizarin combination followed the sensor mechanism, changing the plasticized polymeric membrane was the initial method used to stabilize the fluorescence intensity and improve sensor lifetime. Substituting PVC-COOH for PVC drastically improved sensor lifetime. These sensors not only maintained their fluorescence intensities for up to 18 hours (data not shown), but they also yielded the greatest response (10.8 ± 0.4%) to glucose after this time period (Figure 6 ). In contrast to changing the polymer, dramatic differences in response were not seen with a variety of plasticizers (Figure 7 ); however, DOS was chosen as the plasticizer because it yielded the greatest relative change.
Figure 6.
Percent change in fluorescence of the macrosensors in response to glucose after at least 1 hour. The macrosensors contained either the polymer PVC-COOH (ncontrol = 7 and nglucose = 6 ), PVC (ncontrol = 7 and nglucose = 8), P(VDC/AN) (ncontrol = 9 and nglucose = 9), PCL (ncontrol = 6 and nglucose = 6), PUR (ncontrol = 7 and nglucose = 8), or PMMA(COOH)2 (ncontrol = 6 and nglucose = 6).
Figure 7.
Percent change in fluorescence of the macrosensors in response to 1 M glucose in PBS after at least 1 hour. The macrosensors contained either the plasticizer DOS (ncontrol = 7 and nglucose = 6), NPOE (ncontrol = 8 and nglucose = 8), DPP (ncontrol = 8 and nglucose = 8), 3-octanone (ncontrol = 8 and nglucose = 8), or TEP (ncontrol = 8 and nglucose = 8).
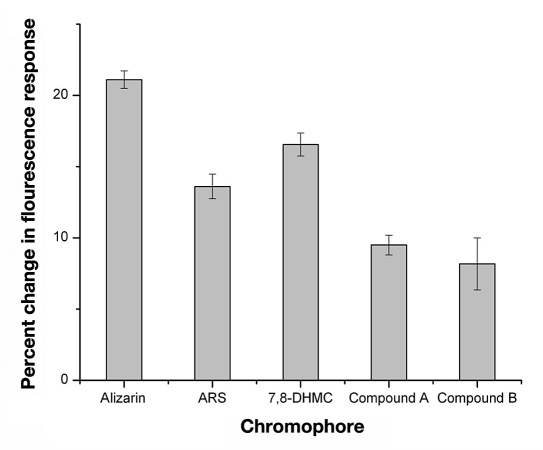
Similar to the selection of the boronic acid, proper selection of the fluorescent indicator or chromophore is important because of the role it plays in the sensing mechanism. Alizarin’s fluorescence response was sufficient for the purpose of optimizing the other sensor components on the macroscale, but significant loss of fluorescence intensity occurs during sensor miniaturization. Therefore, hydrophobic high quantum yield fluorescent indicators are ultimately desired for sensor miniaturization. Alizarin derivatives and other diol chromophores were substituted for alizarin in the sensor formulation and were evaluated for maximum glucose response and maximum fluorescence intensity (Figure 8 ). Macrosensors with alizarin still had the greatest response to glucose with a percent change of 21.1 ± 0.6%.
Figure 8.
Percent change in fluorescence of the macrosensors in response to glucose after at least 1 hour. The macrosensors contained either the chromophore alizarin (ncontrol = 4 and nglucose = 3), ARS (ncontrol = 8 and nglucose = 8), 7,8-DHMC (ncontrol = 3 and nglucose = 3), Compound A (ncontrol = 8 and nglucose = 8), or Compound B (ncontrol = 8 and nglucose = 8).
Discussion
For an effective in vivo glucose monitoring tool, the sensors must (1) be reversible in order to measure dynamic changes in glucose concentration, (2) be sensitive to small changes in glucose concentrations, (3) have a red-shifted, high-fluorescence intensity that can be measured through the skin, and (4) have hydrophobic components that will not leach out of the sensor. These four parameters were considered for each screened sensor formulation; however, particular parameters were emphasized depending upon the sensor component being tested.
As is shown in Figure 4 , all the boronic acids bound glucose, causing a decrease in fluorescence intensity but only sensors with octylboronic acid recovered their fluorescence intensity fully. The inability of the other sensors to yield a reversible response may have been a result of leaching of the sensor components, as was the case for the hydrophilic molecule, 2-ethoxypyridine-3-boronic acid. This point emphasizes that hydrophobic components are essential for proper sensor function.
The sensitivity of the sensors can be improved through effective extraction of glucose into the sensor. In previous work on ion-selective optodes, the selectivity for specific analytes relied on the proper choice of the sensing molecule and the additive was included only to maintain electro-neutrality.13 In the case of the glucose sensors, the additive was used to aid in the phase transfer of glucose into the sensor. Additives based on tetraalkylammonium salts, especially quaternary ammonium chloride salts, have been shown to be effective in extracting saccharides from the aqueous phase into plasticized polymeric membranes.28,29 Our results support these earlier findings with sensors containing additives, TBAC or TDMAC, yielding the greatest percentage change in fluorescence intensity.
The response and lifetime of the sensors was improved by exploring different polymers. Substituting PVC-COOH for PVC stabilized the fluorescence signal while still generating a response to glucose. We theorize that the carboxyl groups help to maintain alizarin within the sensor and aid in the extraction of glucose. The mechanisms governing this and how the plasticizer, DOS, caused a greater sensor response are under investigation.
The chromophore also plays a critical role in the sensor mechanism and response. Research discussed earlier has shown that ARS can competitively bind with boronic acids in the presence of sugars.23–25 We explored using ARS as well as hydrophobic analogs of this chromophore that could be maintained within the sensor. Sensors containing alizarin demonstrated the greatest percent change in fluorescence when in the presence of glucose, and their fluorescence intensity remained stable over time. Other important selection criteria for the chromophore were that sensors had to have high fluorescence intensity and an emission spectrum in the near-infrared for optimal imaging of the sensors efficiently above the autofluorescence of the skin.30 For example, 7,8-DHMC yielded significantly higher fluorescence intensities than alizarin, but its spectrum is blue-shifted, making in vivo imaging difficult. Alizarin’s emission spectrum is centered around 570 nm, and we have demonstrated that these sensors can be imaged above the autofluorescence of mice skin.22
Proper selection of the sensor components not only determines the sensor functionality, but also extends sensor lifetime and stability. In order to achieve these, a major theme throughout the design process was the selection of hydrophobic-sensing components that can be maintained within the sensors. After PVC-COOH was incorporated into the sensor, leaching was reduced in the macrosensors. However, miniaturization of the sensors into nano-optodes accelerates component leaching because of the increase in the surface area to volume ratio of the nano-optodes.20 This leaching results in decreased sensitivity and eventual loss of sensor functionality.12 As can be seen from the selection of the sensor components, they all exhibit some degree of hydrophobicity, but exploring more hydrophobic components would likely improve sensor lifetime in vivo.
Conclusions
Glucose macrosensors based on ion-selective optode technology were designed that are capable of monitoring dynamic changes in glucose levels. We have chosen the sensor components primarily based on their ability to improve sensor response and fluorescence reversibility. The sensor formulation containing octylboronic acid, alizarin, TDMAC, DOS, and PVC-COOH fulfilled these design criteria and from this optode formulation, glucose nano-optodes were developed and tailored to respond within the physiological range.22 Furthermore, the nano-optodes from this formulation were able to track changes in glucose levels in vivo.22 These results are promising but further optimization of the sensors such as incorporating an internal reference dye, improving sensor sensitivity, and enhancing sensor biocompatibility are crucial developmental steps toward ultimate use in a clinical setting.
Acknowledgments
We would like to thank Kristi Shrestha and Michaela Meister for their assistance during the screening process.
Abbreviations
- ARS
alizarin red S
- DCM
dichloromethane
- DMF
N,N-dimethylformamide
- DOS
bis (2-ethylhexyl) sebacate
- DPP
dipentyl phthalate
- EDC·HCl
N-(3-dimethylaminopropyl)-N’-ethylcarbodiimide hydrochloride
- IPA
2-propanol
- ISE
ion-selective electrode
- NPOE
2-nitrophenyl octyl ether
- PBS
phosphate-buffered saline
- PCL
polycaprolactone
- PMMA(COOH)2
α,ω-dicarboxy terminated poly(methyl methacrylate)
- PUR
polyurethane
- PVC-COOH
poly(vinyl chloride) carboxylated
- PVC
poly(vinyl chloride)
- P(VDC/AN)
poly(vinylidene chloride/acrylonitrile)
- PY
pyridine
- 7,8-DHMC
7,8-dihydroxy-4-methylcoumarin
- SOCl2
thionyl chloride
- TBAB
tetrabutylammonium bromide
- TBAC
tetrabutylammonium chloride
- TBAI
tetrabutylammonium iodide
- TDMAC
tridodecylmethylammonium chloride
- TEP
tris(2-ethylhexyl)phosphate
- THF
tetrahydrofuran anhydrous
References:
- 1.Wang J. Electrochemical glucose biosensors. Chem Rev. 2008;108(2):814–825. doi: 10.1021/cr068123a. [DOI] [PubMed] [Google Scholar]
- 2.Heller A, Feldman B. Electrochemical glucose sensors and their applications in diabetes management. Chem Rev. 2008;108(7):2482–2505. doi: 10.1021/cr068069y. [DOI] [PubMed] [Google Scholar]
- 3.McGarraugh G. The chemistry of commercial continuous glucose monitors. Diabetes Technol Ther. 2009;11(Suppl 1):S17–S24. doi: 10.1089/dia.2008.0133. [DOI] [PubMed] [Google Scholar]
- 4.Pickup JC, Hussain F, Evans ND, Sachedina N. In vivo glucose monitoring: the clinical reality and promise. Biosens Bioelectron. 2005;20(10):1897–1902. doi: 10.1016/j.bios.2004.08.016. [DOI] [PubMed] [Google Scholar]
- 5.Klueh U, Liu Z, Cho B, Ouyang T, Feldman B, Henning TP, Kaur M, Kreutzer D. Continuous glucose monitoring in normal mice and mice with prediabetes and diabetes. Diabetes Technol Ther. 2006;8(3):412–412. doi: 10.1089/dia.2006.8.402. [DOI] [PubMed] [Google Scholar]
- 6.Klueh U, Kreutzer D. Murine model of implantable glucose sensors: a novel model for glucose sensor development. Diabetes Technol Ther. 2005;7(5):727–737. doi: 10.1089/dia.2005.7.727. [DOI] [PubMed] [Google Scholar]
- 7.Asher SA, Alexeev VL, Goponenko AV, Sharma AC, Lednev IK, Wilcox CS, Finegold DN. Photonic crystal carbohydrate sensors: low ionic strength sugar sensing. J Am Chem Soc. 2003;125(11):3322–3329. doi: 10.1021/ja021037h. [DOI] [PubMed] [Google Scholar]
- 8.Ben-Moshe M, Alexeev VL, Asher SA. Fast responsive crystalline colloidal array photonic crystal glucose sensors. Anal Chem. 2006;78(14):5149–5157. doi: 10.1021/ac060643i. [DOI] [PubMed] [Google Scholar]
- 9.Burmeister JJ, Arnold MA, Small GW. Noninvasive blood glucose measurements by near-infrared transmission spectroscopy across human tongues. Diabetes Technol Ther. 2000;2(1):5–16. doi: 10.1089/152091500316683. [DOI] [PubMed] [Google Scholar]
- 10.Russell RJ, Pishko MV, Gefrides CC, McShane MJ, Coté GL. A fluorescence-based glucose biosensor using concanavalin A and dextran encapsulated in a poly(ethylene glycol) hydrogel. Anal Chem. 1999;71(15):3126–3132. doi: 10.1021/ac990060r. [DOI] [PubMed] [Google Scholar]
- 11.Rounds RM, Ibey BL, Beier HT, Pishko MV, Cote GL. Microporated PEG spheres for fluorescent analyte detection. J Fluoresc. 2007;17(1):57–63. doi: 10.1007/s10895-006-0143-3. Jan. [DOI] [PubMed] [Google Scholar]
- 12.Bakker E, Buhlmann P, Pretsch E. Carrier-based ion-selective electrodes and bulk optodes. 1. General characteristics. Chem Rev. 1997;97(8):3083–3132. doi: 10.1021/cr940394a. [DOI] [PubMed] [Google Scholar]
- 13.Johnson RD, Bachas LG. Ionophore-based ion-selective potentiometric and optical sensors. Anal Bioanal Chem. 2003;376(3):328–341. doi: 10.1007/s00216-003-1931-0. [DOI] [PubMed] [Google Scholar]
- 14.Brasuel MG, Miller TJ, Kopelman R, Philbert MA. Liquid polymer nano-PEBBLEs for Cl- analysis and biological applications. Analyst. 2003;128(10):1262–1267. doi: 10.1039/b305254k. [DOI] [PubMed] [Google Scholar]
- 15.Clark HA, Barker SLR, Brasuel MG, Miller MT, Monson E, Parus S, Shi ZY, Song A, Thorsrud B, Kopelman R, Ade A, Meixner W, Athey B, Hoyer M, Hill D, Lightle R, Philbert MA. Subcellular optochemical nanobiosensors: probes encapsulated by biologically localised embedding (PEBBLEs) Sens Actuators. 1998;51(1-3):12–16. [Google Scholar]
- 16.Clark HA, Hoyer M, Parus S, Philbert MA, Kopelman R. Optochemical nanosensors and subcellular applications in living cells. Microchimica Acta. 1999;131(1-2):121–128. [Google Scholar]
- 17.Clark H, Hoyer M, Philbert M, Kopelman R. Optical nanosensors for chemical analysis inside single living cells. 1. Fabrication, characterization, and methods for intracellular delivery of PEBBLE sensors. Anal Chem. 1999;71(21):4831–4836. doi: 10.1021/ac990629o. [DOI] [PubMed] [Google Scholar]
- 18.Clark H, Kopelman R, Tjalkens R, Philbert M. Optical nanosensors for chemical analysis inside single living cells. 2. Sensors for pH and calcium and the intracellular application of PEBBLE sensors. Anal Chem. 1999;71(21):4837–4843. doi: 10.1021/ac990630n. [DOI] [PubMed] [Google Scholar]
- 19.Brasuel M, Kopelman R, Kasman I, Miller TJ, Philbert MA. Ion concentrations in live cells from highly selective ion correlation fluorescent nano-sensors for sodium. Proc IEEE. 2002;1:288–292. [Google Scholar]
- 20.Dubach JM, Harjes DI, Clark HA. Fluorescent ion-selective nanosensors for intracellular analysis with improved lifetime and size. Nano Lett. 2007;7(6):1827–1831. doi: 10.1021/nl0707860. [DOI] [PubMed] [Google Scholar]
- 21.Dubach JM, Harjes DI, Clark HA. Ion-selective nano-optodes incorporating quantum dots. J Am Chem Soc. 2007;129(27):8418–8419. doi: 10.1021/ja072522l. [DOI] [PubMed] [Google Scholar]
- 22.Billingsley K, Balaconis MK, Dubach JM, Zhang N, Lim E, Francis KP, Clark HA. Fluorescent nano-optodes for glucose detection. Anal Chem. 2010;82(9):3707–3713. doi: 10.1021/ac100042e. [DOI] [PMC free article] [PubMed] [Google Scholar]
- 23.Arimori S, Ward CJ, James TD. A D-glucose selective fluorescent assay. Tetrahedron Lett. 2002;43(2):303–305. [Google Scholar]
- 24.Springsteen G, Wang B. Alizarin Red S. As a general optical reporter for studying the binding of boronic acids with carbohydrates. Chem Commun (Camb) 2001;7(17):1608–1609. doi: 10.1039/b104895n. [DOI] [PubMed] [Google Scholar]
- 25.Ma WM, Pereira Morais MP, D’Hooge F, van den Elsen JM, Cox JP, James TD, Fossey JS. Dye displacement assay for saccharide detection with boronate hydrogels. Chem Commun (Camb) 2009;(5):532–534. doi: 10.1039/b814379j. [DOI] [PubMed] [Google Scholar]
- 26.James TD, Sandanayake K, Shinkai S. Saccharide sensing with molecular receptors based on boronic acid. Angew Chem, Int Ed Engl. 1996;35(17):1910–1922. [Google Scholar]
- 27.Hall DG, editor. Boronic acids: preparation and applications in organic synthesis and medicine. Weinheim, Germany: Wiley-VCH; 2005. [Google Scholar]
- 28.Riggs JA, Smith BD. Facilitated transport of small carbohydrates through plasticized cellulose triacetate membranes. Evidence for fixed-site jumping transport mechanism. J Am Chem Soc. 1997;119(11):2765–2766. [Google Scholar]
- 29.White KM, Smith BD, Duggan PJ, Sheahan SL, Tyndall EM. Mechanism of facilitated saccharaide transport through plasticized cellulose triacetate membranes. J Membr Sci. 2001;194(2):165–175. [Google Scholar]
- 30.Frangioni JV. In vivo near-infrared fluorescence imaging. Curr Op Chem Biol. 2003;7(5):626–634. doi: 10.1016/j.cbpa.2003.08.007. [DOI] [PubMed] [Google Scholar]


