Abstract
Purpose: To explore the feasibility of improving cross-sectional reflection imaging of the breast using refractive and attenuation corrections derived from ultrasound tomography data.
Methods: The authors have adapted the planar Kirchhoff migration method, commonly used in geophysics to reconstruct reflection images, for use in ultrasound tomography imaging of the breast. Furthermore, the authors extended this method to allow for refractive and attenuative corrections. Using clinical data obtained with a breast imaging prototype, the authors applied this method to generate cross-sectional reflection images of the breast that were corrected using known distributions of sound speed and attenuation obtained from the same data.
Results: A comparison of images reconstructed with and without the corrections showed varying degrees of improvement. The sound speed correction resulted in sharpening of detail, while the attenuation correction reduced the central darkening caused by path length dependent losses. The improvements appeared to be greatest when dense tissue was involved and the least for fatty tissue. These results are consistent with the expectation that denser tissues lead to both greater refractive effects and greater attenuation.
Conclusions: Although conventional ultrasound techniques use time-gain control to correct for attenuation gradients, these corrections lead to artifacts because the true attenuation distribution is not known. The use of constant sound speed leads to additional artifacts that arise from not knowing the sound speed distribution. The authors show that in the context of ultrasound tomography, it is possible to construct reflection images of the breast that correct for inhomogeneous distributions of both sound speed and attenuation.
Keywords: Kirchhoff migration, ultrasound imaging, reflection, ring transducer, variable sound speed
INTRODUCTION
According to recent statistics, breast cancer is among the top two forms of cancer in women, second only to nonmelanoma skin cancer, and is also one of the most common causes of cancer death for women.1 Mammography is the current standard in breast cancer screening; however, it produces a false-negative rate of approximately 10% for women over the age of 50 and decreases in accuracy with women of younger ages and women with dense breasts (where the false-negative rate can be as high as 50%)2—resulting in overlooked cancer. With early detection, breast cancer is highly treatable.3 Consequently, imaging approaches that emphasize early detection and avoid the shortcomings of mammography are highly desirable.
Currently, mammography uses an x-ray imaging technique that requires the compression of breast tissue. The result is a collapsed image of the breast onto a two-dimensional (2D) film or solid state sensor. For three-dimensional imaging, techniques include magnetic resonance imaging (MRI) and computed tomography (CT), which also uses x rays but is seldom used for breast imaging because of potential overexposure risks. MRI, on the other hand, is radiation-free, but exam times are very long and, in the case of breast imaging, requires the use of invasive contrast agents. Furthermore, MRI is very expensive, thereby limiting access. These factors have prevented the adoption of MRI for general breast screening. Ultrasonography has the virtue of being fast, inexpensive, and radiation-free. Stavros et al.4 analyzed ultrasonographic properties of breast tissue and the clinical implementation for differentiating between cancerous and benign masses. Currently, this is done with linear array transducers, creating B-mode images that depict planes of various orientations through the breast. Such an approach is operator dependent and does not easily image the whole breast. Currently, new technology is being developed to pioneer the physics of an encompassing array of transducing elements. While a linear array only detects reflected signals from a localized region, surrounding the imaging area with acoustic elements allows detection of reflected signals from all angles and even for the measurement of transmitted signals.5 Consequently, the structural properties of tissue can more accurately be determined with more precise measurement of wave propagation and information from an encompassing boundary.
Early work of Carson et al.6 involved scanning along coronal planes of the breast and superimposing images detected by a linear array as it revolved around the imaging area at a determined depth. This process was then repeated for additional image slices. These promising preliminary results inspired the advancement of other ultrasound imaging techniques. Later work of Liu and Wagg7 has yielded some of the methods for calculating acoustic fields from known planar surface excitations. Their calculations for propagation and backpropagation in a uniform medium verified and established ultrasound image calculation methods and applications.
The work of André et al.8 demonstrated the ability to produce operator independent images of internal breast structure, but failed to reconstruct breast lesions. Marmarelis et al.9 developed a method wherein the breast is scanned with two parallel ultrasound arrays through a process named high-resolution ultrasonic transmission tomography (HUTT). Unlike standard ultrasound, the images produced are frequency-dependent attenuation profiles of the scanned media. Their results include images of phantom and kidney architectures; however, they have yet to produce images from in vivo studies. TechniScan Inc. has developed an experimental setup similar to HUTT and has demonstrated the ability to image breast lesions.10, 11 The TechniScan procedure gathers and reconstructs transmitted wave data; however, the reflection data are not implicated, and, to date, no reflection images have been published.
Recently, Duric et al.2 pioneered an approach that uses a ring-shaped transducer system that simultaneously generates images from both the transmitted and the reflected signals. The ring design is particularly amenable to combining reflection and transmission data to correct for propagation effects such as refraction and attenuation. The transmitted signal is used to reconstruct sound speed and attenuation maps of the imaged area.12, 13, 14 The sound speed images are reconstructed from measurements of the signal arrival times using bent-ray techniques, while the attenuation is reconstructed from the calculated loss of wave energy along bent-ray paths. The reflection images are reconstructed using delay and sum migration techniques.
This paper builds on the above results by using measurements of the transmitted signals and a more appropriate migration algorithm for a circular geometry that improves calculated reflection signals from the imaging area. The migration algorithm that we have developed is a modification of the Kirchhoff migration equation—a common method used in the discipline of geophysics.15 Assuming a large planar surface for signal transmission and sampling, Kirchhoff migration was originally derived using a Green’s function solution to the wave equation for the imaging of subterranean reflecting surfaces from seismic data.
In this paper, we discuss the experimental setup and data acquisition for the particular ultrasound geometry of a ring of elements as used in our system. We extend the Kirchhoff method for our system setup, approximating the Kirchhoff integral theorem to satisfy the boundary conditions imposed by the ring geometry. The derived Kirchhoff equation is further modified to take into account improper focusing due to inhomogeneous media in sound speed and echogenicity artifacts due to strong attenuation gradients. This technique is then applied to acquire in vivo data for improved visualization of masses that may otherwise be hidden or poorly rendered by other imaging methods. The results are shown and discussed as produced with various set of parameters.
MATERIALS AND METHODS
Equipment and data acquisition
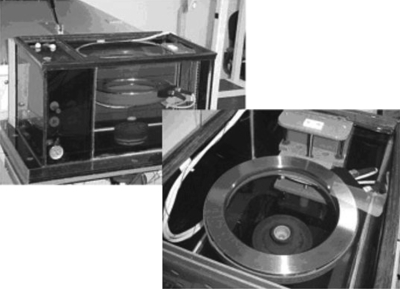
The data were obtained using a clinical prototype located at the Karmanos Cancer Institute in Detroit, MI. The patient is positioned on a table and submerges her breast through an opening into an imaging tank that contains the transducer ring. The tank is filled with water for proper acoustic coupling between the transducer and the breast tissue (see Fig. 1). To initialize the scan, the array is positioned near the patient’s chest wall: The first element fires a pulse, all elements record the resulting signal, and the next elements follow in sequence until all transmitters have fired. The ring then translates along the coronal axis and repeats the firing sequence until the desired length of the breast has been scanned.2
Figure 1.
Close up views of the imaging tank and transducer ring. The array moves vertically as controlled by the gantry pillar.
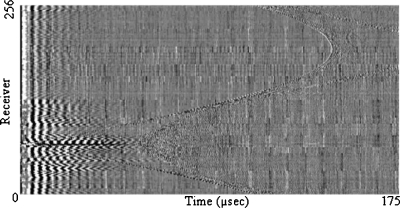
The current ring array contains 256 individual acoustic elements evenly distributed along the inner surface of the ring. The elements systematically transmit and receive wave signals. The primary wave pulse transmits at broadband frequencies centered around 2 MHz, while all receivers detect for a period of about 0.175 ms after firing. With an additional interval to allow for the vibrational settling of the medium, a single slice takes about 1 s to acquire. The data are then transferred into a binary file containing all signal information for the procedure (see Fig. 2).
Figure 2.
A graphical display of raw receiver response data due to a single transmission element. The amplitudes are plotted as a grayscale. Temporal sampling is along the horizontal and receiver number is along the vertical.
The receivers measure the incoming wave signal at a sample rate determined prior to the scan. For proper waveform reconstruction, the sample frequency needs to be at least twice that of the transmit frequency as stated by the Nyquist sampling theorem.16 For the results of this paper, we sampled at 8.33 MHz. The data are read from the raw signal file and analyzed with various computerized algorithms to develop images that best reconstruct the physical characteristics of the scanned breast.
Reconstruction
In this work, we focus on reconstructing a reflection image from backscattered signals in the plane of a ring transducer. For the circular geometry of our system, we approximate the Kirchhoff migration algorithm to satisfy the Dirichlet boundary conditions due to our direct measurement of the wave amplitude along a “spherical” surface, S′. Starting with the wave equation,
| (1) |
where Φ is the wave amplitude, c is the group velocity of sound, and f is the source function of the wave evaluated at position and time t, we apply Green’s theorem to solve Eq. 1 within the imaging area and assume no internal acoustic sources. The resulting equation governing the wave amplitude is given by
| (2) |
which is the Kirchhoff integral theorem, where n′ is the unit normal to the surface. Here, Γ is the Green’s function and within the integrating volume must satisfy
| (3) |
for its mathematical significance in the derivation of Eq. 2. The primed variables are introduced as variables of integration.
Since the wave amplitude Φ will be obtained from measurement, ∂Φ∕dn′ remains to be calculated from the measured value at the surface, as defined by the Dirichlet conditions. A preferred Green’s function vanishes on the surface S′ to eliminate the last term of the integrand in Eq. 2. For conventional planar imaging, this is achieved by the method of images;17 however, to exactly satisfy the boundary conditions here for a ring or a sphere of radius a, the conventional image method cannot be applied. Nonetheless, the obliquity factor from the results of the image method on a planar surface can be adapted to the ring array by simple geometric interpretation and is valid as long as the wavelength of the signal is much smaller than the radius of curvature of the aperture.7 We will derive this same result by neglecting the contribution of the last term of the integrand in Eq. 2 to the reconstruction and proceed with the calculations using the free-space Green’s function,
| (4) |
where
in polar coordinates and γ is the angle between position and the Green’s function source position . For media with varying sound speed, can be replaced by a more general travel time tR for more flexibility. Substituting Eq. 4 into Eq. 2 yields
| (5) |
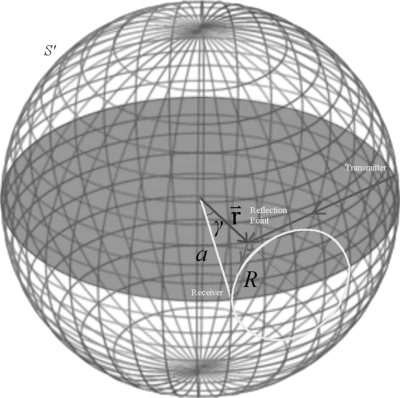
where R=(r2+a2−2ar cos γ)1∕2 is equal to evaluated at r′=a (see Fig. 3). Thus, tR, as defined in the case of constant sound speed, is equal to the travel time from the point of interest to the sampling surface. This result is simply half of the equation obtained by converting the obliquity factor in the image method to that of a spherical surface. This is due to the contribution of the image source that we omitted in Eq. 4. The consequence of this term is that it simply scales the final reconstruction by a constant.
Figure 3.
Depiction of the spherical geometry. The shadowed plane represents the region for reconstruction. Elements reside evenly spaced on the edge of the shadowed circular region. As shown by the arrows, the transmitted signal reaches a presumed reflection point and is then spherically radiated by the reflector as described by Huygen’s principle, creating the circular intersection on the surface of the sphere.
We then convert this integral over the spherical surface into a discrete form for the finite number of elements along a circular array. There are multiple ways to handle the limited signal coverage for the surface integral. One option is to assume spherical spreading from the reflection point as described by Huygen’s principle. The intersection of the spherical wavefront with the spherical sampling surface creates a circle, which is then, for a single receiver, evaluated as a semiannular weighted section. Using this model produces
| (6) |
where Δγ is equal to π divided by the number of elements. (If only considering the contributions from the measured positions on the ring, the term sin γ is replaced by a constant, and all out-of-plane information is aliased to zero.) This equation, the migration formula, computes the amplitude of the wave at any point and time within the sampling surface area using only the known values as measured on the boundaries.
To reconstruct the reflected signals via Eq. 6, we consider each point in the imaging area as a point reflector and reconstruct the amplitude at the time the wavefront intersects that point. If this procedure is repeated with every receiver, we would create an image of the total amplitude of the wavefront at every point in the plane and would only obtain radial and attenuated wave decay. For reflection imaging, we are only concerned about the reflectivity of each point within the material. To model this, we only reconstruct wave amplitude using angles limited by an approximated maximum total internal reflection angle (which is calculated from an expected maximum difference between indices of refraction). Beyond that angle, it is circumstantial as to whether or not the wave is actually reflecting or refracting at a different incident angle, and this cannot be determined by the primary image reconstruction iteration. One consideration from this result is to only reconstruct the reflection images with a portion of the receiving elements that then define the aperture. For maximum reflection signal, we use the transmission element itself as the center receiving element and an equal amount of nearest-neighbor elements on each side of the transmitter to reconstruct the image. This aperture can easily be changed to optimize for computational speed or image quality.
Additional general compensations for our system are applied to Eq. 6. The wave experiences multiple reflections as it travels along the surface of the ring array. Thus, all recorded signals prior to the transmission wavefront and the wave from the surface of the array must be discarded. This result also helps define the optimization of chosen receiving apertures. As the aperture widens, more signals fall into the transmission and ring surface reflection category and must be discarded. Additionally, the angle of the wavefront with respect to the elements must be considered to compensate for the angular response sensitivity of the elements. This is also strongly related to the shape of the transmitted wave and is dependent on the frequency of the signal. The transmitting elements of our system focus the signal in plane as a fan beam. This creates a positional dependence of the perceived broadband amplitude of the wave, which can be calculated as a function of the angle normal to the transmitting element φt and receiving element φr. We also compensate for initial amplitude decay as modeled by radial cylindrical energy spreading from the transmission source to the reflection point over a distance d1 due to the initial in-plane focusing of our transmitters. Thus, the amplitude must be scaled by a factor of .
For an average sound speed model (i.e., homogeneous medium), Eq. 6 can be calculated geometrically to give acceptable first order results. In our system, sound speed maps are made in conjunction with this method using transmitted signals, which allows for correction of travel times within an inhomogeneous medium. An Eikonal solver program is used to process the sound speed images and produce a unique travel time table from each element to the entire reconstruction area.18 Using this table of time values and interpolating to the grid size of reflection allows us to accurately determine t and tR for summation in Eq. 6.
Note that energy attenuation has not been accounted for in the above derivation. However, the corresponding attenuation maps, also created from transmission signals, can be invoked to correctly scale the amplitude of the signal for the different wave paths propagating through differing media. The attenuation image contains a 2D array of attenuation coefficients μ, which are read into the reflection algorithm, converted to units of dB∕cm, and then used to calculate the total signal decay through the traveled wave path. The following equation is used:
| (7) |
where Af is the detected signal, Ao is the desired boosted signal, and the integral is taken over the path from the transmitter to the reflection point and then to the receiver. The current reconstruction algorithm approximates this integral as an average attenuation coefficient over discrete pixels, which is then multiplied by the path length.
Thus, the reflection reconstruction equation for a single transmitting element is given by
| (8) |
where all variables are functions of and depend on the transmitter and receiver positions. Using standard programming in C, we solve this equation for image construction by creating a 2D array to span the imaging region surrounded by the ring. The pixel size, usually being of sides with length of 1 mm, determines the size of the array and final image resolution. For each transmission set (Fig. 2), Eq. 8 is solved for each position in the array that is sampled by the record length. This equation is then reapplied to each data set created by different transmitting elements, and the results are overlaid into one final reflection image.
RESULTS
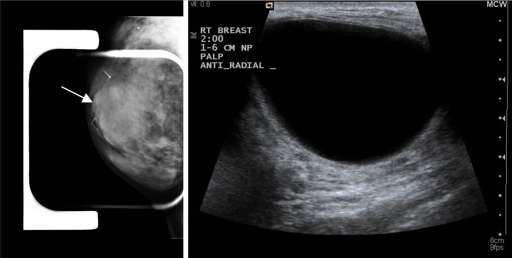
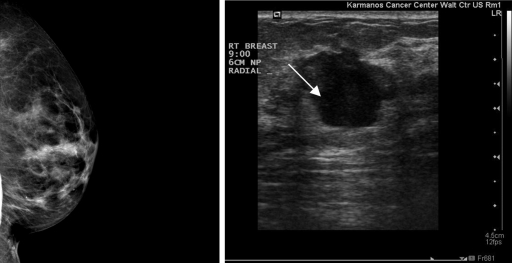
For reference, Fig. 4 shows the clinical breast ultrasound and mammogram of an in vivo detected cyst. The patient was separately scanned with the ultrasound tomography prototype to produce a raw signal data stack of approximately 50 slices spaced 1mm apart, which was then stored for processing. The method described in Sec. 2B was applied to the first slice of the acquired data set to produce images having 0.1 mm pixel resolution, with dimensions of 2000×2000 pixels.
Figure 4.
Mammogram (left) and clinical ultrasound (right) of image reconstruction area. Note that the orientation represented here is not necessarily the same orientation of the circular ring array data set.
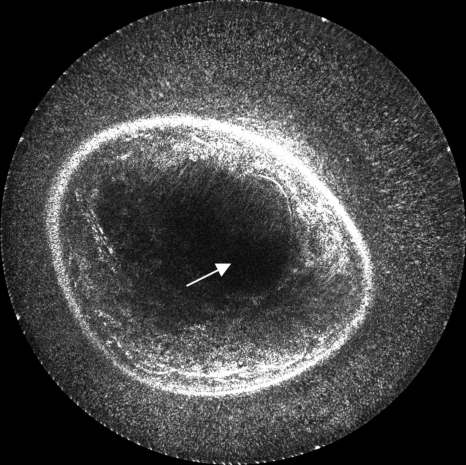
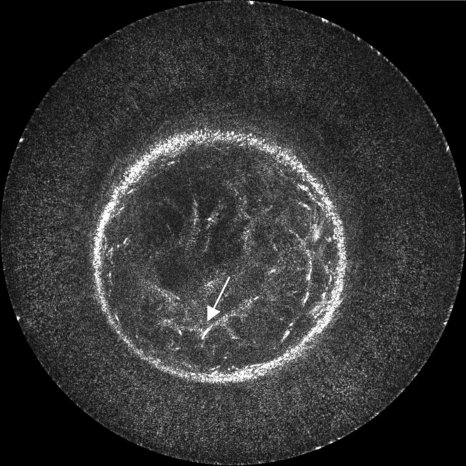
We first present the results of reconstruction using a constant sound speed model (1.510 km∕s) calculated from the background water and a constant attenuation compensation of 0.5 dB∕cm. The comparative images in this section have been normalized with respect to one another; thus, the enhancements due to correction are slightly underemphasized, although still comprehendible. In Fig. 5, 40 receivers are used on each side of the transmitting element, making a total reconstruction aperture of 81 elements (including the transmitting element). This method simulates a straight ray migration routine that assumes a homogeneous medium. Image darkening at the center is due to the neglect of attenuation inhomogeneities and also insufficient angular coverage of the reflection signal. In this example as well as others, some signal loss occurs when the breast encroaches on the surface of the transducer due to near field effects and less signal coverage. Additionally, some noise remains in the water region for these same reasons. Boundary detection techniques can be used to mute the water in the image completely; however, such techniques are not applied here.
Figure 5.
The basic reconstruction using spherically derived Kirchhoff migration. This image was created using 40 receivers on each side of each transmitter and assumed a constant sound speed and no attenuation. The arrow indicates the position of the mass.
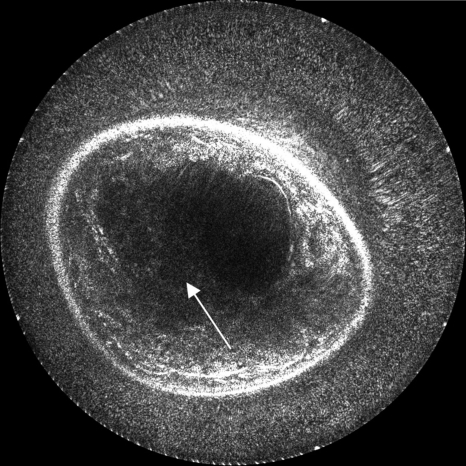
Figure 6 is obtained from the result of reconstructing with the same method, except for the use of 85 receivers on each side of the transmitting element (171 of the total 256) for a greater coverage of the reflected wave and a larger signal to noise ratio. Increasing the aperture lengthens the reconstruction time, but boosts the signal to noise ratio with larger signal coverage.
Figure 6.
The basic reconstruction similar to Fig. 5, with the receiver aperture extended to 85 receivers on each side of the transmitters. The signal is gained on the interior structures in the area pointed to by the arrow.
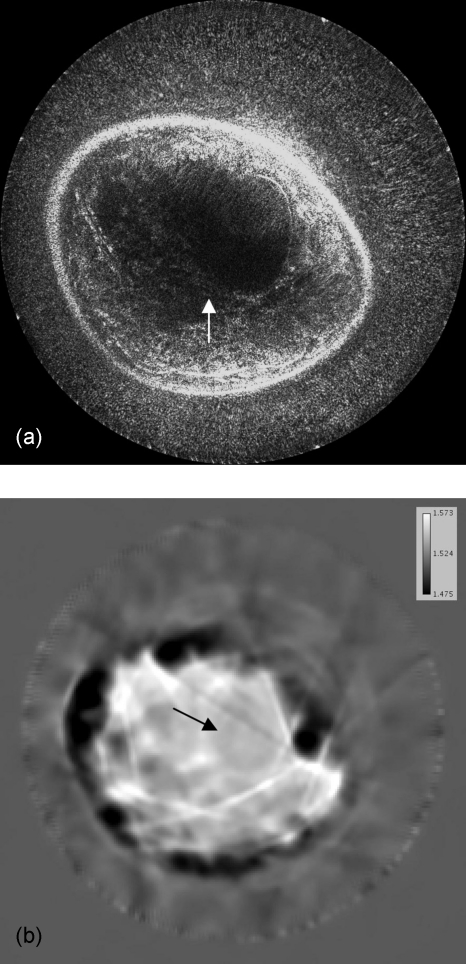
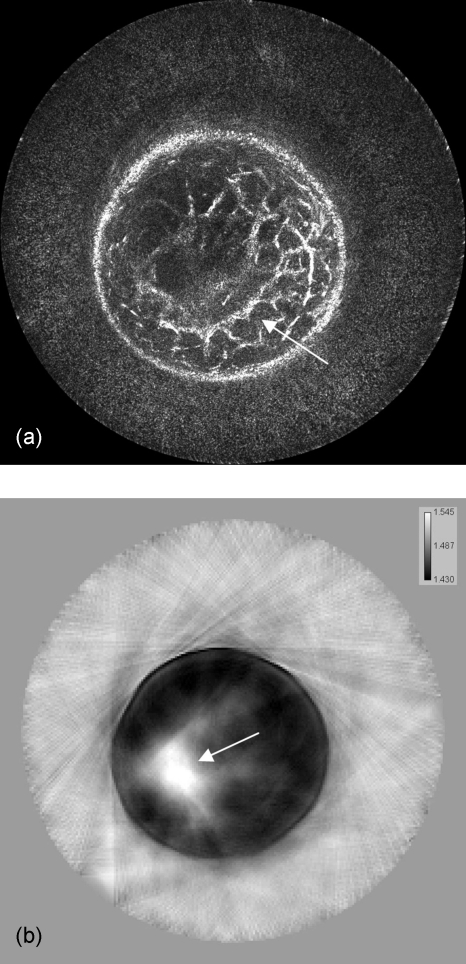
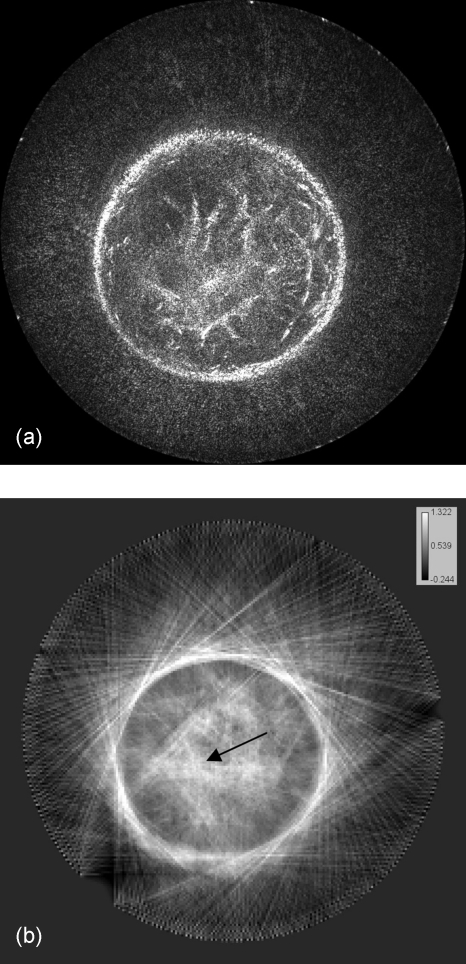
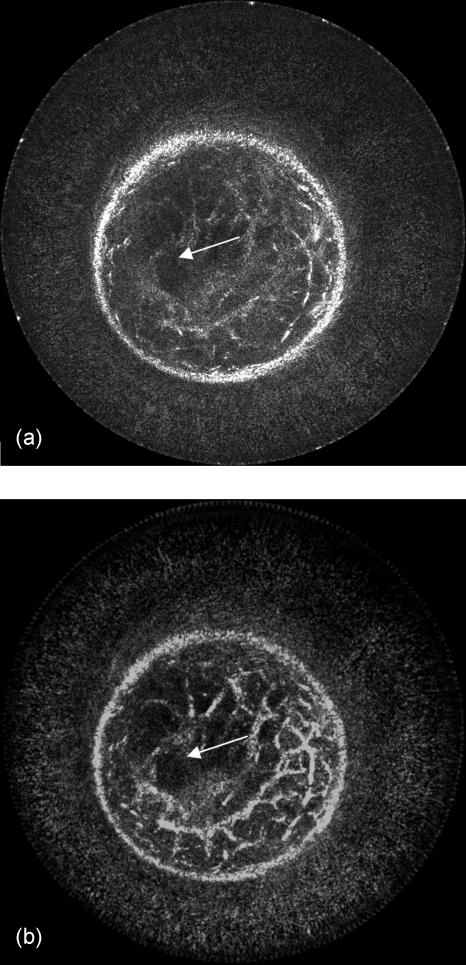
The image quality can be alternatively improved with the use of sound speed data, which corrects for refraction, as shown in Fig. 7a (with 81 receivers and 0.5 db∕cm attenuation used). The sound speed image [Fig. 7b] is used to calculate more accurate travel times for the amplitude summation in Eq. 8, as compared to the simple assumption of constant sound speed; thus, the inhomogeneous medium can be considered in our method. Furthermore, the effects of incorporating attenuation results are shown in Fig. 8 (with 81 receivers and constant sound speed). Figure 8b is the result of reconstructing with the use of the attenuation map given in Fig. 8c to calculate amplitude corrections.
Figure 7.
Image reconstruction with the use of a sound speed model for more accurately calculated travel times. Note the focusing and contrast enhancement of edges in the resulted image of (a). Overall interference effects are more accurately superimposed and the structures become coherent as in the location indicated by the arrow. The sound speed image (b) used for this reconstruction was obtained by using the algorithms described in Ref. 14. The sound speed values are represented in km∕s. The arrow in (b) again indicates the position of the mass.
Figure 8.
Results of attenuation compensation, which helps amplify the signal to the center of the image. Image (a) is the original image that was created assuming a constant 0.50 dB∕cm attenuation. Image (b) was reconstructed using image (c) as a variable attenuation model. The attenuation image was created by the method described in Ref. 13 using the transmitted signal. The attenuation values are represented in dB∕cm. The arrow in (c) represents the position of the mass.
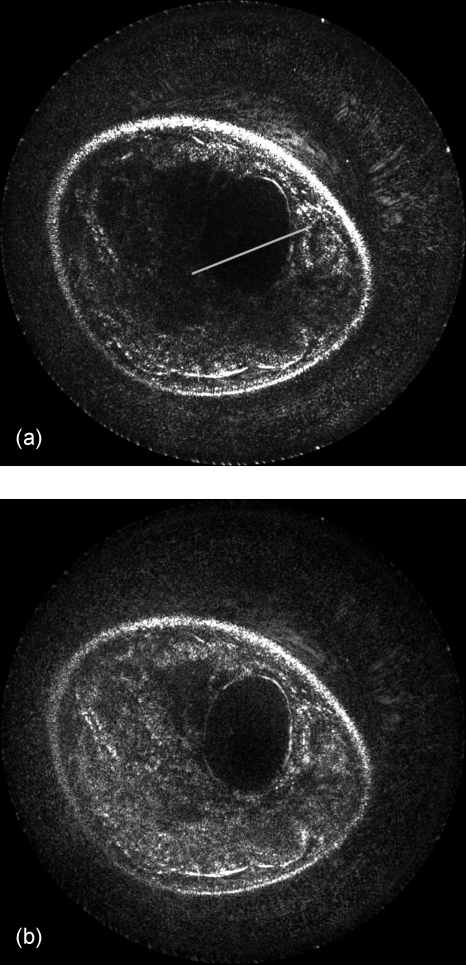
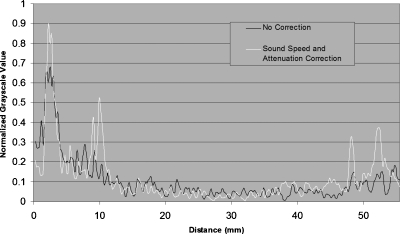
As expected, much higher quality can be obtained with the combination of a larger aperture (with 171 receivers), the variable sound speed model, and the variable attenuation compensation, as demonstrated visually in Fig. 9 and quantitatively in Fig. 10. Figure 10 shows numerically the improvement in image quality along the boundary of the cyst. The peak values at the boundary are much higher in the compensated case than in the original case created with the assumption of homogeneous media. When compared to the background value of the signal, this numerically models the contrast improvement in the boundary. Comparing the full width at half maximum of this peak demonstrates the sharpness of the cyst boundary. The width of the uncorrected model is wider than that of the corrected model, showing the improvement in sharpness of the image. Note that the noise background levels when normalized maintain roughly the same magnitude in this measurement.
Figure 9.
This reconstruction includes all aspects of signal compensation. The variable sound speed and attenuation models, as well as the use of the large 171 element reconstruction aperture, have been applied in (b). Compared to the original image (a), the cyst wall and skin are complete and in focus, and the tissue signal maintains continuity due to a proper mapping of signal loss. The line indicates the measured segment.
Figure 10.
Graphical representation of pixel values through the cyst boundaries. The cyst walls occur at 10 and 48.3 mm.
Figures 111213141516 show similar results compiled using a different patient study. For these images, the assumed constant sound speed was that of the calculated background water sound speed of 1.520 km∕s, and 0.5 dB∕cm was used for attenuation compensation when assuming constant attenuation. This case involves a much more heterogeneous breast of considerably lower density than that of the previous case and, more specifically, the visualization of a cancerous mass. Because of the lower density, the effect of compensation for variable attenuation is expected to be lower also. In fact, as inspection of Figs. 1213141516 shows, there is improvement in the visibility of the breast structure as well as the mass, although the magnitudes of the improvements are lower when compared to the dense breast described earlier (Figs. 5678910).
Figure 11.
Mammogram (left) and clinical ultrasound (right) of image reconstruction area for the second case study. Note that the orientation represented here is not necessarily the same orientation of the circular ring array data set.
Figure 12.
The basic reconstruction of the second case study using spherically derived Kirchhoff migration. This image was created using 40 receivers on each side of each transmitter and assuming a constant sound speed and no attenuation. The mass is located at the position indicated by the arrow.
Figure 13.
The basic reconstruction similar to Fig. 12, with the receiver aperture extended to 85 receivers on each side of the transmitters. Again, the signal is gained on the interior structures such as the location indicated by the arrow.
Figure 14.
Image reconstruction with the use of a sound speed model (for the second case study). Note the focusing and contrast enhancement of structures in the resulted image of (a). The sound speed image (b) used for this reconstruction was obtained using the algorithms described in Ref. 12. The sound speed values are represented in km∕s. For cancers in breasts with much lower density, the mass (indicated by the arrow) is very apparent with transmission tomography.
Figure 15.
Results of attenuation compensation (for the second case study), which helps enhance the signal to the center of the image. Image (a) was reconstructed using image (b) as a variable attenuation model. The attenuation image (b) was developed using the method described in Ref. 13. The attenuation values are represented in dB∕cm.
Figure 16.
This reconstruction includes all aspects of signal compensation (for second case study). The variable sound speed and attenuation models have been applied with the use of the large 171 element reconstruction aperture in (b). Tissue signal maintains continuity due to a proper mapping of signal loss as compared to the original image shown in (a). The position of the mass is indicated by the arrows.
For the scanning technique developed here, to identify the nature of the mass in question, we can compare the properties of the mass with all three modalities—sound speed, attenuation, and reflection. One important aspect of this method is that we do not need to apply some formerly used techniques of identifying masses from the ultrasound reflection artifacts produced. These artifacts are no longer necessary nor desired with this method because the material parameters formerly interpreted from these image characteristics are now presented in a separate image, i.e., the attenuation image. Details of these classification techniques are addressed elsewhere.19, 20, 21, 22
DISCUSSION AND CONCLUSION
The results given above have indicated that proper corrections to the Kirchhoff migration method can yield improved quality images due to the inherent sensitivity to amplitude interference and superposition for signal coherence within the imaging region. Applying the spherical surface weights also increases the dependency on signal to noise ratio, thus necessitating a larger reconstruction aperture for optimal results. For example, in the first study case presented in Figs. 45678910, the interior surface of the cyst begins to be visually developed by doubling the reconstruction aperture. This is also apparent in the development of internal fibrous structures at the 12 o’clock position in the second case example shown in Fig. 13. The overall contrast is also improved by the general increase in the signal to noise ratio via the inclusion of additional receivers. This result indicates that we may venture far away from the standard planar Kirchhoff reconstruction approximation, yet still gain overall image quality.
By using a variable sound speed model, wave amplitude interference aligns more accurately. In both cases of patient study given in Sec. 3, the constructive and destructive coherence is most apparent in the focusing of the skin and internal fibrous structure. In the first case, the walls of the cyst are also greatly enhanced and are dependent on an accurate sound speed model. (For this example, with a poor or nonexistent sound speed model, imaging the walls of the cyst is not possible.)
The variable attenuation model drastically improves the imaging quality in the situation of signal loss due to material absorption and scatter. Additionally, it does not blindly overcompensate as in the case of constant attenuation assumption or manual time-gain control. However, in these experiments it should be noted that for proper restoration of the nonattenuated wave amplitude, we would need the total absorption and scatter through a specific path in the tissue, including out-of-plane scatter. The method for creating the current attenuation images does not distinguish these differences and thus overestimates the attenuation of the tissue when creating a single map of attenuation coefficients. If not scaled down, this results in an overenhancement of echogenicity. Also, for these current results, the wave paths for attenuation compensation are approximated by straight rays, creating some areas of improper enhancement. The first case shown in Sec. 3 is a study of a very dense tissue breast. The proper attenuation compensation prevents the cyst from being lost in radial signal degradation due to the nature of the breast tissue. However, in the second case, the breast is more heterogeneous in structure and overall lower in density, limiting the dependence of signal recovery on attenuation compensation.
The amount of speckle-producing backscatter from subwavelength sized structures is traded-off against accurate structure rendering. As noted earlier, a major goal of this work is better definition of tissue boundaries. For deep penetration to the center of the ring, lower frequencies are less susceptible to the attenuation caused by the tissue and the interface between water and breast tissue. For tomographic imaging of reflection considered here, this is not a limitation because we do not depend on one type of backscatter, but rely on the detection of boundaries.
By applying all of the enhancements to the image migration method—variable sound speed, variable attenuation, and large reconstruction aperture—the Kirchhoff migration method greatly enhances the overall contrast, sharpness, edge boundaries, and possible resolution of the reconstructed reflection image. The greatest improvements are expected to continue to materialize in cases of denser tissue, which is the most important clinical case due to difficulties it poses for standard imaging and because of the link of breast cancer risk to breast density. To create these enhanced images, the overall trade-off is the large computational cost, and hence the code will need to be optimized and parallelized in order to maximize efficiency. The most efficient combination of methods to balance between computational time and image quality has yet to be determined. Obviously, there are also great dependencies on the quality and speed of creation of the attenuation and sound speed models, which also currently plead to be optimized and automated alongside the reconstruction of the reflection images. For such future programming obstacles, Moore’s law is expected to be on the side of science.
References
- Centers for Disease Control and Prevention, Breast Cancer, http://www.cdc.gov/cancer/dcpc/about/ (March 14, 2007).
- Duric N. et al. , “Detection of breast cancer with ultrasound tomography: First results with the computerized ultrasound risk evaluation (CURE) prototype,” Med. Phys. 34, 773–785 (2007). 10.1118/1.2432161 [DOI] [PubMed] [Google Scholar]
- Breasthealth, Early Detection, http://www.breasthealth.com.au/earlydetection/, National Breast and Ovarian Cancer Centre (November 2004).
- Stavros A. T., Thickman D., Rapp C. L., Dennis M. A., Parker S. H., and Sisney G. A., “Solid breast nodules: Use of sonography to distinguish between benign and malignant lesions,” Radiology 196, 123–134 (1995). [DOI] [PubMed] [Google Scholar]
- Duric N.et al. , “Development of ultrasound tomography for breast imaging: Technical assessment,” American Association of Physicists in Medicine, pp. 1375–1386 (May 2005). [DOI] [PubMed]
- Carson P. L., Meyer C. R., Scherzinger A. L., and Oughton T. V., “Breast imaging in coronal planes with simultaneous pulse echo and transmission ultrasound,” Science 214, 1141–1143 (1981). 10.1126/science.7302585 [DOI] [PubMed] [Google Scholar]
- Liu D. -L. and Waag R. C., “Propagation and backpropagation for ultrasonic wavefront design,” IEEE Trans. Ultrason. Ferroelectr. Freq. Control 44(1), 1–13 (1997). 10.1109/58.585184 [DOI] [PubMed] [Google Scholar]
- André M. P., Janée H. S., Martin P. J., Otto G. P., Spivey B. A., and Palmer D. A., “High-speed data acquisition in a diffraction tomography system employing large-scale toroidal arrays,” Int. J. Imaging Syst. Technol. 8, 137–147 (1997). [DOI] [Google Scholar]
- Marmarelis V. Z., Jeong J., Shin D. C., and Do S., “High-resolution 3-D imaging and tissue differentiation with transmission tomography,” Acoust. Imaging 28, 195–206 (2007). 10.1007/1-4020-5721-0_21 [DOI] [Google Scholar]
- Johnson S. A., Borup D. T., Wiskin J. W., Natterer F., Wuebbling F., Zhang Y., and Olsen C., “Apparatus and method for imaging with wavefields using inverse scattering techniques,” US Patent No. 6,005,916 (December 21, 1999).
- 3D UltraSound CT, http://www.techniscanmedicalsystems.com/, TechniScan Medical Systems (2005).
- Li C., Duric N., Littrup P., and Huang L., “In vivo breast sound-speed imaging with ultrasound tomography,” Ultrasound Med. Biol. 35(10), 1615–1628 (2009). 10.1016/j.ultrasmedbio.2009.05.011 [DOI] [PMC free article] [PubMed] [Google Scholar]
- Li C., Duric N., and Huang L., “Comparison of ultrasound attenuation tomography methods for breast imaging,” SPIE Medical Imaging, Vol. 6920, 2008.
- Hormati A., Jovanovic I., Roy O., and Vetterli M., “Robust ultrasound travel-time tomography using the bent ray model,” SPIE Medical Imaging, February 2010. (unpublished).
- Schneider W. A., “Integral formulation of migration in two and three dimensions,” Geophysics 43, 49–76 (1978). 10.1190/1.1440828 [DOI] [Google Scholar]
- Nyquist H., “Certain topics in telegraph transmission theory,” Trans. Am. Inst. Electr. Eng. 47, 617–644 (1928). 10.1109/T-AIEE.1928.5055024 [DOI] [Google Scholar]
- Morse P. M. and Feshback H., Methods of Theoretical Physics (McGraw-Hill, New York, 1953), pp. 834–857. [Google Scholar]
- Klimeš L., “Grid travel-time tracing: Second-order method for the first arrivals in smooth media,” Pure Appl. Geophys. 148, 539–563 (1996). 10.1007/BF00874578 [DOI] [Google Scholar]
- Myc L., Duric N., Littrup P., Li C., Ranger B., Lupinacci J., Schmidt S., Rama O., and Bey-Knight L., “Volumetric breast density evaluation by ultrasound tomography and magnetic resonance imaging: A preliminary comparative study,” SPIE Medical Imaging, February 2010. (unpublished).
- Duric N., Littrup P., Chandiwala-Mody P., Li C., Schmidt S., Myc L., Rama O., Bey-Knight L., Lupinacci J., Ranger B., Szczepanski A., and West E., “In-vivo imaging results with ultrasound tomography: Report on an ongoing study at the Karmanos Cancer Institute,” SPIE Medical Imaging, February 2010. (unpublished).
- Ranger B., Littrup P., Duric N., Li C., Schmidt S., Lupinacci J., Myc L., Szczepanski A., Rama O., and Bey-Knight L., “Breast imaging with ultrasound tomography: A comparative study with MRI,” SPIE Medical Imaging, February 2010. (unpublished).
- Lupinacci J., Duric N., Littrup P., Wang D., Li C., Schmidt S., Ranger B., West E., Szczepanski A., Rama O., Bey-Knight L., and Myc L., “Monitoring breast masses with ultrasound tomography in patients undergoing neoadjuvant chemotherapy,” SPIE Medical Imaging, February 2010. (unpublished).


