Abstract
Purpose: Recently, photon counting x-ray detectors (PCXDs) with energy discrimination capabilities have been developed for potential use in clinical computed tomography (CT) scanners. These PCXDs have great potential to improve the quality of CT images due to the absence of electronic noise and weights applied to the counts and the additional spectral information. With high count rates encountered in clinical CT, however, coincident photons are recorded as one event with a higher or lower energy due to the finite speed of the PCXD. This phenomenon is called a “pulse pileup event” and results in both a loss of counts (called “deadtime losses”) and distortion of the recorded energy spectrum. Even though the performance of PCXDs is being improved, it is essential to develop algorithmic methods based on accurate models of the properties of detectors to compensate for these effects. To date, only one PCXD (model DXMCT-1, DxRay, Inc., Northridge, CA) has been used for clinical CT studies. The aim of that study was to evaluate the agreement between data measured by DXMCT-1 and those predicted by analytical models for the energy response, the deadtime losses, and the distorted recorded spectrum caused by pulse pileup effects.
Methods: An energy calibration was performed using 99mTc (140 keV), 57Co (122 keV), and an x-ray beam obtained with four x-ray tube voltages (35, 50, 65, and 80 kVp). The DXMCT-1 was placed 150 mm from the x-ray focal spot; the count rates and the spectra were recorded at various tube current values from 10 to 500 μA for a tube voltage of 80 kVp. Using these measurements, for each pulse height comparator we estimated three parameters describing the photon energy-pulse height curve, the detector deadtime τ, a coefficient k that relates the x-ray tube current I to an incident count rate a by a=k×I, and the incident spectrum. The mean pulse shape of all comparators was acquired in a separate study and was used in the model to estimate the distorted recorded spectrum. The agreement between data measured by the DXMCT-1 and those predicted by the models was quantified by the coefficient of variation (COV), i.e., the root mean square difference divided by the mean of the measurement.
Results: Photon energy versus pulse height curves calculated with an analytical model and those measured using the DXMCT-1 were in agreement within 0.2% in terms of the COV. The COV between the output count rates measured and those predicted by analytical models was 2.5% for deadtime losses of up to 60%. The COVs between spectra measured and those predicted by the detector model were within 3.7%–7.2% with deadtime losses of 19%–46%.
Conclusions: It has been demonstrated that the performance of the DXMCT-1 agreed exceptionally well with the analytical models regarding the energy response, the count rate, and the recorded spectrum with pulse pileup effects. These models will be useful in developing methods to compensate for these effects in PCXD-based clinical CT systems.
Keywords: computed tomography, photon counting, pulse pileup
INTRODUCTION
Current multislice x-ray computed tomography (CT) scanners provide three-dimensional imaging of the linear attenuation coefficient distribution within a patient. The derived images accurately delineate organs and tissues, which helps physicians make accurate diagnoses. However, there are three major limitations to current CT technologies: (1) images of linear attenuation coefficients are not tissue-type specific, (2) contrast between certain different tissues is not sufficient, and (3) “CT scanning is a relatively high-dose procedure.”1
In general, linear attenuation coefficients depend on several factors, such as the chemical composition of the object, the mass density of the object, and the energy of the x-ray photons. Consequently, the transmitted x-ray spectra carry information about tissue types such as fat, muscle, bone, contrast materials, etc. Energy-integrating detectors, which are used in almost all current CT scanners, measure only the integrated area under the transmitted x-ray spectrum, and therefore lose all energy-dependent information. Energy-integrating detectors also add electronic noise and Swank noise,2 and higher energy photons, which carry less information about contrast between different tissues and receive a larger weight in the output signal, resulting in increased noise and reduced contrast. In general, dual-energy CT imaging3 can provide tissue-specific images. However, neither the current dual-kVp nor dual-source techniques4 provide optimal results due to cross-talk between the high and low energy images and because of the limited number of resolvable basis functions (only two) for material decomposition.3 The presence of contrast media containing elements with high atomic numbers (e.g., iodine or gadolinium) can be identified with a third basis function. Thus, it is desirable to measure the transmitted x-ray photons with more than two energy windows.
Recently, photon counting x-ray detectors (PCXDs) with energy discrimination capabilities based on pulse height analysis have been developed for medical x-ray imaging.5, 6, 7, 8, 9, 10, 11, 12, 13, 14 PCXD-based CT with multiple energy windows has the potential to improve the three major limitations listed above.6, 7, 15 Electronic and Swank noise affect the measured energy, but do not change the output signal intensity (i.e., the counts), and the energy overlap in the spectral measurements is superior to (i.e., smaller than) that from any of the current dual-energy techniques using integrating detectors. In addition, more than one contrast media could be imaged simultaneously and would be distinguishable if the detectors had four or more energy windows (pulse height comparators). PCXDs may therefore lead to novel clinical applications. The number of energy windows per detector pixel in PCXDs varies from 2 to 8, depending on specific detector designs.5, 6, 7, 8, 9, 10, 11, 12, 13, 14 One PCXD (model DXMCT-1, DxRay, Inc., Northridge, CA), which will be used in this study, has been incorporated into a commercial CT scanner (LightSpeed VCT, GE Healthcare, Waukesha, WI). This is the only PCXD that has been used for a clinical dual energy CT study to date.5
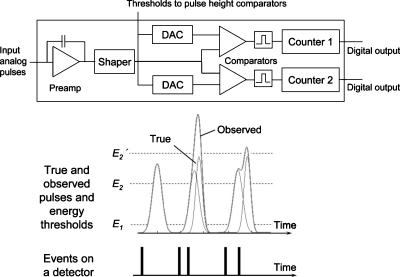
The performance of PCXDs is not flawless, however, especially at the count rates in current clinical CT. Due to the limited pulse resolving time, quasicoincident photons (overlapping pulses) can be recorded as a single count with a higher or lower energy (see Fig. 1). This phenomenon is called pulse pileup and results both in a loss of counts, referred to as deadtime losses, and a distortion of the recorded spectrum.16 The amount of the deadtime losses and the distortion of the recorded spectrum will depend on the incident count rate. Using recorded counts without correction could result in artifacts in reconstructed images and using the recorded spectrum in a material decomposition process without compensation or correction could produce inaccuracies. In addition, the energy response of PCXDs can be nonlinear even though input count rates are sufficiently low.
Figure 1.
(Top) The basic architecture of an individual channel in the ASIC. (Bottom) When the pulse height exceeds a given energy threshold value, a count will be added to an associated counter. Coincident photons will be recorded as one event with a higher energy level than the original energies.
Faster detectors with smaller deadtime losses and fewer spectral distortions are being developed, but it may be practically impossible to achieve a linear dynamic range for both a low input count rate of heavily attenuated x-ray beams (e.g., in a coronal projection image through the sternum and backbone) and a very high input count rate of unattenuated beams. Alternatively, hardware-based pileup rejectors can reduce or eliminate the spectral distortion caused by peak pileup,16 where coincidences during the initial part of pulses are recorded as a single count at a higher energy than the original pulse’s energies. However, the efficiency of such rejectors could be limited (e.g., 50%) for various reasons.16, 17, 18, 19 In addition, it is quite challenging to implement pileup rejectors in a PCXD for clinical CT, since they need to operate at very high count rates. The rejectors would also consume additional power and require considerable space in the dense parallel channel application-specific integrated circuit (ASIC), which may degrade the noise performance. The required operational count rates for clinical x-ray CT detectors can be as large as 3–50 million-counts-per-second-per-square-millimeter (Mcps∕mm2) for the attenuated portions of the beam when the unattenuated count rate incident onto a bowtie filter is 1 billion cps∕mm2 (or 1000 Mcps∕mm2).20
Thus, while the detector’s speed and energy response may be improved in the future, it is also necessary to develop algorithmic methods to compensate for the energy response, the deadtime losses, and the spectral distortions, in order to take full advantage of the energy discrimination capabilities of PCXDs. The key to successful compensation methods is developing accurate models of the corresponding properties of the PCXDs.
The detection mechanism for most PCXDs can be modeled well by either the nonparalyzable or paralyzable model (discussed later).17 Analytical models of deadtime losses have been discussed thoroughly for both of these detector models.17 Analytical models for spectral distortions have also been discussed in the literature.16, 19, 21, 22, 23, 24 A new model has recently been developed for nonparalyzable detectors,25 which takes into account the following factors: the probability distribution of time intervals between photons, the probability distribution of photon energies, and a more realistic average pulse shape. The aim of this study was to evaluate the agreement between data measured using the DXMCT-1 (Refs. 5, 8) and those estimated from the analytical models for the energy response, deadtime losses, and distortions in the recorded spectrum.
The structure of this paper is as follows. In Sec. 2, we describe the DXMCT-1 used in this study and the two detection mechanism models (nonparalyzable and paralyzable). Section 2 also includes descriptions of the analytical models of the energy response, deadtime losses, and spectral distortions. Section 3 outlines evaluation methods and results are presented in Sec. 4. In Sec. 5, relevant issues are discussed and goals for further research are outlined. Key symbols, abbreviations, and acronyms used in this paper are gathered in Table 1.
Table 1.
Key symbols, abbreviations, and acronyms used in this paper.
| Symbols | Meanings |
|---|---|
| τ | Detector deadtime |
| Mcps, kcps | Million- or thousand-counts-per-second, a unit of count rates |
| a | The true count rates incident onto detectors |
| aR | The recorded count rates by detectors |
| c1,c2,c3 | Parameters determined for each threshold used in Eq. 1 to model non-linear relationship between the input photon energies and pulse heights. |
| t1,t2,t3,b2 | Parameters used to model DXMCT-1’s pulse shape with two triangles. See Ref. 25 for more details. |
| NModel(E) | The mean number of recorded counts at energy E including pulse pileup effects estimated by Eq. 6. |
| NPCXD(E) | The mean number of recorded counts at energy E measured by DXMCT-1. |
| S0(E) | The probability density function of the incident x-ray spectrum. |
| Pr(rec|aτ) | The probability of events being recorded given true count rate a and deadtime τ. See Eq. 3. |
| Pr(m|rec) | The probability of pileup order m given the events-of-interest being recorded. See. Equation 7. |
| Pr(E|m) | The probability of the events-of-interest being recorded at energy E with pileup order m. See Eq. 13. |
| RMSD | The root mean square difference |
| COV | The coefficient of variation, i.e., RSMD divided by the mean of measurements in percentage |
ANALYTICAL MODELS
In this section we will first explain some of the features of the DXMCT-1 including the counting mechanism. We will then outline the two simplified detection models of counting detectors: the nonparalyzable and paralyzable models. Finally, we will describe the analytical models for the energy response, deadtime losses, and the spectral distortions caused by pulse pileup effects.
DxRay’s DXMCT-1 PCXD
The PCXD used in this study (model DXMCT-1) was developed by DxRay, Inc. (Northridge, CA).5, 8 A ∼3 mm thick cadmium telluride (CdTe) block consisted of 16×16 pixels (pixelated anode) with a pitch of ∼1 mm. Two such blocks were assembled and connected to four ASICs. Each ASIC contained 128 parallel channels, each consisting of an amplifier, a pulse shaper, two digital-to-analog converters (DACs), two pulse height comparators (energy windows), and two counters per detector pixel (see Fig. 1, top). Thus, there were 1024 comparators (=16×16 pixels-per-block×2 blocks×2 comparators-per-pixel) in total in this PCXD. A negative bias voltage was applied to a continuous metallized thin film cathode on the incident side of the CdTe crystal, creating an electric field along the depth direction of the crystal.
The energy deposited by each x-ray photon generates an electric charge. The charge then travels within the detector volume toward the electrodes and generates a pulse that is processed by the ASIC. The height of the pulse generated by a photon is compared with a given energy threshold value. A count is registered in the counter associated with the given comparator if the pulse height exceeds the threshold value. Subtracting counts in counters from adjacent energy threshold values yields the counts in the energy window defined by the two threshold values. Thus, the highest energy window does not have an upper bound. The DAC allows for fine tuning of the threshold values for each channel in order to compensate for channel-to-channel variations. The readout sequencer is operated at 50 MHz, allowing for a complete readout of all the counters in parallel in about 5 μs. The details of the DXMCT-1 architecture have been described previously.5, 8
Nonparalyzable and paralyzable detection models
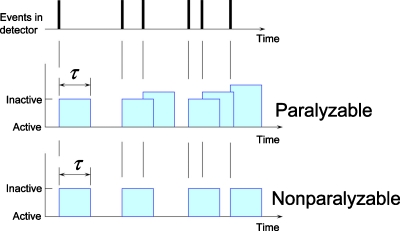
The detection mechanism for most PCXDs can be modeled well to a first approximation by either the nonparalyzable or paralyzable models,17 although subtle effects often cause detectors to behave somewhere in-between. When a detector is in the active state, the first photon incident on the detector will put the detector into the detection (inactive) state for a finite period of time called the deadtime (or resolving time) τ. All photons incident on the detector during the deadtime contribute (potentially) to the pulse shape of the recorded count. For nonparalyzable detectors, such photons will not reset the time clock for the deadtime and the detector will return to the active state after the deadtime (Fig. 2). By contrast, in paralyzable detectors a detected photon resets the time clock and the detector returns to the active state at time τ after an event if, and only if, there are no additional incident photons during the deadtime interval. For low incident count rates (aτ⪡1, where a is the incident count rate), the two models provide identical predictions of the count rate losses.17
Figure 2.
The paralyzable detection model (middle) and the nonparalyzable detection model (bottom). Quasicoincident events will result in lost counts and a distorted recorded spectrum.
Each comparator of the DXMCT-1 detector acts as an independent pulse height analysis detector with a variable deadtime. The comparator stays active, while the pulse height is below a given threshold value. The comparator switches to the waiting state when a pulse height exceeds the threshold energy, and it counts an event when the pulse height falls below the threshold value. It then becomes active again nearly instantly. Therefore, as can be seen in Fig. 1, the deadtime may depend on the energy threshold values—a comparator with a lower energy threshold value has a longer waiting time, and, thus, it can be modeled with a larger deadtime τ. Moreover, there is no fixed pulse processing time, as it may be extended by coincident photons. Nevertheless, we will assess both the nonparalyzable and paralyzable detection models to see which one better models the performance of the DXMCT-1.
Energy response
The energy response of the DXMCT-1 involves the following factors: a nonlinear photon energy-pulse height response curve and a shift-variant finite energy resolution. The energy of the photon is measured by the height of the pulse H [in millivolts (mV)] generated by the photon. However, the pulse height, especially above 60 keV, may not be linearly related to energy. Thus, we model the pulse height using the nonlinear relationship,
| (1) |
where E is the photon energy, H is the measured pulse height, and c1, c2, c3 are the three parameters that will be determined by a calibration procedure for each comparator. The photon energy-pulse height response curves begin to saturate above 100 keV. This characteristic was chosen by design in order to reduce ASIC power consumption while providing the energy resolution needed to separate high and low energy windows for dual energy CT applications.
In general, PCXDs have a finite energy resolution, which is described by FWHM(E0)∕E0 (and often expressed as a percentage), where FWHM(E0) is the full width at half maximum of the recorded energy spectrum for a monochromatic incident spectrum with energy E0. With a linear system, where the statistical broadening of the peak dominates the energy resolution, FWHM(E0) is proportional to ; thus, the percentage of the energy resolution improves as the photon energy increases.17 In a previous experiment with the DXMCT-1,8 the measured FWHM at 60 keV was 7 keV or 11.6%, while the measured FWHM at 122 keV was 35 keV or 28%. This was substantially larger than predicted for a linear system where one would expect a resolution of or 8%). This larger FWHM results from the above-discussed nonlinear photon energy-pulse height relationship. We can model this shift-variant finite energy resolution as shown in Appendix0; however, as also shown in Appendix0, the effect of such energy resolutions on the predicted spectrum was very limited under the conditions used in the study. Thus, for the sake of computational efficiency, we did not model the finite energy resolution in the remainder of this study.
Deadtime losses
The recorded count rate aR for a given incident count rate a and deadtime τ can be expressed as
| (2) |
where Pr(rec|aτ) is the probability of events being recorded, as discussed in more detail in Ref. 17, and is given by
| (3) |
Here, we provide brief explanations of Eq. 3, starting with nonparalyzable detectors. When the recorded count rate is aR, the fraction of time that the detector is inactive (dead) is given by aRτ. Thus, the rate at which counts are lost during the time period is aaRτ, which is also given by a−aR. Equating these two expressions for the lost count rate, we have a−aR=aaRτ. Solving for aR and dividing both sides of the equation by a, we get Pr(rec|aτ)=aR∕a=1∕(1+aτ).
Now we consider paralyzable detectors. The distribution function (also the probability density function) for time intervals between adjacent random events is17
| (4) |
For a recorded event-of-interest, the time interval between the previous event and the initiation of the pulse processing for the event-of-interest must be larger than τ. Thus,
| (5) |
Distortions of the recorded spectrum
The model for spectral distortions caused by pileup effects previously proposed by Taguchi et al.25 assumes use of a nonparalyzable detector. Below, we briefly outline the model of the nonparalyzable detector as well as the way to adapt the model to paralyzable detectors with minimal change. A full description of the model and results of Monte Carlo simulations can be found in Ref. 25.
The mean number of recorded photons at energy E resulting from pulse pileup, NModel(E), can be expressed as the product of three probabilities,
| 6 |
where Δt is an acquisition time period, Pr(m|rec) is the probability of pileup order m, given the events-of-interest being recorded, where pileup order m means that m+1 photons contribute to one recorded count and Pr(E|m) is the probability density function of the recorded spectrum with a given pulse pileup order m. The first probability, Pr(rec|aτ), has been discussed in Sec. 2D. The second probability Pr(m|rec) has been discussed previously17 and is
| (7) |
Pr(m|rec) for nonparalyzable detectors is the Poisson probability of having m events during time τ given the mean number of counts, aτ. Pr(m|rec) for paralyzable detectors is a product of the following two probabilities: (1) the probability that m+1 photons hit the detector consecutively, each arriving within the deadtime from the previous photon; and (2) the probability that the time interval between photon m+1 and the subsequent photon, m+2, is larger than the deadtime (and thus the subsequent photon is the first photon in a new recorded count). The first probability repeats times, and the second probability is the same as Eq. 5.
For the nonparalyzable detection model, the third probability in Eq. 6, Pr(E|m), was discussed in detail by Taguchi et al.25 and involves more complex equations than the first two probabilities. Strictly speaking, this probability for the paralyzable detection model is different, and thus must be derived from scratch. However, preliminary work including Monte Carlo simulations indicated that this probability is similar to that for the nonparalyzable model. Thus, for simplicity we have used the expression for Pr(E|m) proposed in Ref. 25 for both nonparalyzable and paralyzable detectors.
The model takes into account the shape of pulses and the probability distributions of the time intervals between photons and of the incident photon energies. The bipolar pulse shape of the DXMCT-1 detector is approximated by two triangles, which are treated separately. The positive peak portion of the pulse is modeled by an asymmetric triangle, allowing us to model the peak pileup effect accurately and efficiently. A right angle triangle, fitted to the negative part of the pulse, is used to fit the tail of the pulse. The tail of the pulse is sufficiently long that it affects the recorded energy of subsequent events: for bipolar-shaped pulses, a peak overlapping the tail of a preceding pulse results in a smaller recorded energy. This effect is called tail pulse pileup.16 The recorded spectrum that results from the peak pileup effect, Prpeak(E|m), is calculated in a recursive fashion as
| (8) |
and
| (9) |
where S0(E) is the probability density function of the true incident x-ray energy (i.e., the energy spectrum),
| (10) |
denotes the probability density function of the recorded energy E given the incident energies, Em−1 and E1, with pileup order m; and
| (11) |
is the differential probability density function of time intervals, s1, for the pileup order m. The recorded energy ER for the incident energies, Em−1 and E1, and the time interval of s1, ER(s1;Em−1,E1), can be calculated efficiently thanks to the approximation by the asymmetric triangle. The superscript (1) means that the pulse pileup order m=1; our pulse pileup model recursively and efficiently calculates the recorded energy with higher pulse pileup orders with an approximation that a virtual photon with Prpeak(Em−1|m−1) is incident on the detector at t=0. A thorough description of the model and results of Monte Carlo simulations were provided in Ref. 25.
Using the Poisson probability that n photons will arrive within the time period of the tail of the pulse, t3, for a given count rate a, the baseline energy shift caused by the tail pileup effect, Prtail(Etail), is calculated by
| (12) |
where is the mean energy of the incident spectrum. The energy shift can be calculated from the geometry of the right angle triangle (see Ref. 25).
By taking into account the distribution of energy shifts caused by the tail pileup effect, Prtail(Etail), on the recorded spectrum, which results from modeling the peak pileup effect, Prpeak(E|m), we obtain the probability density function of the recorded energy spectrum including pulse pileup order m,
| (13) |
Notice that this model requires relatively modest amounts of information about the PCXD, i.e., the pulse shape and the deadtime τ. Given the estimated incident count rate a and energy spectrum S0(E), the model then predicts the distorted recorded spectrum that results from pulse pileup effects.
EVALUATION METHODS
In this section we outline the experimental apparatus and settings used and the data analysis methods used to assess the energy response, the deadtime losses, and the spectral distortions caused by pulse pileup effects. Four detector parameters were estimated: c1, c2, and c3 in Eq. 1 were estimated via the energy calibration, and the detector deadtime τ was estimated from the count rate versus tube current curves. The parameters describing the triangles that approximated the pulse shape were not specific to each comparator and we used the same values determined in Ref. 25: t1=0.284×τ, t2=0.850×τ, t3=8.253×τ, and b2=−0.0635. In addition, we assumed that the incident count rate a from an x-ray tube was proportional to the tube current, I, i.e.,
| (14) |
where k is the proportionality constant.
In short, excluding the pulse shape parameters, we estimated five parameters (c1, c2, c3, τ, and k) and the incident x-ray spectrum S0(E) for each comparator, and we evaluated the agreement between the analytical models and the detector outputs. No additional empirical parameters were used in the models.
Experiments were performed by sweeping the threshold voltage settings from 900 to 100 mV with an increment of −2 mV between acquisitions. In these experiments, we acquired a set of count data, i.e., the counts in each pixel above each threshold setting, for a given threshold setting. A set of acquisitions was performed while incrementing the energy threshold settings. The spectral response of a detector with a greater number of energy bins and a single exposure was then synthesized from these data. Note that this experimental procedure was used in order to assess the spectral response of the detector. When these detectors are used for CT acquisition, the energy threshold value will be fixed and multiple projections will be acquired over a set of projection views. The number of energy outputs depends on the number of energy comparators, and it will likely be under 10 even in the future.
Energy response
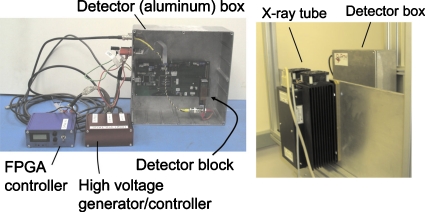
We estimated the three parameters that describe the photon energy-pulse height relationship presented in Eq. 1 for each energy comparator using 99 mTc (140 keV) and 57Co (122 keV) radionuclide sources and x-ray beams corresponding to four x-ray tube voltages (35, 50, 65, and 80 kVp). The DXMCT-1 was placed 150 mm from the x-ray focal spot (see Fig. 3, right). There was no filtration except for the x-ray tube exit window and the detector entrance window (an aluminum plate with a thickness of 1.2 mm). Data were acquired by sweeping the threshold values as described above. The measurements were repeated 5 times for each of the x-ray tube voltage settings, 29 times for 99mTc, and 24 times for 57Co. The mean counts of multiple measurements at the same threshold value were calculated. The counts between two thresholds were calculated by subtracting the mean counts acquired with adjacent threshold settings. The resulting difference represents the number of pulses with heights lying between the two threshold settings. The set of such counts is thus the pulse height spectrum and is hereafter referred to as an uncalibrated energy spectrum.
Figure 3.
The DXMCT-1 (left) and the experimental setting (right).
The x-ray tube current and the time period per acquisition for each tube voltage setting were 50 μA and 500 ms for 35 kVp, 10 μA and 1 s for 50 kVp, 10 μA and 500 ms for 65 kVp, and 10 μA and 1 s for 80 kVp. The tube currents were sufficiently low to make pulse pileup effects negligible. The energy threshold voltage value that corresponded to an x-ray tube voltage was found as follows. First, the maximum counts in the uncalibrated x-ray spectrum were determined for a particular x-ray tube voltage setting. Next, the threshold voltage values that corresponded to 20% and 10% of the maximum count were found on the higher energy side of the uncalibrated spectrum. This line between these two count values was linearly extrapolated to find the threshold voltage where the line crossed zero. This threshold voltage value was assumed to correspond to an energy equal to the x-ray tube voltage.
The radionuclide sources were used to provide additional energy calibration points. Each source was placed in front of the x-ray tube with the x-ray generator off. For both 99mTc and 57Co, the uncalibrated spectrum was fitted by a scaled normal distribution using least-squares curve fitting methods. The threshold voltage corresponding to the maximum of the normal distribution was assigned to the photopeak energy of the isotope. The energy resolution, FWHM of the spectrum response, of the DXMCT-1 was 7 keV with 241Am and 35 keV with 57Co (Ref. 8), which was not sufficient to resolve the lower abundance of 57Co at 136 keV.
Using the six voltage threshold values that correspond to the pulse heights obtained by the above described procedures for each comparator, the three parameters that characterize the pulse height-energy relationship in Eq. 1 were determined using least-squares fitting. To quantify the quality of the fit, we computed the coefficient of variation (COV) [i.e., the ratio of the root mean square difference between the measured value and the computed value using Eq. 1 and the estimated parameters to the mean of six pulse height values expressed as a percent] for each comparator.
Deadtime losses
We used the same setting as outlined in Sec. 3A. The DXMCT-1 was placed 150 mm from an x-ray focus (see Fig. 3, right). The x-ray tube voltage and the time period per acquisition were fixed at 80 kVp and 10 ms, respectively. The tube current values used were 10, 25, 50, 75, 100, 200, 300, 400, 500, 800, and 1000 μA. Data were acquired by sweeping the threshold values as described above. The measurements were repeated 20–28 times at each of the tube current settings. Notice that considering the geometrical magnification factor, the x-ray intensity with the tube current of 1000 μA corresponded to that with 54 mA (=1 mA×[1100 mm∕150 mm]2) with no bowtie filter for clinical CT scanners.
The mean and variance of counts over multiple measurements obtained at each threshold value were calculated. It was found that the mean and the variance were comparable (<10% difference) when threshold values were larger than the corresponding photon energy of 17 keV, indicating that measurements were Poisson distributed. In contrast, the deviation between the mean and the variance increased monotonically below 17 keV, indicating the presence of a non-Poisson distributed noise source, such as electronic noise. We therefore considered that recorded counts above 17 keV were generated by only x-ray photons, and, thus, we used them in this section.
For each comparator, the mean counts of multiple measurements, aR, were obtained at each of the tube current settings. Then, the deadtime τ of Eqs. 2, 3 and the conversion coefficients k of Eq. 14 for both nonparalyzable and paralyzable detection models were estimated from the counts obtained using nine tube current values ≤500 μA by the weighted least-squares method. We will discuss the reason why measurements at 800 and 1000 μA were not used in this estimation later.
The mean and the standard deviation of each τ and k over all of the comparators were calculated. The recorded count rate model, Eq. 2, was evaluated at the nine tube current settings and COVs for nonparalyzable and paralyzable detection models, respectively, were calculated.
Distorted, recorded spectrum with pulse pileup effects
The same data outlined in Sec. 3B were used. The mean counts of multiple measurements at the same threshold value were calculated for each of tube current settings. The counts between two threshold values were calculated by subtracting the mean counts acquired by adjacent threshold settings. This uncalibrated spectrum was then scaled and converted to the recorded spectrum NPCXD(E) in the unit of counts per keV with an increment of 1 keV using the result of the energy response calibration performed in Sec. 3A.
The probability density function of the true incident spectrum S0(E) was estimated for each comparator from the recorded spectrum at 10 μA as follows: A 21-point median filter was applied to the recorded spectrum with 10 μA. The minimum counts per keV Nmin and the corresponding energy Emin were found between 6 and 25 keV. The counts below Emin were modified to avoid the effect of the electric noise floor on the incident spectrum. Counts NPCXD(E) for Emin−4 keV≤E<Emin were replaced by NPCXD(Emin−1 keV)=0.875×Nmin, NPCXD(Emin−2 keV)=0.625×Nmin, NPCXD(Emin−3 keV)=0.375×Nmin, and NPCXD(Emin−4 keV)=0.125×Nmin, respectively, and NPCXD(E≤Emin−5 keV) were set at 0. Finally, S0(E) was obtained by dividing NPCXD(E) by the sum of NPCXD(E) over all energies. The effect of the shift-variant finite energy resolutions was found to be negligible in this study, probably because there was no sharp edge in the incident spectrum above 50 keV (see Appendix0).
For each comparator, the recorded spectra NModel(E) were estimated for both nonparalyzable and paralyzable detectors, respectively, for each tube current setting using the model described in Sec. 2E with τ and k estimated in Sec. 3B and S0(E) estimated above. As a reference, S0(E) was scaled by the recorded count rate as aR×S0(E) for each tube current setting.
At each tube current setting, the root mean square difference (RMSD) between the spectrum estimated by the model, NModel(E), and the mean spectrum measured by the DXMCT-1, NPCXD(E), was calculated over the energy range between 30 and 150 keV. The COV was then calculated by dividing the RMSD by the mean of the NPCXD(E) between 30 and 150 keV. The RMSD and COV were also calculated between aR×S0(E) and NPCXD(E).
EVALUATION RESULTS
Fourteen bad pixels among 512 pixels (28 out of 1024 comparators) that exhibited unusual characteristics such as extremely large count rates and convex energy-pulse height curves were identified and excluded from this study. Thus, 996 comparators in total were examined. Below we present the evaluation results.
Energy response
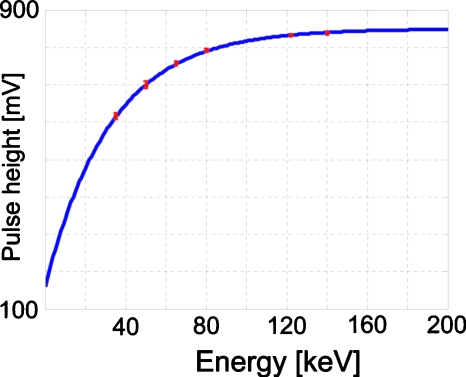
The mean and the standard deviation of the three parameters in Eq. 1 were c1=848.3±5.3 mV, c2=688.4±18.7 mV, and c3=0.0310±0.0014 keV−1.
Figure 4 shows the mean energy response curve, i.e., the photon energy-pulse height curve, of all of the comparators. The standard deviation over all of the comparators was small. The mean COV value of all of the comparators was as small as 0.2%, demonstrating that Eq. 1 modeled the energy response of all of the comparators very well.
Figure 4.
The energy response curve, i.e., the photon energy-pulse height curve. The circles and the error bars are the means and the standard deviations of measurements obtained over all of the comparators. The curve is plotted by Eq. 1 with the means of the three parameters c1, c2, and c3 of all of the comparators.
Deadtime losses
The mean and the standard deviations of the deadtime τ and the conversion coefficient k for all of the comparators were τ=146.9±6.3 ns and k=30.93±3.17 kcps∕mm2∕μA for the nonparalyzable detection model and τ=81.2±2.2 ns and k=25.35±1.88 kcps∕mm2∕μA for the paralyzable detection model. The standard deviation of τ over all of the comparators was quite small: 4.3% for the nonparalyzable detection model and 2.7% for the paralyzable detection model.
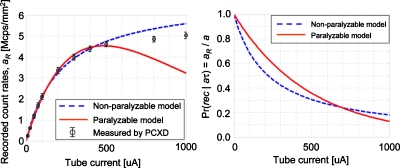
Figure 5 (left graph) plots the estimated recorded count rates with the mean parameter values of all the comparators for both nonparalyzable and paralyzable detection models against tube currents, together with the mean of measured count rates and the standard deviation over multiple comparators at each of the tube current settings. Both the nonparalyzable and paralyzable models agreed with the measurements equally well up to 500 μA (which is the range from which the parameters τ and k were estimated), while the nonparalyzable fit better with tube currents of 800 and 1000 μA. The COV calculated up to 500 μA was 3.1% for the nonparalyzable detector and 2.5% for the paralyzable detector.
Figure 5.
(Left) The recorded count rates aR. The curves were plotted using the models with the mean of the estimated parameters of all the comparators. The circles and error bars show the mean counts and the standard deviation over multiple comparators measured at each of the tube current settings. (Right) Probability of events being counted, Pr(rec|aτ)=aR∕a=aR∕(kI), plotted using the means of the parameters τ and k estimated for each of the two detector models.
Figure 5 (right graph) also shows the probability of events being counted, Eq. 3, for both nonparalyzable and paralyzable detection models plotted using the means of the estimated τ and k. The probabilities decrease as the tube current increases, and they are below 0.4 with tube currents above 500 μA. The conventional belief on photon counting detectors among the nuclear medicine community is that detectors need to be operated with the probability above 0.8. We aim to operate the detector with smaller probabilities for x-ray CT, such as 0.6–0.7 but not as small as 0.4, because the quality of the data will be not acceptable due to the spectral distortion and lost counts. This is the reason why we estimated parameters τ and k using measurements with tube currents of up to 500 μA: we think it makes more sense if detector parameters are estimated utilizing conditions under which the detectors will be operated. Note that the probability Pr(rec|aτ) for the paralyzable detector was larger than for the nonparalyzable detector when the tube current was less than 600 μA. This is because the incident count rate a was estimated using the estimated conversion coefficient k by a=k×I and the horizontal axis of the plot is the tube current values I. The conversion coefficient k for paralyzable detector is smaller, thus, the estimated value of a was smaller for the paralyzable detector at a given tube current I than that for the nonparalyzable detector. If Pr(rec|aτ) is plotted against aτ, the probability for the nonparalyzable detector, Eq. 3 top, is always equal to or larger than that for the paralyzable detector, Eq. 3 bottom.
Distorted, recorded spectrum with pulse pileup effects
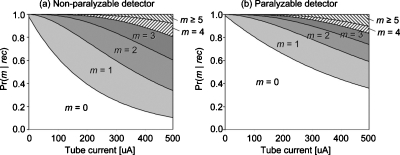
Figure 6 presents the area plots of the probability of pileup order m for both the nonparalyzable and paralyzable detectors, given the events-of-interest recorded. With both detector types, the probability of higher order pileup increases with tube currents. Note that over the count rate range that we tested, the paralyzable detector always has a larger probability of lower order pileups than the nonparalyzable detector. This is because the estimated deadtime τ and the estimated incident count rate a=k×I were different for the two models. For example, the probability of not being piled up given the events-of-interest being recorded is exp(−aτ) for both paralyzable and nonparalyzable detector types, as can be seen in Eq. 7. However, the estimated relative count rate aτ for the paralyzable detector was much smaller than that for nonparalyzable detector (the ratio was 0.46:1), resulting in larger probabilities of events not being piled up for paralyzable detectors than for nonparalyzable detectors.
Figure 6.
Area plots of the probability of pileup order m given the events-of-interest being recorded, Pr(m|rec).
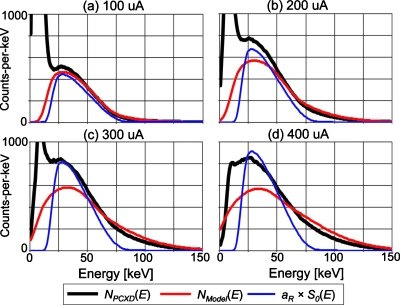
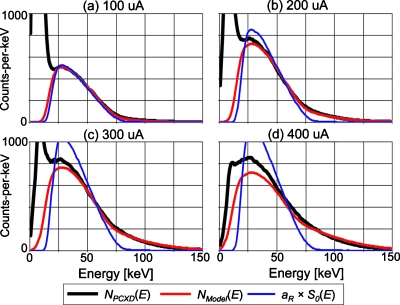
Figure 7 shows the mean energy spectra of all of the comparators with the nonparalyzable detection model with four different tube current settings. All data were collected with a tube voltage of 80 kVp. The following three spectra-types are presented at each of the tube current settings: one estimated by the spectral distortion model with nonparalyzable detectors, NModel(E); one estimated by simply scaling the incident spectrum, aR×S0(E); and one measured by the DXMCT-1, NPCXD(E). Pulse pileup effects can be observed in the measured spectrum—there were more counts recorded at energies above 80 keV with larger tube currents than with smaller tube currents. Notice that despite the very large amount of deadtime losses, the spectrum predicted by the spectral distortion model agreed reasonably well with the measured spectrum, especially at energies higher than 50 keV. In contrast, deviations between the scaled incident spectrum and the measured spectrum increased as the tube currents increased, especially with energies higher than 50 keV. Counts recorded below 15 keV in the measured spectrum appear to contain significant amount of electronic noise. The counts were decreased when larger tube current values were employed. This was not because the electronic noise was reduced but because they were added to actual pulses generated by photons and recorded at higher energies.
Figure 7.
The following three energy spectra for a tube setting of 80 kVp are shown: the mean energy spectrum measured by all of the comparators of DXMCT-1 (labeled NPCXD[E] in the figure); the energy spectrum predicted by the model of the spectral distortion caused by pulse pileup effects with the nonparalyzable detection model (labeled NModel[E]); and the scaled incident spectrum, aR×S0(E). The estimated incident count rate and deadtime loss ratio under the four tube current settings were 3.1 Mcps∕mm2 and 31% loss at 100 μA, 6.2 Mcps∕mm2 and 48% loss at 200 μA, 9.3 Mcps∕mm2 and 58% loss at 300 μA, and 12.4 Mcps∕mm2 and 64% loss at 400 μA.
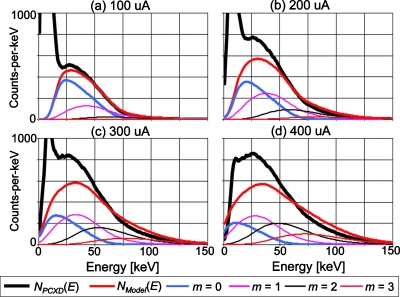
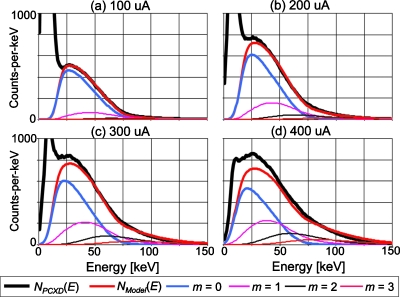
Figure 8 shows the mean energy spectra at pileup order m calculated by the model with the same condition as Fig. 7. The energy that corresponds to the peak of the spectrum with m=0 decreased as the tube currents increased (often referred to as a baseline energy shift), indicating the effect of the negative lobe of the bipolar pulse shape. Comparing the spectra predicted by the model to those measured by the detector comparators, we note that the model might have overestimated both the amount of the baseline shift and the contribution of higher order pileups.
Figure 8.
The following energy spectra for a tube setting of 80 kVp are shown: the mean energy spectrum measured by all of the comparators of DXMCT-1 (labeled NPCXD[E] in the figure); the energy spectrum estimated by the model of the distorted, recorded spectrum with the nonparalyzable detection model (labeled NModel[E] in the figure); and those with pulse pileup orders m (labeled m=0, 1, 2, and 3, respectively, in the figure). The other conditions are the same as in Fig. 7.
Figure 9 shows the mean recorded spectra of all of the comparators with the paralyzable detection model at four different tube current settings. It is apparent that, overall, the energy spectra estimated by the paralyzable detection model agreed with the measured spectra very well—better than the estimation by the nonparalyzable detection model (compare Fig. 9 with Fig. 7). The counts recorded at energies above 50 keV are much closer to the measured ones, and the counts between 25 and 50 keV are larger than those with the nonparalyzable detection model, and are closer to the measurements.
Figure 9.
The following three energy spectra for a tube setting of 80 kVp are shown: the mean energy spectrum measured by all of the comparators of DXMCT-1 (labeled NPCXD[E] in the figure); the energy spectrum predicted by the model of the spectral distortion caused by pulse pileup effects with the paralyzable detection model (labeled NModel[E]); and the scaled incident spectrum, aR×S0(E). The estimated incident count rate and deadtime loss ratio under the four tube current settings were 2.0 Mcps∕mm2 and 19% loss at 100 μA, 5.1 Mcps∕mm2 and 34% loss at 200 μA, 7.6 Mcps∕mm2 and 46% loss at 300 μA, and 10.1 Mcps∕mm2 and 56% loss at 400 μA.
Figure 10 shows the recorded spectra at pileup order m calculated by the model with the same condition as Fig. 9. Compared with the corresponding results from the nonparalyzable detection model (Fig. 8), it can be seen that the amount of baseline energy shift was smaller, and that there were fewer counts with higher orders of pileup, as suggested by Pr(m|aτ) (see Fig. 6).
Figure 10.
The following energy spectra for a tube setting of 80 kVp are shown: the mean energy spectrum measured by all of the comparators of DXMCT-1 (labeled NPCXD[E] in the figure); the energy spectrum estimated by the model of the distorted, recorded spectrum with the paralyzable detection model (labeled NModel[E] in the figure); and those with pulse pileup order m (labeled m=0, 1, 2, and 3, respectively, in the figure). The other conditions are the same as in Fig. 9.
Table 2 summarizes the quantitative analyses of the estimated spectra of all of the comparators. The RMSD and the COV were calculated between the spectra estimated by the model and the spectra measured, and between the spectra obtained by scaling the incident spectra and the spectra measured. The distorted spectra predicted by the model were much closer to the measured spectra than were the scaled incident spectra. The spectral distortion model with the paralyzable detection model performed better than the model with the nonparalyzable detection model. The COV values with the tube currents of 100–300 μA were as small as 3.7%–7.2 % with the paralyzable detection model, even though the estimated deadtime loss ratios were as large as 19%–46%.
Table 2.
The RMSD and the COV calculated against the recorded spectra measured by all of the comparators of the DXMCT-1. The numbers in brackets below the tube current values are the mean counts per keV between 30 and 150 keV.
| Scheme | Tube current (μA) | |||||||||
|---|---|---|---|---|---|---|---|---|---|---|
| 25 [30.9] | 50 [63.9] | 75 [97.4] | 100 [119.6] | 200 [192.9] | 300 [234.7] | 400 [261.6] | 500 [277.5] | |||
| NPa, NModel(E)b | 10.8 | 7.8 | 11.1 | 12.3 | 53.0 | 73.9 | 85.3 | 87.5 | ||
| RMSD | NPa, aR×S0(E)c | 6.6 | 17.3 | 30.8 | 37.2 | 62.7 | 80.5 | 104.4 | 128.8 | |
| [counts] | Pd, NModel(E)b | 3.7 | 1.7 | 5.8 | 4.5 | 10.0 | 17.1 | 41.3 | 71.8 | |
| Pd, aR×S0(E)c | 3.9 | 7.5 | 11.6 | 16.5 | 49.7 | 95.2 | 130.5 | 153.3 | ||
| NPa, NModel(E)b | 32.7 | 11.7 | 11.6 | 10.2 | 27.3 | 31.3 | 32.4 | 31.3 | ||
| COV | NPa, aR×S0(E)c | 20.2 | 25.9 | 32.1 | 30.7 | 32.3 | 34.1 | 39.6 | 46.0 | |
| [%] | Pd, NModel(E)b | 11.3 | 2.6 | 6.0 | 3.7 | 5.2 | 7.2 | 15.7 | 25.7 | |
| Pd, aR×S0(E)c | 12.0 | 11.3 | 12.1 | 13.6 | 25.6 | 40.3 | 49.5 | 54.8 | ||
Nonparalyzable detection model.
Estimated by pulse pileup model, Eq. 6.
PDF of incident spectrum S0(E) scaled by aR.
Paralyzable detection model.
DISCUSSION AND CONCLUSIONS
We have measured and evaluated the performance characteristics of DxRay’s DXMCT-1 PCXD at various x-ray tube currents (input count rates) and compared them with those predicted by analytical models in terms of the energy response, the deadtime losses, and the recorded energy spectrum with pulse pileup effects. The results demonstrated excellent agreement between them, especially when the paralyzable detection model was used. The COV values were 0.2% for energy response comparisons, 2.5% for the count rate curve comparisons for data with up to as much as a 60% count loss, and 3.7%–7.2% for the recorded spectrum comparisons with the recorded, distorted spectrum with pulse pileup effects with count losses of 19%–46%. We conclude that the models and the DXMCT-1 PCXD were in good agreement. PCXDs might be able to be operational at up to a 30%–40% deadtime loss if there are good algorithmic compensation schemes that integrate the models into the forward imaging process and compensate for the performance of PCXDs during the image reconstruction process. We are developing such compensation schemes for the DXMCT-1 PCXD.
The detector models we used in this study need only the following five parameters for each comparator in addition to the (mean) shape of the pulse: the three parameters, c1, c2, and c3, in Eq. 1 for the photon energy-pulse height curve, the detector deadtime τ, and the tube current-to-incident count rate conversion coefficient k in Eq. 14. These parameters were estimated during the calibration steps; there were no empirical parameters used in the models.
For each of the two detection models, nonparalyzable and paralyzable, one deadtime parameter each was estimated from counts above a fixed energy threshold of 17 keV. The parameters accurately predicted the recorded counts above various energy threshold values. The idealized response of a comparator in the DXMCT-1 PCXD detector should act as a paralyzable detector with a variable deadtime, as discussed in Sec. 2B. In practice, however, all detectors deviate from theories. When detectors are operated under a large count rate, additional factors such as the detector current, the ASIC power, and operational baseline voltages can cause a deviation from paralyzable behavior above saturation. We think that is why the nonparalyzable detection model provided a better fit to the measured count rates in Fig. 5.
The quality of the fit of the models was evaluated using data that were also used to estimate parameters for the models. Thus, we acknowledge that we have not tested whether the models can prospectively predict measured data that were not used for estimating parameters. Instead, what we evaluated was the quality of the fit of the models in the best case scenario, where measured data were consistent except for measurement statistics.
Our experimental results represent the performance of GE’s LightSpeed VCT scanner equipped with the DXMCT-1.5 As discussed below, we anticipate continuous development and improvement of the photon counting detectors’ pixel size and count rate from various manufacturers. Even with such advances, the methods and scenarios we presented in this paper should be applicable to different photon counting detectors, especially since the models used no empirical parameters. The x-ray tube potentials used in this experiment (maximum 80 kVp) were lower than that in most clinical settings (the standard setting is 120 kVp with a range of 80–140 kVp). When the DXMCT-1 is operated with higher tube potentials and the threshold energy is set above 70 keV, the limited energy resolution for the higher energy that results from the nonlinear photon energy-pulse height curves (see Fig. 4) may degrade the utility of the energy window. Note, however, that there will be no impact on the results if energy threshold values are set at lower energies (e.g., below 60–70 keV).
The longitudinal temporal stability of this detector has not been tested. It is an important practical aspect as a commercial product and, thus, should be evaluated later. Nevertheless, we are somewhat optimistic about the stability issue because the experimental data used in this study were acquired manually and sequentially over 14 days, while multiple measurements of one setting took as long as 40 min. Yet the detector models that used a set of parameters estimated from such data gave results that were in excellent agreement with the measured data, indicating that the DXMCT-1 is reasonably stable. However, we acknowledge that the longitudinal stability should be tested such that calibration data are acquired one day, and the parameters of the models are estimated based on such data. Another set of performance characteristics will be measured on another day, e.g., 10 days later. The agreement will be evaluated between the performance characteristics newly measured by the PCXD and those predicted by the models using parameters obtained 10 days earlier. The longitudinal temporal stability will be studied in such a manner in the future. Nevertheless, when an x-ray CT system with PCXDs with the features of the DXMCT-1 is developed, acquiring calibration data and updating the five detector parameters we used in the models at a reasonable frequency, e.g., every morning, does not seem impossible, especially if full- or semiautomatic software can be used.
The fast single photon counting detector technology used in the DXMCT-1 is being improved at DxRay in terms of decreased deadtime, an increased number of pulse height comparators per pixel for K-edge CT imaging, a more linear energy response up to higher energies with reduced per channel power consumption, and smaller pixels for increased output count rates per unit area. The estimated incident count rates at ∼30% count loss with the DXMCT-1 were reasonably large: 5.1 Mcps∕mm2 at 200 μA with 34% loss for the paralyzable detection model and 3.1 Mcps∕mm2 at 100 μA with 31% loss for the nonparalyzable detector model. As discussed in the Introduction, the incident input count rates to the detector attenuated by a bowtie filter and the patient may be in the range of 3–50 Mcps∕mm2.20 Therefore, achievable improvements in the detector speed with decreased deadtime and smaller pixels along with algorithmic compensation schemes to recover the incident input count rates and the incident spectrum may be sufficient to achieve these operational count rates of 3–50 Mcps∕mm2. The photon energy-pulse height curve is being improved to have a larger linear range with no saturation up to 150 keV. The energy resolution of the DXMCT-1 may be sufficient for dual energy applications where the separation between the low and high energy images is generally between 55 and 70 keV; however, improved energy resolution may be necessary for K-edge CT imaging.15 Additionally, more accurate pulse pileup compensation may require improved energy resolution at higher energies. The performance of this improved detector will be evaluated and characterized in future work.
The accuracy of the detector model to predict the recorded energy spectrum can be improved by considering additional modeling. Here we discuss three candidate ideas for the improvement. First, there are factors that might have influenced the recorded spectrum but were not considered in this study. They include charge sharing, escape peaks or K-shell photoelectron escape x-rays, and electronic noise. The effects of the first two factors are independent of the incident count rates; and thus, they may be included in the incident spectrum in this study because it was estimated from the recorded spectrum measured by each comparator. In addition, the contribution of the first two factors might be sufficiently small with the current detector design, thanks to a large pixel pitch of 1 mm. Integrating the models of those factors may be desirable and more critical when the incident spectrum is measured by another detector or the detector pixel pitch is smaller. Second, the probability Pr(E|m) was derived previously25 for the nonparalyzable detection model, which was used for a paralyzable detection model without modification in this study. Deriving more accurate probabilities from the paralyzable detection model may improve accuracy. Third, two count rate curves, estimated by the nonparalyzable and paralyzable detection models, respectively, lie on the opposite side of the measurements acquired by the PCXD (see Fig. 5). A weighted sum of the two models may result in a more accurate modeling of the count rate curve (and possibly the recorded spectrum with pulse pileup effects). We shall leave these for future work.
ACKNOWLEDGMENTS
The authors at DxRay and at Johns Hopkins University acknowledge support in part by NIH∕NIBIB Grant No. R44 EB008612. We sincerely thank Jochen Cammin, Ph.D., Somesh Srivastava, Ph.D., and Ronald J. Jaszczak, Ph.D., for their helpful discussions and suggestions. We are grateful to Zhihui Sun, M.Sc., and Hideaki Tashima, Ph.D., for their help with data acquisitions. Finally, we thank an anonymous reviewer who helped us to improve the quality of the paper.
APPENDIX: SHIFT-VARIANT ENERGY RESOLUTION
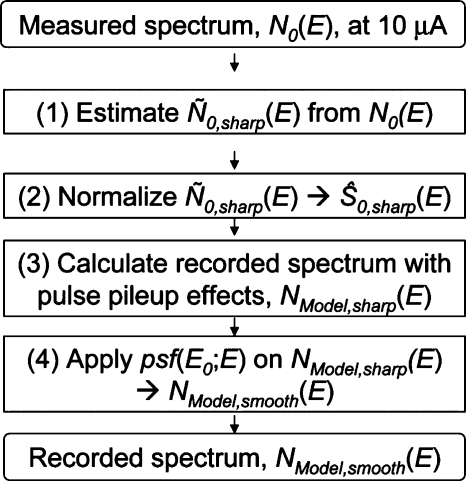
Here, we outline the method to take into account the shift-variant energy resolution (Fig. 11) and show that it had a negligible effect on the recorded spectrum with pileup effects, NModel(E), in this study.
Figure 11.
The flowchart of the method to incorporate the effect of the shift-variant energy resolution psf(E0;E) into the estimation of the recorded spectrum with pulse pileup effects NModel,smooth(E).
Methods
In a previous experiment,8 the FWHMs at 60 and 122 keV were found to be 7 and 35 keV, respectively. As an approximation, we assumed that the energy resolution at a given energy E, psf(E0;E), was a normal distribution with an FWHM defined by
| (A1) |
where EA=60 keV and EB=122 keV.
We then inverted the effect of the shift-variant energy resolution, psf(E0;E), from the measured spectrum at a tube current of 10 μA, N0(E), and obtained the true incident spectrum without the effect of the shift-variant finite energy resolution, . Specifically, was estimated minimizing the following cost function with non-negativity constraint,
| A2 |
where β is a parameter that balances the effect of the two terms and median[ ] is a one-dimensional 9-point median filter, which was necessary to suppress an increased variance (noise) of the spectrum caused by the shift-variant inversion process. Then, the probability density function of , , was obtained.
The expected recorded spectrum with pulse pileup effects, NModel,sharp(E), was then calculated using the models described in Sec. 2E. We then applied the shift-variant finite energy resolution, psf(E0;E), to NModel,sharp(E) by
| (A3) |
The recorded spectrum, NModel,smooth(E), incorporated the effects of pulse pileup and the shift-variant finite energy resolutions.
Evaluations
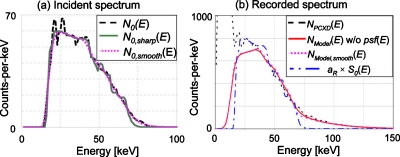
The second comparator of detector pixel #56 in ASIC #1, which had τ and k very close to the mean of all available comparators, was chosen as a typical comparator. First, we inverted and then applied the above described effect of the shift-variant energy resolution and compared the yield to the original spectrum. From the spectrum measured with 10 μA, N0(E), the true incident spectrum without the effect of the shift-variant finite energy resolution N0,sharp(E) was estimated. The iteration was terminated once the change in the cost function with one step in the iteration became smaller than 10−6. We then obtained N0,smooth(E) by applying the shift-variant energy resolution psf(E0;E) to N0,sharp(E). Figure 12a shows the three spectra, N0(E), N0,sharp(E), and N0,smooth(E). The two spectra, N0(E) and N0,smooth(E), agreed with each other very well, especially around both tails of the spectrum, suggesting that the proposed approach worked well. The shift-variant inversion process was slow. Using a nonoptimized MATLAB code, it took ∼500 iterations and 30 min to calculate N0,sharp(E) using a Windows machine with a 2.4 GHz CPU. Thus, applying this process to all of 1024 comparators would take ∼21 days.
Figure 12.
The effect of the shift-variant finite energy resolution. (a) The incident spectra of the typical comparator: N0(E), measured by DXMCT-1 (dashed curve); N0,sharp(E), processed by the procedure described in Appendix0 (solid curve); and N0,smooth(E), N0,sharp(E) filtered with the shift-variant energy resolution psf(E0;E) (dotted curve). (b) The recorded spectra of the typical comparator, at 200 μA with paralyzable detection model, estimated with the shift-variant finite energy resolution, NModel,smooth(E), and without, NModel(E). A linearly scaled incident spectrum aR×S0(E) is shown as a reference.
Second, we estimated the recorded spectrum distorted by the pulse pileup effects using the method described above (with the shift-variant finite energy resolution) and the method outlined in Sec. 2E (without the shift-variant finite energy resolution), with tube currents of 100, 200, 300, and 400 μA with both the nonparalyzable and paralyzable detection models. Figure 12b shows the result at 200 μA with the paralyzable detection model. It can be seen that the difference between the estimated spectrum with the finite energy resolution (NModel,smooth[E], magenta dotted curve) and the one without (NModel[E] without psf[E], red solid curve) is very small. Two spectra, each with or without the finite energy resolution estimated at different conditions, presented a similar agreement. Thus, considering the required computational effort (21 days), we decided not to include the finite, shift-variant energy resolution as a part of the model in this study.
References
- Mettler F. J., Wiest P., Locken J., and Kelsey C., “CT scanning: patterns of use and dose,” J. Radiol. Prot. 20, 353–359 (2000). 10.1088/0952-4746/20/4/301 [DOI] [PubMed] [Google Scholar]
- Swank R. K., “Absorption and noise in x-ray phosphors,” J. Appl. Phys. 44, 4199–4203 (1973). 10.1063/1.1662918 [DOI] [Google Scholar]
- Alvarez R. E. and Macovski A., “Energy-selective reconstructions in x-ray computerised tomography,” Phys. Med. Biol. 21, 733–744 (1976). 10.1088/0031-9155/21/5/002 [DOI] [PubMed] [Google Scholar]
- Yu L., Primak A. N., Liu X., and McCollough C. H., “Image quality optimization and evaluation of linearly mixed images in dual-source, dual-energy CT,” Med. Phys. 36, 1019–1024 (2009). 10.1118/1.3077921 [DOI] [PMC free article] [PubMed] [Google Scholar]
- Iwanczyk J. S., Nygard E., Meirav O., Arenson J., Barber W. C., Hartsough N. E., Malakhov N., and Wessel J. C., “Photon counting energy dispersive detector arrays for x-ray imaging,” IEEE Trans. Nucl. Sci. 56, 535–542 (2009). 10.1109/TNS.2009.2013709 [DOI] [PMC free article] [PubMed] [Google Scholar]
- Schlomka J. P., Roessl E., Dorscheid R., Dill S., Martens G., Istel T., Baumer C., Herrmann C., Steadman R., Zeitler G., Livne A., and Proksa R., “Experimental feasibility of multi-energy photon-counting K-edge imaging in pre-clinical computed tomography,” Phys. Med. Biol. 53, 4031–4047 (2008). 10.1088/0031-9155/53/15/002 [DOI] [PubMed] [Google Scholar]
- Shikhaliev P. M., “Energy-resolved computed tomography: first experimental results,” Phys. Med. Biol. 53, 5595–5613 (2008). 10.1088/0031-9155/53/20/002 [DOI] [PubMed] [Google Scholar]
- Barber W. C., Nygard E., Iwanczyk J. S., Zhang M., Frey E. C., Tsui B. M. W., Wessel J. C., Malakhov N., Wawrzyniak G., Hartsough N. E., Gandhi T., and Taguchi K., “Characterization of a novel photon counting detector for clinical CT: count rate, energy resolution, and noise performance,” SPIE Medical Imaging 2009: Physics of Medical Imaging (SPIE, Lake Buena Vista, FL, 2009), Vol. 7258, pp. 725824.
- Feuerlein S., Roessl E., Proksa R., Martens G., Klass O., Jeltsch M., Rasche V., Brambs H. -J., Hoffmann M. H. K., and Schlomka J. -P., “Multienergy photon-counting K-edge imaging: Potential for improved luminal depiction in vascular imaging,” Radiology 249, 1010–1016 (2008). 10.1148/radiol.2492080560 [DOI] [PubMed] [Google Scholar]
- Tomita Y., Shirayanagi Y., Matsui S., Aoki T., and Hatanaka Y., “X-ray color scanner with multiple energy discrimination capability,” Medical Imaging 2005: Physics of Medical Imaging (SPIE, San Diego, CA, 2005), Vol. 5922, p. 59220A.
- Tomita Y., Shirayanagi Y., Matsui S., Misawa M., Takahashi H., Aoki T., and Hatanaka Y., “X-ray color scanner with multiple energy differentiate capability,” IEEE Nuclear Science Symposium and Medical Imaging Conference (IEEE, Roma, 2004), Vol. 0–7803–8701–5∕04.
- Butler A. P. H., Anderson N. G., Tipples R., Cook N., Watts R., Meyer J., Bell A. J., Melzer T. R., and Butler P. H., “Bio-medical x-ray imaging with spectroscopic pixel detectors,” Nucl. Instrum. Methods Phys. Res. A 591, 141–146 (2008). 10.1016/j.nima.2008.03.039 [DOI] [Google Scholar]
- Ballabriga R., Campbell M., Heijne E. H. M., Llopart X., and Tlustos L., “The Medipix3 prototype, a pixel readout chip working in single photon counting mode with improved spectrometric performance,” IEEE Trans. Nucl. Sci. 54, 1824–1829 (2007). 10.1109/TNS.2007.906163 [DOI] [Google Scholar]
- Firsching M., Butler A. P., Scott N., Anderson N. G., Michel T., and Anton G., “Contrast agent recognition in small animal CT using the Medipix2 detector,” Nucl. Instrum. Methods Phys. Res. A 607, 179–182 (2009). 10.1016/j.nima.2009.03.141 [DOI] [Google Scholar]
- Roessl E. and Proksa R., “K-edge imaging in x-ray computed tomography using multi-bin photon counting detectors,” Phys. Med. Biol. 52, 4679–4696 (2007). 10.1088/0031-9155/52/15/020 [DOI] [PubMed] [Google Scholar]
- Wielopolski L. and Gardner R. P., “Prediction of the pulse-height spectral distribution caused by the peak pile-up effect,” Nucl. Instrum. Methods Phys. Res. 133, 303–309 (1976). 10.1016/0029-554X(76)90623-6 [DOI] [Google Scholar]
- Knoll G. F., Radiation Detection and Measurement, 3rd ed. (Wiley, New York, 2000). [Google Scholar]
- Johns P. C. and Yaffe M. J., “Correction of pulse-height spectra for peak pileup effects using periodic and random pulse generators,” Nucl. Instrum. Methods Phys. Res. A 255, 559–581 (1987). 10.1016/0168-9002(87)91227-7 [DOI] [Google Scholar]
- Barradas N. P. and Reis M. A., “Accurate calculation of pileup effects in PIXE spectra from first principles,” X-Ray Spectrom. 35, 232–237 (2006). 10.1002/xrs.903 [DOI] [Google Scholar]
- Taguchi K., Srivastava S., Kudo H., and Barber W. C., “Enabling photon counting clinical x-ray CT,” IEEE Nuclear Science Symposium and Medical Imaging Conference (IEEE, Orlando, FL, 2009), pp. 3581–3585.
- Frey E. C., Wang X., Du Y., Taguchi K., Xu J., and Tsui B. M. W., “Investigation of the use of photon counting detectors with energy discrimination capability for material decomposition in micro-computed tomography,” SPIE Medical Imaging 2007: Physics of Medical Imaging (SPIE, San Diego, CA, 2007), Vol. 6510, pp. 65100A–65101–65111.
- Tenney F. H., “Idealized pulse pileup effects on energy spectra,” Nucl. Instrum. Methods Phys. Res. A 219, 165–172 (1984). 10.1016/0167-5087(84)90150-9 [DOI] [Google Scholar]
- Günzler R., Schuele V., Seeliger G., Weiser M., Boeringer K., Kalbitzer S., and Kemmer J., “A multisegment annular Si-detector system for RBS analysis,” Nucl. Instrum. Methods Phys. Res. B 35, 522–529 (1988). 10.1016/0168-583X(88)90324-2 [DOI] [Google Scholar]
- Gardner R. P. and Wielopolski L., “A generalized method for correcting pulse-height spectra for the peak pileup effect due to double sum pulses,” Nucl. Instrum. Methods Phys. Res. A 140, 289–296 (1977). 10.1016/0029-554X(77)90297-X [DOI] [Google Scholar]
- Taguchi K., Frey E. C., Wang X., Iwanczyk J. S., and Barber W. C., “An analytical model of the effects of pulse pileup on the energy spectrum recorded by energy resolved photon counting x-ray detectors,” Med. Phys. 37, 3957–3969 (2010). 10.1118/1.3429056 [DOI] [PMC free article] [PubMed] [Google Scholar]


