

Abstract
A common problem in detecting metal ions with fluorescent sensors is the emission-suppressing effects of fluorescence-quenching metal ions. This quenching tendency makes it difficult to design sensors with turn-on signal, and differentiate between several metal ions that may yield a strong quenching response. To address these challenges, we investigate a new sensor design strategy, incorporating fluorophores and metal ligands as DNA base replacements in DNA-like oligomers, for generating a broader range of responses for quenching metal ions. The modular molecular design enabled rapid synthesis and discovery of sensors from libraries on PEG-polystyrene beads. Using this approach, water-soluble sensors 1-5 were identified as strong responders to a set of eight typically quenching metal ions (Co2+, Ni2+, Cu2+, Hg2+, Pb2+, Ag+, Cr3+, and Fe3+). They were synthesized and characterized for sensing responses in solution. Cross-screening with the full set of metal ions showed that they have a wide variety of responses, including emission enhancements and red- and blue-shifts. The diversity of sensor responses allows as few as two sensors (1 and 2) to be used together to successfully differentiate these eight metals. As a test, a set of unknown metal ion solutions in blind studies were also successfully identified based on the response pattern of the sensors. The modular nature of the sensor design strategy suggests a broadly applicable approach to finding sensors for differentiating many different cations by pattern-based recognition, simply by varying the sequence and composition of ligands and fluorophores on a DNA synthesizer.
Keywords: DNA, oligonucleotide, fluorescence, quenching, metal, pattern, array, sensor
Introduction
The detection and identification of heavy metals in aqueous solution is broadly important to environmental monitoring and biomedical science. Many methods have been used to detect metal ions including fluorescence spectroscopy, UV-vis absorption, atomic absorption, ICP emission spectroscopy, and voltammetry.1-18 Among these methods, fluorescence emission spectroscopy is an attractive approach because of its high sensitivity, facile operation, and the widespread availability of equipment for analysis. As a result, fluorescent sensor molecules have been developed for many metals, in some cases yielding highly selective signals at low concentrations.10-18
One of the problems faced in detecting metal ions with fluorescent sensors is the emission-suppressing effects of some metal ions, which results in strong quenching of fluorescence. Inherently quenching metal ions such as Hg2+, Cu2+, Co2+, Ni2+, and Fe3+ can interfere with the fluorescent signal of the sensors in detecting other metals.13,19-24,31,42,53 Moreover, this quenching tendency makes it difficult to design a sensor that yields a positive (turn-on) signal. Indeed, the inherent ability of these metal ions to quench fluorescence has been exploited in some cases to develop turn-off sensors.25-29 However, in many applications it is not ideal to monitor the disappearance of a signal because fluorescence quenching can be caused by a number of factors, and therefore can be nonspecific. For higher sensitivity, it is usually desirable to have sensors that yield an enhancement of signal upon binding metal ions.30,31
A second problem with the quenching tendency of such metals is that it is difficult to differentiate between metals that all typically yield a strong quenching response. To address problems such as these, a number of strategies have been employed to develop turn-on fluorescent sensors for quenching metals, such as separating the ligand moiety from the chromophore via rigid linker32,33; the use of PET,31,34-43 FRET44-48 or excimer formation49,50; or exploiting the specific reactivity of a given metal ion51-55. Even with these advances, it is difficult with one approach to differentiate between a broad set of heavy transition metals.
An alternative strategy that has been used to differentiate heavy metal ions is that of sensor arrays. Sensor arrays commonly use a set of fluorescent indicators/sensors to discriminate a number of metal ions, and the pattern of responses as a whole is diagnostic of a given metal. Recent reports have used fluorescent polymers or common commercial dyes, with or without competing ligands, to distinguish between different transition metals.56-61 In such cases the fluorescence changes have been limited to quenching or enhancement, without changing wavelengths of emission. This limited response can add a requirement for more complex sensing schemes or signal processing that involves time-dependent parameters (such as dual lifetime referencing, time before color change, or time for color change halfway point).56-58 A small diversity of responses can also lead to the need for a larger number of sensors to distinguish even a relatively small set of analytes. Moreover, some of these prior sensors exhibit limited water solubility, requiring the use of organic or mixed solvents.
To address these challenges, we have adopted a new molecular approach to fluorescence sensors that incorporates fluorophores and metal ligands onto DNA-like oligomers (oligodeoxyfluorosides, or ODFs).62-68 This design allows the binding and reporting moieties to interact intimately by bringing them into direct contact by π-π stacking, analogous to the stacking of DNA bases. Our hypothesis is that the signal transduction of this system should not be limited to a single mechanism, such as the commonly used PET, but rather can involve many mechanisms, offering a diversity of possible responses to even strongly quenching metals. Here we have examined the feasibility of this design strategy by generating a set of water-soluble fluorescent sensors that can respond distinctly to different heavy metal ions in solution using a single excitation wavelength. We describe the differentiation of a set of eight typically quenching metal ions (Co2+, Ni2+, Cu2+, Hg2+, Pb2+, Ag+, Cr3+, and Fe3+) based on the diverse spectral responses of a few sensors developed by this approach as a proof of principle. We find that the sensors offer a wide variety of responses beyond simple quenching with these metals, including enhancements and red- and blue-shifts, and we identify a minimal set of two sensors that can be used as a group to differentiate the eight metal ions in solution.
Results and Discussion
Sensor Design
The current sensor design (Fig. 1) is based on a DNA-like structure of tetramer length, in which DNA bases are replaced by fluorophores and aromatic ligands. This oligodeoxyfluoroside (ODF) design is based on an expectation of strong inter-fluorophore electronic interactions encouraged by the DNA backbone.62-65 Fluorescent ligand deoxyribosides (L1, L2, and L3) were incorporated to add metal binding capacity and interact with fluorescent hydrocarbon fluorophores (E, H, and D) on the ODF. Upon binding, a metal ion is expected to alter the inter-fluorophore interactions within an ODF, significantly changing its photophysical properties. The ligands (L1, L2, and L3) were intentionally chosen to be non-selective for any specific metal in order to allow the ODFs to bind multiple metal ions.67,69 It was anticipated that any selective responses of a sensor for a particular metal would likely result not from the specificity of the ligands, but rather from the selective electronic interactions of ligands and neighboring dyes upon metal complexation, resulting in distinct signals for the different metal ions.
Figure 1.

Structures of an ODF sensor (oligomer 1, sequence H-L2-D-H, is shown as an example) and structures of the deoxyriboside monomers employed as components of the sensors. R = two tetrahydrofuran abasic spacer monomers.
An advantage of this design strategy is that the sensors generated are not limited to a single sensing mechanism (e.g., PET). The design simply enables the fluorophores and ligands to interact on the DNA backbone, which can potentially generate sensors with different sensing mechanisms, offering a diversity of possible responses to various metal ions. Moreover, the phosphodiester scaffold allows for water solubility, and the modular nature of the ODF-based design enables rapid synthesis via automated synthesizer, and facilitates discovery of sensors from libraries.
Library Preparation and Screening
Because it is difficult to predict which ODF sequences would give the optimum signal for a wide variety of metal ions, a combinatorial library was prepared by the split-and-pool method. The sensor molecules 1-6 studied here (Table 1) were identified from a screen of a library of tetrameric fluorophores and ligands on modified PEG-polystyrene beads synthesized on a DNA synthesizer (see Supporting Information). The library was prepared and screened by previously described methods,62-65 and contained six monomers (L1, L2, L3, E, H, and D) and a spacer (S). Two monomers (L3 and S, Fig. 1) were commercially available; fluorescent ligands L1 and L2, and fluorophore E, H, and D were synthesized as previously reported.62-64,69,70
Table 1.
Oligodeoxyfluoroside Sequencesa
| Oligomer | Sequence |
|---|---|
| 1 | 5′–S–S–H–L2–D–H–S–S–3′ |
| 2 | 5′–S–S–E–L1–E–S–S—3′ |
| 3 | 5′–S–S–L1–L2–H–D–S–S–3′ |
| 4 | 5′–S–S–L3–L2–H–L1–S–S–3′ |
| 5 | 5′–S–S–L1–H–H–L3–S–S–3′ |
| 6 | 5′–S–S–L1–S–L2–D–S–S–3′ |
Note that all sequences contain a phosphate group at the 3′ terminus.
The beads were screened by imaging in buffer alone and then in the presence of 100 μM of each metal (Co2+, Ni2+, Cu2+, Hg2+, Pb2+, Ag+, Cr3+, and Fe3+). Beads exhibiting the strongest fluorescence change in the presence of each metal were selected and resynthesized for evaluation (Fig. 2). This led to identification of oligomers 1-6, which exhibited a variety of strong responses to this set of metal ions (see below). Although the sensing molecules were discovered as tetramers, additional abasic spacer nucleotide monomers (S), were incorporated on both ends of the oligomer in order to increase aqueous solubility, prevent aggregation, and facilitate purification for the solution studies. Unlike the nucleoside monomers (L1, L2, L3, E, H, and D), which are not appreciably soluble in water alone, oligomers 1-6 are functional in wholly aqueous media (see below).
Figure 2.
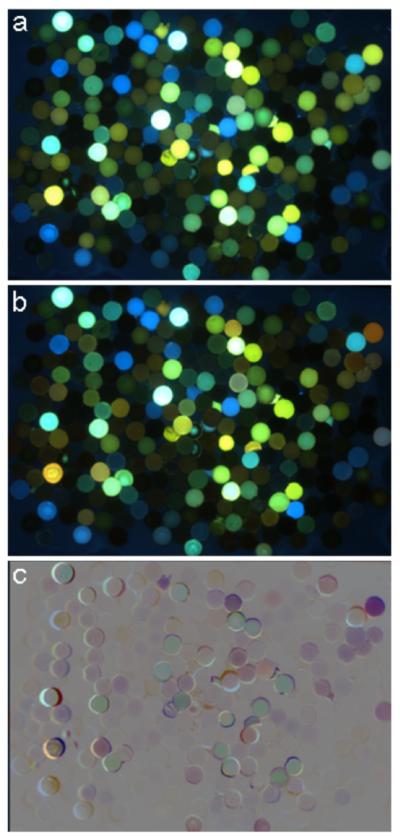
Examples of images from library screening for fluorescence responses. (a) Library in buffer alone and (b) in the presence of 100 μM AgNO3. To facilitate finding beads exhibiting fluorescence changes, image (a) was inverted and combined with (b) (50% blending) to produce difference image (c). In this difference image, 50% gray represents no change, while beads that are darker or lighter than gray show quenching and enhancement, respectively. Colors represent a combination of the original colors and the spectral shifts. Additional examples are given in the SI file.
Metal Ion Discrimination
Oligomers 1-6 were characterized by MALDI mass spectrometry (Table S1) and their fluorescence spectra (Fig. S1). In the absence of metal ions, the emission spectra of the six compounds appeared quite similar, with broad emission from ~420-670 nm, peaking at 530-570 nm. To evaluate metal ion responses, fluorescence spectra were measured in 10 mM sym-collidine • HNO3 pH 7.3 buffer with 10 μM metal (as the nitrate salt). All six sensors were cross-tested against all eight metal ions. Spectra before and after addition are shown in Fig. 3, and the difference spectra profiles for each metal are plotted in Fig. S3.
Figure 3.

Fluorescence response profiles of oligomers 1-6 (2 μM) to the quenching metal ions (10 μM) in 10 mM sym-collidine • HNO3 pH ~7.3 buffer (λex. = 350 nm). (a) – (f) correspond to oligomers 1-6 respectively.
To aid in visualization of the 48 spectral changes arising from the combinations of sensors and metals, we also prepared an RGB grid plot of all the sensors’ responses to the eight metal ions (Fig. 4). The difference spectra data was condensed by selecting three wavelengths representing red, green, and blue and plotting them on a 256-unit RGB scale. The fluorescence changes were normalized into a 0-255 scale, with 127 set as the zero value. On this scale, fluorescence enhancement at the chosen RGB wavelength is represented by values greater than 127, with the maximum at 255; and fluorescence quenching is represented by values less than 127, with the strongest quenching value at 0. In the plot (Fig. 4), 50% gray represents no change either in emission intensity or color, while changes in intensity and wavelength are represented by light/dark values and colors, respectively.
Figure 4.
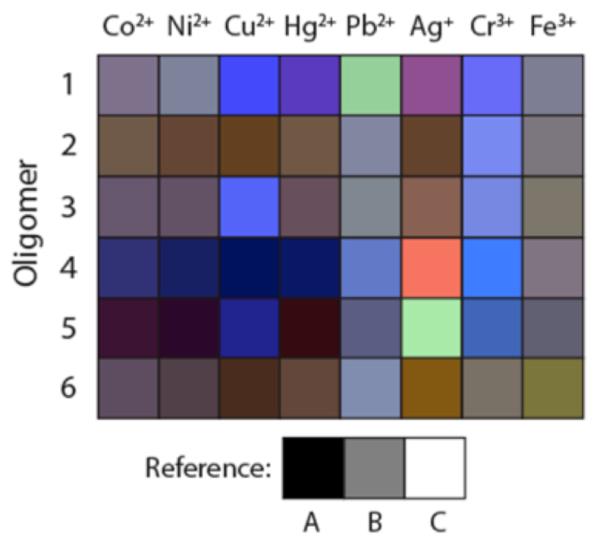
/B> RGB color representation of the changes in fluorescence response of sensors 1-6 to each of the eight metal ions. The three wavelengths selected to represent RGB are 650, 550, and 450 nm respectively. The fluorescence change values for each of the wavelengths were transformed into a 0-255 scale with 127 set as the value for no change. Thus, a metal inducing no fluorescence change is represented by a gray color (reference B). References A, B, and C represent RGB values of 0, 0, 0; 127, 127, 127; and 255, 255, 255.
Comparisons of metal responses
Examination of the fluorescence spectra of the oligomeric sensors in the presence of various quenching metal ions revealed a variety of responses in the sensors (Fig. 3). None of the metals yielded simple quenching with every sensor; aside from the characteristic fluorescence quenching, other responses induced by the metal ions included fluorescence enhancements, blue- and red-shifts, and spectral broadening due to the appearance of a new emission peak. For example, oligomer 3 responded strongly to all of the metals in the set except for Fe3+. Cr3+ broadened the spectrum of 3 by the appearance of a new peak at about 450 nm. Cu2+ induced a blue-shift of ca. 100 nm in 3, while Ag+ induced a red-shift of ~50 nm. Co2+, Ni2+, and Hg2+ quenched the fluorescence of 3. Every sensor showed a light-up response with at least one of the metals.
Among the six sensors, ODF 1 displayed the most varied responses to the set of quenching metal ions. This is readily seen in Fig. 4 (top row) and also in Fig. 3a. Pb2+ induced a very strong fluorescence enhancement while Cu2+ and Hg2+ generated blue-shifts of ca. 100 nm. Ag+ caused a red-shift of ~50 nm, and Cr3+ broadened the spectrum by the appearance of a new peak at ~440 nm. Such a diversity of responses establishes that different metals can have markedly different electronic interactions with the ground and/or excited states of a single ODF sensor. Since the oligomer contains only one obvious ligand (L2), this suggests that different electronic properties induced in the metal-ligand complex interact differently with the neighboring chromophores to produce distinct outcomes. However, it should be stressed that the mode of binding is not yet clear, and needs more study.
Comparisons of sensor sequences
Comparisons of the fluorescence spectra (Fig. 3) of one oligomer to another revealed that their responses were quite distinct from each other. For example, with oligomers 1 and 2, Co2+, Ni2+, Ag+, Pb2+, and Cu2+ induced very different responses from the two oligomers. Co2+ and Ni2+ induced little to no responses from 1. In 2, Co2+ and Ni2+ induced fluorescence quenching, and Pb2+ broadened the spectrum to the shorter wavelengths instead of a very strong enhancement as in 1. Cu2+ and Ag+ caused strong quenching in 2; however, in 1, Cu2+ resulted in a strong blue-shift ca. 100 nm, and Ag+ induced a red-shift ca. 50nm. The only metal that did not induce a response in any of the oligomers is Fe3+, which may be due to the lack of oxygen-bearing ligands capable of binding the more oxophilic metal. Although Fe3+ did not induce a response in any of the oligomers, Fe3+ can still be distinguished from the other metal ions in this analyte set by using sensors in which Fe3+ is the only metal that did not respond (such as 2, 3 and 4; Fig. 3).
Closer examination of sequences and responses of the sensors is revealing, particularly in several cases where the components varied by only one monomer. For example, sequences 1 and 3 vary by one monomer (ligand L1 in 3 vs an extra H monomer in 1). Comparisons of responses (rows 1 and 3 in Fig. 4) shows that the main differences are strong light-up responses to Hg2+, Pb2+ and Ag+ in 1 that are absent in 3. This suggests that the extra terphenyl (H) monomer in 1 is central to the mechanism of emission enhancement. Intriguingly, the wavelengths of enhancement lie far to the red of the emission of the terphenyl monomer alone (which emits at 345 nm64). A second comparison can be made between sensors 3 and 6; 3 contains an H monomer while 6 contains a nonfluorescent S spacer monomer instead. Although the overall response patterns of the two are similar (rows 3 and 6 in Fig. 4), large light-up responses with Cu2+ and Cr3+ are seen for 3, which is absent in 6. This establishes the H monomer in 3 as being important in this light-up response as well. Presumably the terphenyl induces this type of response indirectly, perhaps by its interaction with the neighboring ligand fluorophores, which emit at longer wavelengths.
Another interesting comparison can be made between sensors 3, 4 and 5. A strong fluorescence enhancement response with Ag+ is seen for oligomers 4 and 5, which are the only sensors in the set that contain an L3 monomer (Fig. 3). Oligomer 3, which only varies by one monomer from 4 (D monomer in 3 vs ligand L3 monomer in 4), does not display this enhancement. This suggests that ligand L3 is important in the binding and/or light-up response for Ag+.67
Although the site of metal ion binding is not yet known for these sensors, the sequences yield some clues in this regard. The combinatorial library was not biased to include at least one ligand monomer for each sequence; however, the selected sequences (1-6) all contained at least one ligand monomer. This suggests that the ligands are important or required for the ODFs to bind the metal ions. Oligomers 1 and 2 have only one clear ligand each (L1 and L2, respectively), which suggests these as a likely site of binding. Oligomers 3, 5, and 6 each have two ligands, while sensor 4 has all three different ligands; thus one or more ligands may be involved in metal recognition. We also note that the binding stoichiometry may involve one sensor per metal or perhaps higher ratios; future work will address the sites and modes of binding in detail. To obtain a preliminary measure of the binding ability (and sensitivity) of sensors 1-6, selected oligomers and metal ions were titrated (Fig. S5). The apparent dissociation constants (Kd) ranged from 0.64 to 7.66 μM, and the responsive ranges generally cover concentrations varying from ca. 100 nM and above.
Pattern responses
Because the response profiles of the oligomers are distinct from each other, it is possible to differentiate the set of quenching metal ions using a combination of the responses from a small set of sensors (see below for details). 1, 2, 3 and 4 are particularly useful in this regard because the majority of the metal ions in the set induce a response in these oligomers, the responses are different for the different metal ions, and the response profiles of the sensors are different from each other. In contrast, 6 is not as useful for differentiation because its response diversity is limited (primarily to degrees of quenching), making it difficult to distinguish the metals from one another.
The fluorescence response profiles of the oligomers (Fig. 3) suggest that two (1 and 2) or three (1-3) sensors can be used as a set to differentiate all eight quenching metal ions. Oligomer 1 can be used to distinguish Pb2+, Cu2+, Cr3+, Ag+, and Hg2+ from each other and the other metal ions. Notably, oligomer 1 is the only sensor with a blue-shift response to Hg2+; in the remaining sensors (2-5), Hg2+ induces fluorescence quenching. This allows the differentiation of Hg2+ from Co2+ and Ni2+, which is otherwise difficult because of the common quenching response. The most difficult metal ions to differentiate with the oligomer set (Table 1) were Co2+ and Ni2+; however, 2 can be used to distinguish the two metals based on stronger the degree of quenching by Ni2+. In addition, oligomer 3 can be used to distinguish Fe3+ from the other metals, as well as increase the differentiation confidence of the other metal ions.
Chemometric analysis
Principal component analysis (PCA) and agglomerative hierarchical clustering (AHC) were performed on the data to quantitatively evaluate our observations and better understand the relationships in the sensor responses.57,58,61,71,72 To carry out these quantitative analyses, we input the delta(intensity) values from the 48 difference spectra taken at 10 nm increments into the analytical software (XLSTAT, see SI). Chemometric analysis was first performed on oligomers 1-6 based on their responses to all the metal ions in order to examine how different the sensors’ overall responses are from each other. PCA plots are shown in Figs. 5 and S6, illustrating the scatter in the responses of the oligomers to the metal ions. The responses from oligomers 1, 4 and 5 to the metal ions show very good scattering, indicating that the response of each of these oligomers to the set of quenching metal ions is very different from the other sensors. Oligomers 2, 3 and 6 were clustered more closely together (with 2 and 6 the closest). Although the overall response profiles of oligomers 2, 3 and 6 showed some similarity (Figs. 3b, c and f respectively), several prominent differences can be observed: the main differences in sensor 3 from 2 and 6 are the peak at ca. 440 nm (from Cu2+ and/or Cr3+) and the red-shift induced by Ag+; and the major difference between oligomer 2 and 6 is the light-up peak (ca. 440 nm) from Cr3+ that is absent in 6. PCA did not capture these differences in the first three principal component axes (F1, F2 and F3); however, the differences were clear in the fourth principal component, F4 (Fig. S6).
Figure 5.
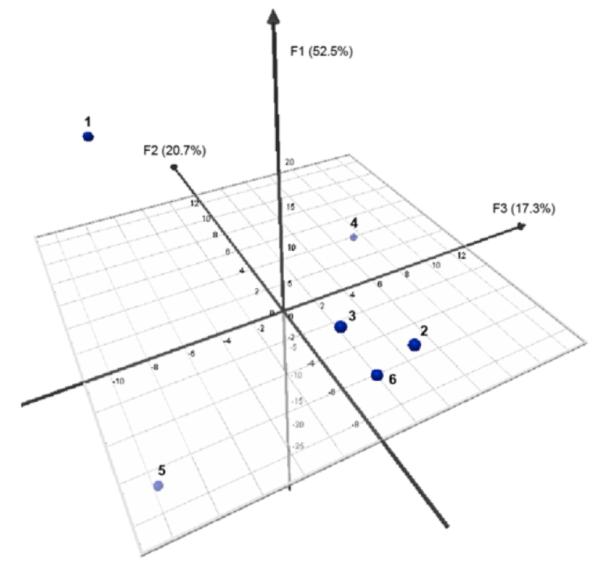
PCA plot of oligomers 1-6 based on their responses (difference spectra profile data) to all the metal ions.
AHC analysis was also performed on oligomers 1-6 based on their responses to all the metal ions. The AHC analysis allowed us to generate a dendrogram of families of sensors according to their response profile to the eight quenching metal ions (Fig. 6). Four most dissimilar classes of sensor responses were found; 1, 4 and 5 were categorized into their own class, while 2, 3 and 6 were grouped together into one class. From the set of six sensors, the response profile of oligomer 5 is the most different from the other sensors, followed by 1 and then 4. The sensors that exhibited a more similar response profile were again oligomers 2, 3 and 6, with 3 being more different from 2 and 6, which corroborates the results above.
Figure 6.
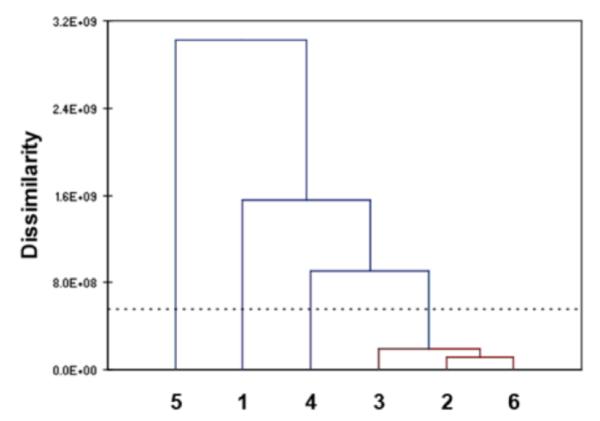
AHC dendrogram of oligomers 1-6 based on their responses (difference spectra profile data) to all the metal ions. The sensors are categorized according to their overall response dissimilarity: grouped together based on the level of dissimilarity. Sensors exhibiting mostly similar response pattern (low level of dissimilarity, red colored lines) to all eight metal cations can be grouped into one class. The vertical lines correspond to the different classes, and the horizontal lines to the dissimilarity values between the classes.
A second chemometric analysis was performed on the quenching metal ions based on the difference spectra profile data of oligomers 1-5 in order to investigate the ability of sensors to differentiate the metal ions based on response patterns. Because the response diversity of oligomer 6 is limited primarily to degrees of quenching (which makes 6 not as useful as sensors 1-5), sensor 6 was dropped from further analyses. The PCA results are shown in Figs. 7 and S7, illustrating the scatter in the responses induced by the metal ions. Overall, the findings correspond well with the qualitative observations. The responses from oligomers 1-5 induced by Cu2+, Pb2+, Ag+, Cr3+, and Fe3+ showed very good scattering. Therefore, allowing these five metal ions to be easily distinguished from the remaining three metal ions, Hg2+, Co2+, and Ni2+, which were clustered more closely together. However, oligomer 1 was able to discriminate Hg2+ (by a blue-shift) from Co2+ and Ni2+ (which caused little to no response). In the remaining sensors 2-5, Hg2+, Co2+, and Ni2+ all quenched the fluorescence. Fortunately, the degrees of quenching in 2 and 4 were different for these metal ions, which could be used to distinguish Co2+ from AHC analysis was also performed on the metal ions based on the difference spectra data of sensors 1-5. This allowed us to generate a dendrogram of families of metal ions according to the response pattern they induce in oligomers 1-5 (Fig. 8). The AHC results also corroborated the qualitative observations, discussed above. From the set of eight metal ions, Ag+ induced the most different pattern of responses from the sensors, followed by Pb2+ and then Cr3+ and Fe3+. The metals (Cu2+, Hg2+, Co2+, and Ni2+) that show the general tendency to quench oligomers 1-5 were grouped together into one class. In this class, Cu2+ is the most different from the other metal ions in its responses, followed by Hg2+. The most similar (i.e., difficult to differentiate) metals were again Co2+ and Ni2+, as previously observed (see first and second vertical rows in Fig. 4).
Figure 7.
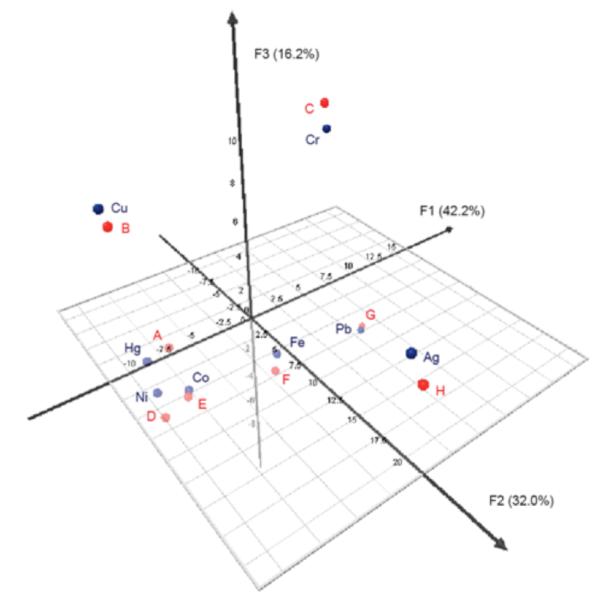
PCA plot of the quenching metal ions based on the difference spectra profile data of sensors 1-5. Data for the known and unknown metal ion solutions (discussed below) were included in the analysis to facilitate direct comparison. Blue color = known metal solutions and red color = unknown metal solutions A-H.
Figure 8.
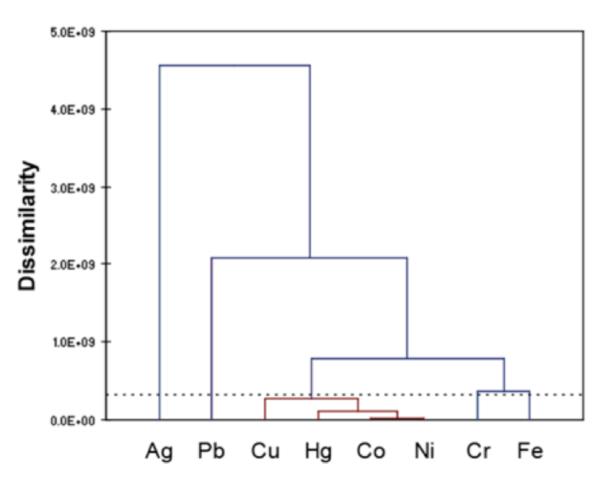
AHC dendrogram of the quenching metal ions based on the difference spectra profiles of sensors 1-5. The metal cations are categorized according to the dissimilarity of the overall responses they induce on sensors 1-5. They are grouped together based on the level of dissimilarity; the metal ions inducing mostly similar response pattern (low level of dissimilarity, red colored lines) from all five sensors can be grouped into one class. The vertical lines correspond to the different classes, and the horizontal lines to the dissimilarity values between the classes.
Identification of unknowns
As a proof of principle, we performed a blind study to test whether a set of these sensors could be used to distinguish these metals without prior knowledge of their identity. Thus we measured the sensor responses with eight unknown samples containing the fluorescent quenching metal ion set (Co2+, Ni2+, Cu2+, Hg2+, Pb2+, Ag+, Cr3+, and Fe3+). Although only two (1 and 2; see below) or three sensors (1-3) can be used to distinguish the eight metal ions, oligomers 4 and 5 were included to enhance the identification confidence. The difference spectra profiles for each sensor with the unknown solutions were then plotted; these are shown in Fig. S4. The difference spectra profiles gave nearly identical, overlapping spectral responses with the previously measured known metal solutions. Thus all eight unknown metal ions were correctly identified by simply comparing the difference spectra profiles of the unknown solutions (Fig. S4) to the known solutions (Fig. S3).
Chemometric tools were also used to simplify the identification of the unknown metal ion solutions. In the PCA scatter plot (Fig. 7 and S7), the difference spectra profiles of the unknown solutions were also included. PCA was useful in condensing the dimensionality of the data set, thus facilitating the identification of the unknown solutions. The results show a very good clustering of the unknowns with the known samples, where each unknown paired closely with the correct known sample identity. Moreover, the close pairing also indicates good reproducibility of the results and methods.
In addition to the AHC analysis on the known metal solution data alone (Fig. 8), AHC analysis including both known and unknown solution data was also performed (Fig. S8b). Similar to the PCA, the AHC results show pairing of each unknown samples with a known metal sample; and again this pairing correspond to the correct identity of the unknown metal ion solutions. The low level of dissimilarity of each of the unknown-known pair indicates that each pair is highly similar.
In order to test the possibility of using as few as two sensors to differentiate the metal ion set, PCA analysis was performed with oligomers 1 and 2. The PCA result from using only these two sensors (Fig. 9) reveals very good scattering among the metal ions, and close pairing of each unknown sample response with that of a known metal sample. The analysis results, in correct assignment of all the unknowns, indicate that the eight metal ions can be differentiated by the combined responses of the two sensors 1 and 2.
Figure 9.
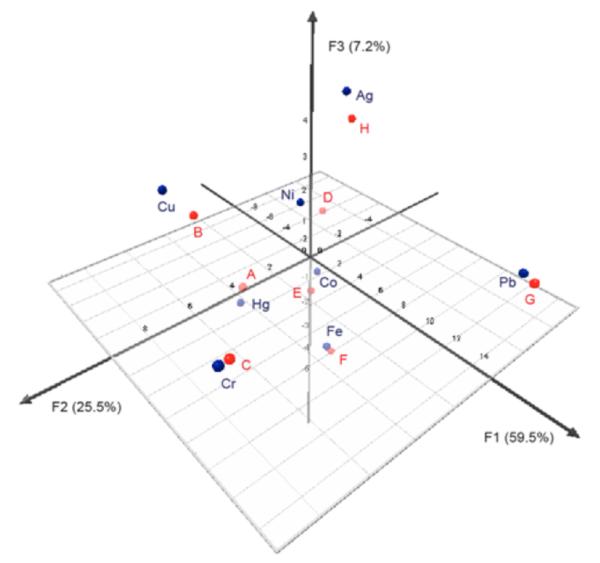
PCA plot of the quenching metal ions based on sensors 1 and 2. Data for the known and unknown metal ion solutions were included in the analysis to facilitate direct comparison. Blue color = known metal solutions and red color = unknown metal solutions A-H.
Design features
An examination of the present sensor design points out some notable differences from other recently reported metal sensor arrays.56-61 Previous work by Anzenbacher employed a water insoluble 8-hydroxyquinoline receptor attached to various conjugated chromophores in the differentiation of transition metals by quenching or enhancement responses.61 Anslyn has reported the use of a squaraine dye with varied thiols in degassed DMSO to differentiate five heavy metals by increases and decreases in fluorescence intensity.57 Dordick has described the use of fifteen polyphenol polymers to distinguish four metals by varied quenching and enhancement responses.59 Wolfbeis employed commercial dyes and a fluorescence lifetime-based approach to distinguishing five metals.56
Compared to previous approaches, the current ODF sensor design offers benefits of water solubility, a higher diversity of responses, and versatility of use. The charged DNA phosphodiester backbone enables even hydrophobic components (fluorophores, ligands, linkers, etc.) to be utilized as building blocks for the sensors; and the water solubility of the sensors avoids problems associated with the incompatibility of hydrophobic sensors and hydrophilic cations. Second, we have observed a considerably greater variation in responses, with not only strong enhancements and quenching, but also wavelength shifts of as much as 110 nm. This diversity of response allows the use of fewer sensors in distinguishing a greater number of metals. In contrast, some previous responses yielded only simple quenching for the commonly quenching metals, and relied instead on varied degrees of quenching or varied lifetimes. Finally, the current approach offers considerably versatility. For example, all the ODFs are excited at a single wavelength, thus requiring only one spectral measurement with a single filter set. In addition, although the sensing results here were obtained in solution (which makes more thorough characterization possible), the ODF design could also be adapted readily for application on solid supports, as the original screening (which showed similar spectral changes) was carried out on PEG-polystyrene beads (Figs. 2 and S2). ODFs on PEG-polystyrene beads have already been shown to be functional sensors for small molecule vapors.68
Another noteworthy aspect of the present experimental design strategy is the combinatorial library method for sensor discovery, which considerably enhances efficiency. Utilizing the DNA backbone allows the use of an automated synthesizer, resulting in rapid library assembly as well as rapid re-synthesis. The iterative synthesis makes it possible to generate a large set of potential sensors from a small set of precursor monomers (4,096 different tetramers in the present case). By simultaneously screening through a large sensor set, discovery of strong and varied responders is rapid, and weak responders are quickly eliminated as candidates. The varied combinations of binding and transducing elements in the library are arranged in many possible sequences, thus allowing for a large diversity of possible mechanisms of metal binding and signal transduction.
Conclusions
In summary, we have demonstrated a new molecular design for differentiating a set of fluorescence-quenching metal ions (Co2+, Ni2+, Cu2+, Hg2+, Pb2+, Ag+, Cr3+, and Fe3+) based on the response diversity of a small set of sensors composed of polyfluorophores on a DNA backbone. The design allows the ligands and fluorophores to interact with each other on a DNA backbone, enabling the overall properties of the oligomers to be different from those of the monomers. The advantages that the ODF-based design offers include highly diverse responses, water solubility, and a single excitation wavelength for the whole set of sensors. In addition, the modular nature of the design enables rapid synthesis and discovery of sensors from libraries.
Using the present molecular design strategy, sensors were identified that have a wide variety of responses to quenching metal ions beyond simple quenching of fluorescence. Because of the diversity of sensor responses, as few as two sensors (1 and 2) can be used to differentiate all eight metal ions in the set. The modular nature of this sensor design strategy suggests a broadly applicable approach to finding sensors for differentiating many different cations by pattern-based recognition, simply by varying the sequence and composition of ligands and fluorophores using a DNA synthesizer.
Supplementary Material
Acknowledgment
We thank the National Institutes of Health (GM067201) for support.
Footnotes
Supporting Information Available: Experimental procedures; synthesis and characterization data; screening and fluorescence data; chemometric analysis. This material is available free of charge via the Internet at http://pubs.acs.org.
References
- 1.Liu J, Lu Y. J. Fluoresc. 2004;14:343–354. doi: 10.1023/b:jofl.0000031816.06134.d3. [DOI] [PubMed] [Google Scholar]
- 2.Lee JH, Wang Z, Liu J, Lu Y. J. Am. Chem. Soc. 2008;130:14217–14226. doi: 10.1021/ja803607z. [DOI] [PMC free article] [PubMed] [Google Scholar]
- 3.Alexander DC, Costanzo MA, Guzzo J, Cai J, Charoensri N, Diorio C, Dubow MS. Water, Air, Soil Pollut. 2000;123:81–94. [Google Scholar]
- 4.Luong JHT, Majid E, Male KB. Open Anal. Chem. J. 2007;1:7–14. [Google Scholar]
- 5.Korolczuk M, Moroziewicz A, Grabarczyk M. Anal. Bioanal. Chem. 2005;382:1678–1682. doi: 10.1007/s00216-005-3358-2. [DOI] [PubMed] [Google Scholar]
- 6.Zabat N, Abbessi M, Kherrat R, Jaffrezic-Renault N, Zougar S, Grid A. Mater. Sci. Eng., C. 2008;28:1006–1009. [Google Scholar]
- 7.Ivask A, Virta M, Kahru A. Soil Biol. Biochem. 2002;34:1439–1447. [Google Scholar]
- 8.Ferreira SLC, Santos HC, Costa ACS, de la Guardia M. Appl. Spectrosc. Rev. 2004;39:457–474. [Google Scholar]
- 9.Chiswell B, Rauchle G. Talanta. 1990;37:237–259. doi: 10.1016/0039-9140(90)80029-f. [DOI] [PubMed] [Google Scholar]
- 10.Que EL, Domaille DW, Chang CJ. Chem. Rev. 2008;108:1517–1549. doi: 10.1021/cr078203u. [DOI] [PubMed] [Google Scholar]
- 11.Domaille DW, Que EL, Chang CJ. Nat. Chem. Biol. 2008;4:168–175. doi: 10.1038/nchembio.69. [DOI] [PubMed] [Google Scholar]
- 12.Nolan EM, Lippard SJ. Acc. Chem. Res. 2009;42:193–203. doi: 10.1021/ar8001409. [DOI] [PMC free article] [PubMed] [Google Scholar]
- 13.Nolan EM, Lippard SJ. Chem. Rev. 2008;108:3443–3480. doi: 10.1021/cr068000q. [DOI] [PubMed] [Google Scholar]
- 14.Carol P, Sreejith S, Ajayoghosh A. Chem. Asian, J. 2007;2:338–348. doi: 10.1002/asia.200600370. [DOI] [PubMed] [Google Scholar]
- 15.Kimura E, Koike T. Chem. Soc. Rev. 1998;27:179–184. [Google Scholar]
- 16.Selid PD, Xu H, Collins EM, Face-Collins MS, Zhao JX. Sensors. 2009;9:5446–5459. doi: 10.3390/s90705446. [DOI] [PMC free article] [PubMed] [Google Scholar]
- 17.Li J, Lu Y. J. Am. Chem. Soc. 2000;122:10466–10467. [Google Scholar]
- 18.Wang H, Kim Y, Liu H, Zhu Z, Bamrungsap S, Tan W. J. Am. Chem. Soc. 2009;131:8221–8226. doi: 10.1021/ja901132y. [DOI] [PubMed] [Google Scholar]
- 19.Varnes AW, Dodson RB, Wehry EL. J. Am. Chem. Soc. 1972;94:946–950. doi: 10.1021/ja00758a037. [DOI] [PubMed] [Google Scholar]
- 20.Dederen JC, Van der Auweraer M, De Schryver FC. J. Phys. Chem. 1981;85:1198–1202. [Google Scholar]
- 21.Kemlo JA, Shepherd TM. Chem. Phys. Lett. 1977;47:158–162. [Google Scholar]
- 22.Rupcich N, Chiuman W, Nutiu R, Mei S, Flora KK, Li Y, Brennan JD. J. Am. Chem. Soc. 2006;128:780–790. doi: 10.1021/ja053336n. [DOI] [PubMed] [Google Scholar]
- 23.Fabbrizzi L, Licchelli M, Pallavicini P, Sacchi D, Taglietti A. Analyst. 1996;121:1763–1768. [Google Scholar]
- 24.Fabbrizzi L, Licchelli M, Mancin F, Pizzeghello M, Rabaioli G, Taglietti A, Tecilla P, Tonellato U. Chem. Eur. J. 2002;8:94–101. doi: 10.1002/1521-3765(20020104)8:1<94::aid-chem94>3.0.co;2-l. [DOI] [PubMed] [Google Scholar]
- 25.Kikkeri R, Traboulsi H, Humbert N, Gumienna-Kontecka E, Arad-Yellin R, Melman G, Elhabiri M, Albrecht-Gary AM, Shanzer A. Inorg. Chem. 2007;46:2485–2497. doi: 10.1021/ic061952u. [DOI] [PubMed] [Google Scholar]
- 26.Epsztejn S, Kakhlon O, Glickstein H, Breuer W, Cabantchik ZI. Anal. Biochem. 1997;248:31–40. doi: 10.1006/abio.1997.2126. [DOI] [PubMed] [Google Scholar]
- 27.Palanche T, Marmolle F, Abdallah MA, Shanzer A, Albrecht-Gary AM. J. Biol. Inorg. Chem. 1999;4:188–198. doi: 10.1007/s007750050304. [DOI] [PubMed] [Google Scholar]
- 28.Thomas SW, III, Joly GD, Swager TM. Chem. Rev. 2007;107:1339–1386. doi: 10.1021/cr0501339. [DOI] [PubMed] [Google Scholar]
- 29.Tong H, Wang L, Jing X, Wang F. Macromolecules. 2002;35:7169–7171. [Google Scholar]
- 30.Lackowicz JR. Priciples of Fluorescence Spectroscopy. 3rd Springer; New York: 2006. [Google Scholar]
- 31.Czarnik AW. Acc. Chem. Res. 1994;27:302–308. [Google Scholar]
- 32.Grabchev I, Chovelon JM, Quian X. New J. Chem. 2003;27:337–340. [Google Scholar]
- 33.Tumambac GE, Rosencrance CM, Wolf C. Tetrahedron. 2004;60:11293–11297. [Google Scholar]
- 34.Yoon S, Miller EW, Do PH, Chang CJ. Angew. Chem. Int. Ed. 2007;46:6658–6661. doi: 10.1002/anie.200701785. [DOI] [PubMed] [Google Scholar]
- 35.He Q, Miller EW, Wong AP, Chang CJ. J. Am. Chem. Soc. 2006;128:9316–9317. doi: 10.1021/ja063029x. [DOI] [PubMed] [Google Scholar]
- 36.Dodani SC, He Q, Chang CJ. J. Am. Chem. Soc. 2009;131:18020–18021. doi: 10.1021/ja906500m. [DOI] [PMC free article] [PubMed] [Google Scholar]
- 37.Bricks JL, Kovalchuk A, Triefligner C, Nofz M, Buschel M, Tolmachev AI, Daub J, Rurack K. J. Am. Chem. Soc. 2005;127:13522–13529. doi: 10.1021/ja050652t. [DOI] [PubMed] [Google Scholar]
- 38.Yoon J, Ohler NE, Vance DH, Aumiller WD, Czarnik AW. Tetrahedron Lett. 1997;38:3845–3848. [Google Scholar]
- 39.Ghosh P, Bharadwaj PK, Roy J, Ghosh S. J. Am. Chem. Soc. 1997;119:11903–11909. [Google Scholar]
- 40.Sankaran NB, Mandal PK, Bhattacharya B, Samanta A. J. Mater. Chem. 2005;15:2854–2859. [Google Scholar]
- 41.Fabbrizzi L, Licchelli M, Parodi L, Taglietti A. J. Flouresc. 1998;8:263–271. [Google Scholar]
- 42.Chae MY, Yoon J, Czarnik AW. J. Mol. Recognit. 1996;9:297–303. doi: 10.1002/(SICI)1099-1352(199607)9:4%3C297::AID-JMR335%3E3.0.CO;2-6. [DOI] [PubMed] [Google Scholar]
- 43.Ramachandram B, Samanta A. Chem. Commun. 1997;11:1037–1038. [Google Scholar]
- 44.Zhou Z, Yu M, Yang H, Huang K, Li F, Yi T, Huang C. Chem. Commun. 2008;29:3387–3389. doi: 10.1039/b801503a. [DOI] [PubMed] [Google Scholar]
- 45.Mokhir A, Kiel A, Herten DP, Kraemer R. Inorg. Chem. 2005;44:5661–5666. doi: 10.1021/ic050362d. [DOI] [PubMed] [Google Scholar]
- 46.Kim HJ, Park SY, Yoon S, Kim JS. Tetrahedron. 2008;64:1294–1300. [Google Scholar]
- 47.Coskun A, Akkaya EU. J. Am. Chem. Soc. 2006;128:14474–14475. doi: 10.1021/ja066144g. [DOI] [PubMed] [Google Scholar]
- 48.Wang X, Guo X. Analyst. 2009;134:1348–1354. doi: 10.1039/b822744f. [DOI] [PubMed] [Google Scholar]
- 49.Yang R-H, Chan W-H, Lee AWM, Xia P-F, Zhang H-K, Li K. J. Am. Chem. Soc. 2003;125:2884–2885. doi: 10.1021/ja029253d. [DOI] [PubMed] [Google Scholar]
- 50.Sankaran NB, Banthia S, Das A, Samanta A. New J. Chem. 2002;26:1529–1531. [Google Scholar]
- 51.Lim NC, Pavlova SV, Bruckner C. Inorg. Chem. 2009;48:1173–1182. doi: 10.1021/ic801322x. [DOI] [PubMed] [Google Scholar]
- 52.Song F, Watanabe S, Floreancig PE, Koide K. J. Am. Chem. Soc. 2008;130:16460–16461. doi: 10.1021/ja805678r. [DOI] [PubMed] [Google Scholar]
- 53.Chae MY, Czarnik AW. J. Am Chem. Soc. 1992;114:9704–9705. [Google Scholar]
- 54.Zhao Y, Lin Z, He C, Wu H, Duan C. Inorg. Chem. 2006;45:10013–10015. doi: 10.1021/ic061067b. [DOI] [PubMed] [Google Scholar]
- 55.Kim HJ, Lee SJ, Park SY, Jung JH, Kim JS. Adv. Mater. 2008;20:3229–3234. [Google Scholar]
- 56.Mayr T, Igel C, Liebsch G, Klimant I, Wolfbeis OS. Anal. Chem. 2003;75:4389–4396. doi: 10.1021/ac020774t. [DOI] [PubMed] [Google Scholar]
- 57.Hewage HS, Anslyn EV. J. Am. Chem. Soc. 2009;131:13099–13106. doi: 10.1021/ja904045n. [DOI] [PubMed] [Google Scholar]
- 58.Wright AT, Anslyn EV. Chem. Soc. Rev. 2006;35:14–28. doi: 10.1039/b505518k. [DOI] [PubMed] [Google Scholar]
- 59.Wu X, Kim J, Dordic JS. Biotechnol. Prog. 2000;16:513–516. doi: 10.1021/bp0000104. [DOI] [PubMed] [Google Scholar]
- 60.Kim J, Wu X, Herman MR, Dordick JS. Anal. Chim. Acta. 1998;370:251–258. [Google Scholar]
- 61.Palacios MA, Wang Z, Montes VA, Zyryanov GV, Anzenbacher P. J. Am. Chem. Soc. 2008;130:10307–10314. doi: 10.1021/ja802377k. [DOI] [PubMed] [Google Scholar]
- 62.Gao G, Straessler C, Tahmassebi D, Kool ET. J. Am. Chem. Soc. 2002;124:11590–11591. doi: 10.1021/ja027197a. [DOI] [PubMed] [Google Scholar]
- 63.Wilson JN, Gao J, Kool ET. Tetrahedron. 2007;63:3427–3422. doi: 10.1016/j.tet.2006.07.113. [DOI] [PMC free article] [PubMed] [Google Scholar]
- 64.Gao J, Watanabe S, Kool ET. J. Am. Chem. Soc. 2004;126:12748–12749. doi: 10.1021/ja046910o. [DOI] [PubMed] [Google Scholar]
- 65.Teo YN, Wilson JN, Kool ET. J. Am. Chem. Soc. 2009;131:3923–3933. doi: 10.1021/ja805502k. [DOI] [PMC free article] [PubMed] [Google Scholar]
- 66.Dai N, Teo YN, Kool KT. Chem. Commun. 2010;46:1221–1223. doi: 10.1039/b926338a. [DOI] [PMC free article] [PubMed] [Google Scholar]
- 67.Tan SS, Teo YN, Kool ET. Org. Lett. 2010;12:4820–4823. doi: 10.1021/ol1019794. [DOI] [PMC free article] [PubMed] [Google Scholar]
- 68.Samain F, Ghosh S, Teo YN, Kool ET. Angew. Chem., Int. Ed. 2010;49:7025–7029. doi: 10.1002/anie.201002701. [DOI] [PMC free article] [PubMed] [Google Scholar]
- 69.Kim SJ, Kool ET. J. Am. Chem. Soc. 2006;128:6164–6171. doi: 10.1021/ja0581806. [DOI] [PMC free article] [PubMed] [Google Scholar]
- 70.Strassler C, Davis N, Kool ET. Helv. Chim. Acta. 1999;82:2160–2171. doi: 10.1002/(sici)1522-2675(19991215)82:12<2160::aid-hlca2160>3.0.co;2-4. [DOI] [PMC free article] [PubMed] [Google Scholar]
- 71.Kitamura M, Shabbir SH, Anslyn EV. J. Org. Chem. 2009;74:4479–4489. doi: 10.1021/jo900433j. [DOI] [PubMed] [Google Scholar]
- 72.Zhang T, Edwards NY, Bonizzoni M, Anslyn EV. J. Am. Chem. Soc. 2009;131:11976–11984. doi: 10.1021/ja9041675. [DOI] [PubMed] [Google Scholar]
Associated Data
This section collects any data citations, data availability statements, or supplementary materials included in this article.