Abstract
Biological sequences are often analyzed by detecting homologous regions between them. Homology search is confounded by simple repeats, which give rise to strong similarities that are not homologies. Standard repeat-masking methods fail to eliminate this problem, and they are especially ill-suited to AT-rich DNA such as malaria and slime-mould genomes. We present a new repeat-masking method, tantan, which is motivated by the mechanisms that create simple repeats. This method thoroughly eliminates spurious homology predictions for DNA–DNA, protein–protein and DNA–protein comparisons. Moreover, it enables accurate homology search for non-coding DNA with extreme A + T composition.
INTRODUCTION
A major way of analyzing biological sequences is to find regions that are descended from a common ancestor, i.e. homologs. This is done by using software such as blast (1), which finds regions that are similar. It is possible to calculate the statistical significance of a similarity, which is the probability of such a similarity arising by chance between random sequences with given lengths and letter frequencies (2). If this probability is low, then the similarity is a good candidate for homology.
Unfortunately, biological sequences exhibit many non-random features such as tandem repeats, low complexity regions, CpG islands and isochores. These not only violate the statistical assumptions, but also increase the number of non-homologous similarities that are stronger than any given homologous similarity. For example, there are very many sequences similar to atatatatatatatatatatatat in the human and mouse genomes, but most are probably not homologous to each other. To deal with this problem, it is standard to mask ‘simple’ regions (low complexity and/or short-period tandem repeats) before attempting homology search.
We recently showed that standard DNA masking methods [including DustMasker, Tandem Repeats Finder (trf) and runnseg] are imperfect, because they let through some very strong but non-homologous similarities (3). We also showed that trf with newly tuned parameters gives better results. However, neither did we examine protein–protein or protein–DNA comparisons, nor did we investigate extremely AT-rich DNA such as Plasmodium or Dictyostelium genomes.
Simple sequences are thought to evolve mainly by strand slippage during DNA synthesis (Figure 1). If nearby repeats already exist, strand slippage is frequent, causing rapid expansions and contractions of the region. Weak repeats might arise initially by random point mutations, before the slippage mechanism starts to act (4).
Figure 1.
Strand slippage during DNA synthesis. The arrow indicates the synthesis of the top strand.
In this study, we show that standard masking methods are as imperfect for proteins as they are for DNA, and that they are especially ill-suited to highly AT-rich DNA. We describe a new masking method called tantan, which is inspired by the strand slippage mechanism that generates simple repeats. This method enables reliable homology search for protein–protein, protein–DNA and DNA–DNA comparisons, even for extremely AT-rich DNA.
MATERIALS AND METHODS
For full details, see also the Supplementary Data.
Masking algorithm
We developed tantan iteratively, trying several different algorithms. First, we tried a ‘simplest possible’ method described by Spouge (5). This method scans a scoring matrix (such as blosum62) along the sequence, and notes the score between each letter and the letter (say) three positions previous. Finally, it finds all maximal-scoring segments, with score greater than some threshold T. This procedure finds inexact tandem repeats with period three. We repeated it for all periods between one and (say) 100.
This optimal segment approach suffered from a classic problem (6): a large non-repetitive region could get included in a segment, if was flanked by strong repeats on either side. To solve this problem, we modified the algorithm to find the highest scoring set of segments. In this method, a score penalty of T is subtracted for initiating a new segment, which ensures that segments with score ≤ T are not identified.
This second method is good at identifying tandem repeats such as those in Figure 2A–C, but poor at finding non-tandem simple regions such as that in Figure 2D.
Figure 2.
Examples of spurious alignments found despite masking repeats. (A) C. elegans DNA (upper) versus reversed P. pacificus DNA (lower), after masking both with DustMasker. (B) A vertebrate protein (upper) versus a reversed plant protein (lower), after masking both with SegMasker. (C) Human DNA (upper) versus reversed opossum DNA (lower), after masking both with trf. (D) A. thaliana DNA (upper) versus reversed P. patens DNA (lower), after masking both with trf.
We assume that non-tandem simple regions are caused by the same DNA slippage mechanism, but that they arose by many slippage events with different offsets. Thus, we expect them to exhibit weak self-similarity at many offsets, instead of strong self-similarity at one offset. Therefore, we need an algorithm that somehow integrates self-similarity at different offsets.
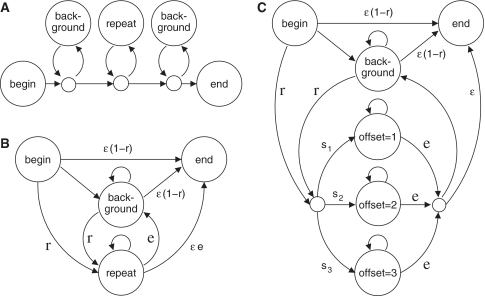
The two algorithms described so far are equivalent to Viterbi decoding with simple hidden Markov models (Figure 3A and B). Hence, a natural solution is to incorporate the different offsets into one model (Figure 3C), and employ posterior decoding (7). With posterior decoding, we can get the model's posterior probability that each letter is ‘background’ (i.e. random and non-repetitive) or non-background (i.e. repetitive with any offset). We named this final algorithm tantan.
Figure 3.
Three models of a sequence with repetitive regions. (A) A model that allows one repetitive region, flanked by random background letters. (B) A model that allows multiple repetitive regions, separated by random background letters. (C) A model that allows multiple repetitive regions with different repeat offsets. A repeat offset of (say) three means that each letter tends to resemble the one three positions previous.
Masking parameters
Despite our efforts to keep it simple, tantan has several nuisance parameters: scoring matrix, maximum offset (w), r, e and s1 … sw (Figure 3C). It is possible to tune most of these parameters by maximum likelihood fitting to some sequence data, using expectation–maximization (7). Unfortunately, this did not give useful results: the tuned parameters caused most of the sequence to be masked. Our interpretation of this is that sequences are indeed pervaded by subtle repeats, but our aim here is to mask only the most egregious repeats that hamper homology detection.
Thus, we chose tantan's parameters by guesswork, trial and error. We used the blosum62 matrix for proteins (8), and the simple matrix for DNA (Table 1). For AT-rich DNA, however, we used atMask. We set w to 50 for proteins and 100 for DNA. We set e to 0.05, and r to several values between 0.005 and 0.05. We fixed s1 … sw by a simple decay: si+1 = 0.9si. (The intuition is that longer period tandem repeats are less likely to cause spurious alignments, but it does not really make sense to have a sudden cutoff at 50 or 100.) Finally, we masked letters with posterior probability of being repetitive ≥0.5.
Table 1.
DNA scoring schemes used in this study
| Name | A, T match score | G, C match score | Transition cost | Transversion cost | Gap exist cost | Gap extend cost | Target % identity | Target % A + T |
|---|---|---|---|---|---|---|---|---|
| simple | 1 | 1 | 1 | 1 | 7 | 1 | 75 | 50 |
| at71 | 2 | 4 | 2 | 3 | 15 | 2 | 75 | 71 |
| at77 | 2 | 5 | 2 | 3 | 15 | 2 | 73 | 77 |
| atMask | 2 | 5 | 5 | 5 | – | – | 92 | 79 |
Other masking tools
We used DustMasker (9) and SegMasker (10) from NCBI blast+ 2.2.23. We also used trf 4.04 with options 2 5 5 80 10 30 200 -h -m -r (11).
Sequence alignment procedures
To compare proteins, we used the blosum62 matrix with a gap exist cost of 11 and a gap extend cost of 2. To compare DNA, we used the simple scoring scheme (Table 1). To compare AT-rich DNA, however, we used the at77 scoring scheme. DNA comparisons were done on both strands. All comparisons were done using last (3).
The scoring matrices in Table 1 are consistent with the t92 model of evolution (see the Supplementary Data) (12). We calculated their target frequencies using the method described in (13).
For each genome or protein comparison, we calculated how many alignments would be expected between random sequences with the same lengths and letter frequencies. We did this with lastex from the last package, which uses the method of Park et al. (2).
Sequence data
From the UCSC genome database, we obtained ce6, priPac1, hg19 and monDom5. We downloaded the Arabidopsis thaliana and Dictyostelium discoideum genomes from the NCBI. We obtained PfalciparumGenomic_PlasmoDB-6.4.fasta from PlasmoDB and Physcomitrella_patens.1_1.fasta from JGI.
From UniProt Release 2010_08, we obtained all plant proteins (739 022 unique sequences) and all vertebrate proteins (592 943 unique sequences: including mammals, rodents and human).
RESULTS
Limitations of previous methods
We tested repeat-masking methods by comparing reversed sequences to non-reversed sequences (3). Since sequences do not evolve by reversal, there are no true homologs in these tests.
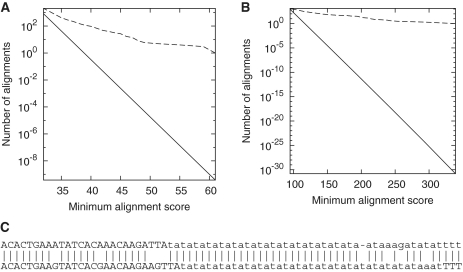
For example, we compared the Caenorhabditis elegans genome to the reversed Pristionchus pacificus genome, after masking both with DustMasker. (Masking was always done before reversing.) Some strong similarities were found, such as that shown in Figure 2A. This is an alignment of tandem repeats, and the similarity between the C. elegans repeat unit and the reversed P. pacificus repeat unit is (presumably) pure coincidence. Thus, DustMasker does not eliminate spurious similarities caused by tandem repeats, as we reported previously (3).
In similar fashion, we compared vertebrate proteins to reversed plant proteins after masking both with SegMasker. Again, we found strong similarities arising from unmasked tandem repeats (Figure 2B).
We previously found that trf with newly tuned parameters eliminates spurious DNA alignments quite effectively (3). It is not perfect, however. If we compare the human genome to the reversed opossum genome after masking both with trf, we find significantly more and stronger similarities than expected for random sequences (Figure 4C). This is partly because trf is not designed to find compound repeats (Figure 2C): it looks for repeats where each unit is similar to a consensus sequence (11).
Figure 4.
Alignments of reversed sequences after repeat-masking method. The dashed line is the observed number of alignments, and the solid line is the expected number for random sequences. Alignments between: (A) the C. elegans genome and the reversed P. pacificus genome, after masking both with DustMasker; (B) vertebrate proteins and reversed plant proteins, after masking both with SegMasker; (C) the human genome and the reversed opossum genome, after masking both with trf; (D) the P. falciparum genome and the reversed D. discoideum genome, after masking both with DustMasker.
Finally, we compared AT-rich DNA: the Plasmodium falciparum genome and the reversed D. discoideum genome, after masking both with DustMasker. One problem is that DustMasker masks large fractions of these sequences (Table 2). Despite this, we find more and much stronger similarities than expected for random sequences with the same base frequencies (Figure 4D).
Table 2.
Percent of letters that get masked by previous repeat-masking methods
| Sequences | Masker | % masked |
|---|---|---|
| P. falciparum | DustMasker | 47 |
| D. discoideum | 37 | |
| C. elegans | 9 | |
| P. pacificus | 4 | |
| P. falciparum | trf | 38 |
| D. discoideum | 31 | |
| H. sapiens | 6 | |
| M. domestica | 6 | |
| Vertebrate proteins | SegMasker | 9 |
| Plant proteins | 9 |
Effectiveness of the new method
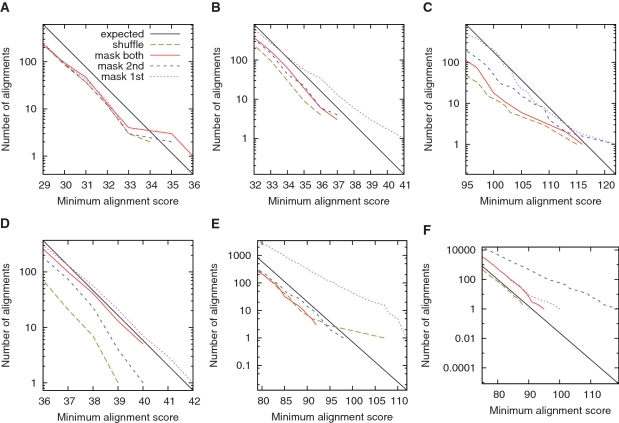
As above, we tested tantan by comparing reversed sequences to non-reversed sequences. For example, we compared the C. elegans genome to the reversed P. pacificus genome after masking both with tantan. In this case, we did not find more or stronger similarities than expected for random sequences (Figure 5A, red line). [In fact, we find fewer than theoretically expected (black line), but about the same as when we compare shuffled versions of the genomes (dashed brown line). This is because we used a heuristic similarity search algorithm, last, which misses some high-scoring alignments.] Thus, tantan eliminated spurious similarities.
Figure 5.
Alignments of reversed sequences after masking repeats with tantan. Alignments between: (A) the C. elegans genome and the reversed P. pacificus genome; (B) the A. thaliana genome and the reversed P. patens genome; (C) vertebrate proteins and reversed plant proteins; (D) the human genome and the reversed opossum genome; (E) the P. falciparum genome and the reversed D. discoideum genome; (F) the P. falciparum genome and the reversed human genome. The colors indicate alignments after: masking both sets of sequences (solid red); masking the first-named set only (dotted magenta); masking the second-named set only (dashed blue); shuffling the letters in each set (dashed brown). The black lines indicate the expected number of alignments for random sequences.
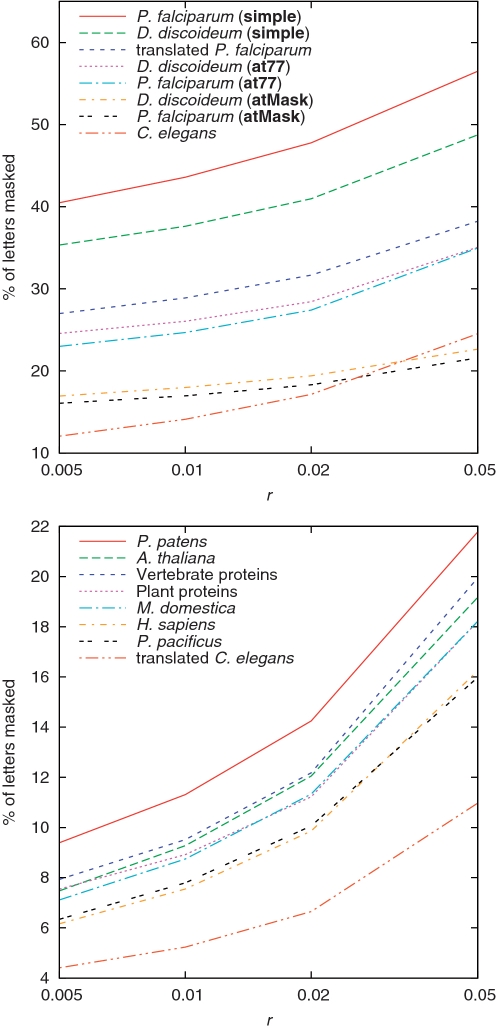
The proportion of letters masked by tantan depends on its r parameter, which is the model's probability per position of starting a repetitive tract (Figure 3). At our default setting of 0.005, it masks less than 10% of most sequences (Figure 6), which does not seem excessive compared with standard masking methods (Table 2).
Figure 6.
Percent of letters that get masked by tantan, as we vary its r parameter (Figure 3C). For P. falciparum and D. discoideum, we also varied tantan's scoring matrix.
We performed more tests using plant genomes, proteins and mammal genomes (Figure 5B–D, red lines). tantan did not completely eliminate excess similarities for the mammal genomes (Figure 5D): there are clearly more alignments after masking (red line) than after shuffling (dashed brown line). We could get fewer excess similarities by increasing r (e.g. to 0.01). In general, though, tantan eliminates spurious alignments more effectively than standard masking methods.
AT-rich DNA
As a more challenging test, we compared the P. falciparum genome to the reversed D. discoideum genome. Both genomes are about 80% A + T. At first we ran tantan with the at77 scoring matrix, which we also used for aligning these sequences. We found that tantan masks about 24% of the letters, which seems undesirably high (Figure 6). Therefore, we tried a different matrix with higher mismatch costs, atMask (Table 1). We also increased r to 0.01. With these settings, the masking rate is around 17% (Figure 6), and spurious alignments are eliminated (Figure 5E, red line).
Finally, we compared AT-rich and AT-normal DNA: the P. falciparum genome and the reversed human genome. We aligned these sequences using the at71 scoring scheme, which is tuned for AT-richness midway between these genomes. (It might be better to use an asymmetric scoring matrix, but we did not explore this idea.) We ran tantan on human with simple and r = 0.005, and on P. falciparum with atMask and r = 0.01. Spurious alignments were mostly supressed (Figure 5F): there were slightly more alignments after masking (red line) than after shuffling (dashed brown line).
Masking one sequence only
So far, we have always repeat-masked both sequences being compared: what if we mask just one sequence? In this case, we have to increase r in order to avoid spurious similarities. We obtained fairly good results with r = 0.02 (r = 0.05 for AT-rich DNA): these are shown in Figure 5 (dashed blue and dotted magenta lines). Some results are worse than others: in particular, when we compare the P. falciparum genome to the reversed human genome, we get much fewer spurious similarities after masking the former than after masking the latter. In general, we feel it is preferable to mask both sequences.
Comparing DNA to proteins
Finding homologies between DNA and proteins is useful for detecting protein-coding genes and pseudogenes in the DNA. It can be done by translating the DNA in all six reading frames and finding similarities at the protein level.
To test this kind of comparison, we aligned the C. elegans genome to reversed plant proteins, after masking with tantan (Figure 7A). Spurious similarities were mostly supressed when we masked the proteins only (dashed red line, r = 0.02), but not when we masked the DNA only (dashed blue line, r = 0.02). Thus, DNA-level masking is not very effective for protein-level alignment.
Figure 7.
Alignments between DNA sequences and reversed protein sequences, after masking repeats with tantan. Alignments between: (A) the C. elegans genome and reversed plant proteins; (B) the P. falciparum genome and reversed vertebrate proteins. The colors indicate alignments after: masking the proteins, and the DNA at the protein level (solid red); masking the proteins, and the DNA at the DNA level (solid blue); masking the proteins only (dashed red); masking the DNA only, at the DNA level (dashed blue); shuffling the letters in each set (dashed brown). The black lines indicate the expected number of alignments for random sequences.
We also tried masking both the proteins and the DNA, with the DNA masking done either before translating it or after. Masking after translation worked very well: spurious similarities were eliminated (solid red line, r = 0.005), and the proportion of letters masked was very low (Figure 6). When we masked the DNA before translation, we found it necessary to mask the proteins more aggressively in order to avoid spurious alignments (solid blue line, protein r = 0.02, DNA r = 0.005).
We also compared the P. falciparum genome to reversed vertebrate proteins (Figure 7B). In this case, masking only the proteins was less effective at supressing spurious alignments (dashed red line, r = 0.02). Furthermore, when we masked the DNA after translation, >25% of the residues got masked (Figure 6). This masking rate could perhaps be reduced by using a matrix other than blosum62 (13), but we did not explore this idea. Masking both the proteins and the DNA before translating gave a reasonable balance of masking rates and masking efficacy (solid blue line, protein r = 0.02, DNA r = 0.01).
Soft masking
Soft masking means that masking is applied during earlier stages of the sequence comparison algorithm but not during later stages. Typical algorithms like blast and last have several stages: find candidate matches (seeds), then check if there is a high-scoring gapless alignment around each seed and finally check for a high-scoring gapped alignment. Soft masking aims to avoid truncating the final alignments.
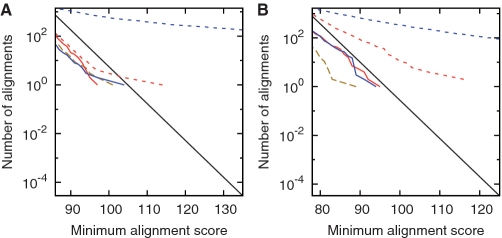
We tested soft masking by comparing the A. thaliana genome to the reversed Physcomitrella patens genome, after masking both with tantan. We applied the masking during the seeding and gapless alignment phases of last, but not the gapped alignment phase. This soft masking failed to eliminate spurious similarities (Figure 8A), whereas hard masking succeeded (Figure 5B). Soft masking likewise failed for proteins (Figure 8B), and for DNA using trf instead of tantan (3).
Figure 8.
Alignments of reversed sequences after soft-masking repeats with tantan. Alignments between: (A) the A. thaliana genome and the reversed P. patens genome; (B) vertebrate proteins and reversed plant proteins. The dashed line is the observed number of alignments, and the solid line is the expected number for random sequences. (C) One of the alignments between A. thaliana (upper) and reversed P. patens (lower), with masked letters in lowercase.
The following variant of soft masking would avoid this problem. First, perform homology search with masking applied at all stages. Then, re-align the homologous regions with masking turned off. We have added this procedure to LAST (by performing gapped alignment twice: first with masking and then without). The only other alignment tool we know of that uses this type of soft masking is fasta (14).
An argument against soft masking is that aligning simple sequences position-by-position makes no sense from either structural or evolutionary viewpoints (10). This issue can be mitigated by estimating the reliability of each column in an alignment (3). Simple regions tend to have multiple plausible alignments, and hence low reliability estimates for any one alignment.
Time and memory usage
tantan used 78 s to mask the 100-megabase C. elegans genome, whereas DustMasker used 18 s and trf used 677 s (on a Xeon E5540 CPU).
tantan's posterior decoding implementation stores one four-byte floating point number per letter in the sequence. So for the human genome, whose longest chromosome has about 250 million letters, it uses slightly over 1 GB.
DISCUSSION
We have shown that standard repeat-masking and homology search procedures can yield non-homologous alignments of simple repeats. Moreover, these spurious alignments can have E-values <10−30 (Figure 4), so they cannot be avoided by using moderately conservative E-value thresholds. This may seem shocking, because homology search has been widely used for decades and underlies so much research. On the other hand, the dangers of computational similarity search have been described before (15,16), so our result may not be so surprising after all.
More importantly, we have described a new repeat masking method (tantan) that, in our tests, eliminates spurious similarities rather reliably. This should be especially useful for large-scale, fully automated homology searches, such as comparisons of whole genomes or proteomes.
Because simple sequences are an empirical phenomenon, it is impossible to prove that our method will always prevent spurious alignments. It is also disconcerting that tantan has several hand-optimized parameters, and there is a danger that we unconsciously over-fitted them to our test cases. To mitigate these problems, we have tested it on a diverse sample of sequences: genomes of nematodes, plants, and mammals; proteins; and AT-rich Plasmodium and Dictyostelium genomes.
There are dozens of other methods for detecting simple sequences (17), and we cannot rule out that some of them eliminate spurious alignments as well as or better than tantan, perhaps after tuning their parameters. We suspect, however, that none of them target as effectively all the kinds of sequence that seem to arise from DNA strand slippage. We must point out that these methods may have different aims: for example, trf is used for studying tandem repeats in their own right.
Repeat-masking is commonly used for analyses other than homology search, for example motif discovery or gene prediction. We have not yet tested whether tantan is effective for any other kind of analysis.
Finally, our methods seem to make accurate homology search with AT-rich DNA possible for the first time. Studies of Plasmodium have tended to use sequence comparison at the protein level, and hinted that comparison at the DNA level is ‘inherently’ difficult (18,19). It is generally better to compare protein-coding DNA at the protein level, but non-coding DNA is also of interest (19). We can see no reason why the standard alignment paradigm should not work for such AT-rich DNA, provided that the alignment scoring scheme and repeat-masking method are carefully tuned.
The tantan source code is freely available at http://www.cbrc.jp/tantan/.
SUPPLEMENTARY DATA
Supplementary Data are available at NAR Online.
FUNDING
This work was supported by no specific funding. Funding for open access charge: AIST general research funds.
Conflict of interest statement. None declared.
ACKNOWLEDGEMENTS
I thank John Spouge for discussions that initiated this project, the RNA Informatics Team at CBRC for discussions during the project, and Paul Horton for helpful comments on the manuscript.
REFERENCES
- 1.Altschul SF, Madden TL, Schäffer AA, Zhang J, Zhang Z, Miller W, Lipman DJ. Gapped BLAST and PSI-BLAST: a new generation of protein database search programs. Nucleic Acids Res. 1997;25:3389–3402. doi: 10.1093/nar/25.17.3389. [DOI] [PMC free article] [PubMed] [Google Scholar]
- 2.Park Y, Sheetlin S, Spouge JL. Estimating the Gumbel scale parameter for local alignment of random sequences by importance sampling with stopping times. Ann. Stat. 2009;37:3697. doi: 10.1214/08-AOS663. [DOI] [PMC free article] [PubMed] [Google Scholar]
- 3.Frith MC, Hamada M, Horton P. Parameters for accurate genome alignment. BMC Bioinformatics. 2010;11:80. doi: 10.1186/1471-2105-11-80. [DOI] [PMC free article] [PubMed] [Google Scholar]
- 4.Richard GF, Kerrest A, Dujon B. Comparative Genomics and Molecular Dynamics of DNA repeats in Eukaryotes. Microbiol. Mol. Biol. Rev. 2008;72:686–727. doi: 10.1128/MMBR.00011-08. [DOI] [PMC free article] [PubMed] [Google Scholar]
- 5.Spouge JL. Markov additive processes and repeats in sequences. J. Appl. Prob. 2007;44:514–527. [Google Scholar]
- 6.Zhang Z, Berman P, Wiehe T, Miller W. Post-processing long pairwise alignments. Bioinformatics. 1999;15:1012–1019. doi: 10.1093/bioinformatics/15.12.1012. [DOI] [PubMed] [Google Scholar]
- 7.Durbin R, Eddy SR, Krogh A, Mitchison G. Biological Sequence Analysis. Cambridge: Cambridge University Press; 2002. [Google Scholar]
- 8.Henikoff S, Henikoff JG. Amino acid substitution Matrices from Protein Blocks. Proc. Natl. Assoc. Sci. 1992;89:10915–10919. doi: 10.1073/pnas.89.22.10915. [DOI] [PMC free article] [PubMed] [Google Scholar]
- 9.Morgulis A, Gertz EM, Schäffer AA, Agarwala R. A fast and symmetric DUST implementation to mask low-complexity DNA sequences. J. Comput. Biol. 2006;13:1028–1040. doi: 10.1089/cmb.2006.13.1028. [DOI] [PubMed] [Google Scholar]
- 10.Wootton JC, Federhen S. Analysis of compositionally biased regions in sequence databases. Methods Enzymol. 1996;266:554–571. doi: 10.1016/s0076-6879(96)66035-2. [DOI] [PubMed] [Google Scholar]
- 11.Benson G. Tandem repeats finder: a program to analyze DNA sequences. Nucleic Acids Res. 1999;27:573–580. doi: 10.1093/nar/27.2.573. [DOI] [PMC free article] [PubMed] [Google Scholar]
- 12.Tamura K. Estimation of the number of nucleotide substitutions when there are strong transition-transversion and G+C-content biases. Mol. Biol. Evol. 1992;9:678–687. doi: 10.1093/oxfordjournals.molbev.a040752. [DOI] [PubMed] [Google Scholar]
- 13.Yu Y-K, Altschul SF. The construction of amino acid substitution matrices for the comparison of proteins with non-standard compositions. Bioinformatics. 2005;21:902–911. doi: 10.1093/bioinformatics/bti070. [DOI] [PubMed] [Google Scholar]
- 14.Pearson WR, Lipman DJ. Improved tools for biological sequence comparison. Proc. Natl Acad. Sci. USA. 1988;85:2444–2448. doi: 10.1073/pnas.85.8.2444. [DOI] [PMC free article] [PubMed] [Google Scholar]
- 15.Gilks WR, Audit B, De Angelis D, Tsoka S, Ouzounis C. Modeling the percolation of annotation errors in a database of protein sequences. Bioinformatics. 2002;18:1641–1649. doi: 10.1093/bioinformatics/18.12.1641. [DOI] [PubMed] [Google Scholar]
- 16.Wong WC, Maurer-Stroh S, Eisenhaber F. More than 1,001 problems with protein domain databases: transmembrane regions, signal peptides and the issue of sequence homology. PLoS Comput. Biol. 2010;6:e1000867. doi: 10.1371/journal.pcbi.1000867. [DOI] [PMC free article] [PubMed] [Google Scholar]
- 17.Leclercq S, Rivals E, Jarne P. Detecting microsatellites within genomes: significant variation among algorithms. BMC Bioinformatics. 2007;8:125. doi: 10.1186/1471-2105-8-125. [DOI] [PMC free article] [PubMed] [Google Scholar]
- 18.Carlton JM, Angiuoli SV, Suh BB, Kooij TW, Pertea M, Silva JC, Ermolaeva MD, Allen JE, Selengut JD, Koo HL, et al. Genome sequence and comparative analysis of the model rodent malaria parasite Plasmodium yoelii yoelii. Nature. 2002;419:512–519. doi: 10.1038/nature01099. [DOI] [PubMed] [Google Scholar]
- 19.Wu J, Sieglaff DH, Gervin J, Xie XS. Discovering regulatory motifs in the Plasmodium genome using comparative genomics. Bioinformatics. 2008;24:1843–1849. doi: 10.1093/bioinformatics/btn348. [DOI] [PMC free article] [PubMed] [Google Scholar]


