Abstract
We have determined the temperature dependence of DNA persistence length, a, using two different methods. The first approach was based on measuring the j-factors of short DNA fragments at various temperatures. Fitting the measured j-factors by the theoretical equation allowed us to obtain the values of a for temperatures between 5°C and 42°C. The second approach was based on measuring the equilibrium distribution of the linking number between the strands of circular DNA at different temperatures. The major contribution into the distribution variance comes from the fluctuations of DNA writhe in the nicked circular molecules which are specified by the value of a. The computation-based analysis of the measured variances was used to obtain the values of a for temperatures up to 60°C. We found a good agreement between the results obtained by these two methods. Our data show that DNA persistence length strongly depends on temperature and accounting for this dependence is important in quantitative comparison between experimental results obtained at different temperatures.
INTRODUCTION
DNA persistence length is a key parameter for quantitative interpretation of conformational properties of the molecule. Precise knowledge of its value is important for analysis of many biochemical processes involving interactions of two or more DNA sites. It is a basic parameter in the analysis of single-molecule force-extension experiments which are widely used to study DNA interactions with various proteins (1–3). As a consequence, the determination of DNA persistence length has received much attention over the past years [reviewed in (4,5)]. Today, we know sufficiently well how DNA persistence length, a, depends on ionic conditions (4) and even on DNA sequence (6). However, little is known about the temperature dependence of a. This dependence is essential for understanding the temperature dependence of many DNA conformational properties, such as the probabilities of loop formation and cyclization of DNA fragments, the free energy of DNA supercoiling, DNA extension under pulling force and others. Comparing experimental results obtained at different temperatures requires knowledge of the temperature dependence of DNA persistence length. Determining this dependence is a goal of the current study.
The worm-like chain model, which is used to describe DNA conformational properties, connects the bending rigidity of a polymer chain, g, to its persistence length (7–9):
| (1) |
where  is the Boltzmann constant and T is absolute temperature. If we assume that the bending rigidity of a polymer chain does not depend on temperature, Equation (1) describes the temperature dependence of a. Of course, there is no reason that the latter assumption should be valid for double-stranded DNA. One can expect that its bending rigidity decreases with temperature, since the helical structure completely melts at temperatures of 65–100°C (10,11). Therefore, we expect that in the case of DNA the actual temperature dependence of a should be stronger than one specified by Equation (1).
The temperature dependence of a was addressed experimentally many years ago by Gray and Hearst (12). These authors determined values of a from the measurements of DNA sedimentation performed at different temperatures. They found relatively small changes of a with temperature even smaller than follow from Equation (1) under the assumption of temperature-independent g. The changes, however, hardly exceeded statistical errors of a determination (results shown below in Figure 7). Clearly, to determine the temperature dependence of a, we need a method that allows very accurate measurement at any given temperature.
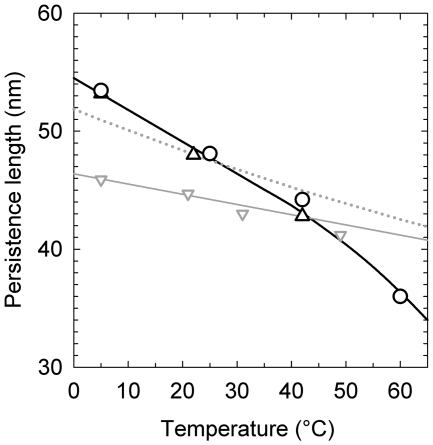
Figure 7.
The temperature dependence of DNA persistence length. The data obtained from the measurements of j-factors (open triangle) and the variance of  (open circle) in the current study are shown together with Equation (1) (dotted gray line) and the data from reference (12). The solid line represents manual interpolation of the current results.
Recently one more study addressed the temperature dependence of DNA flexibility (13). The study covered, however, a relatively narrow range of temperatures. The results of this work will be briefly discussed below.
Two independent approaches were used here to study the temperature dependence of DNA persistence length. One approach was based on measuring the j-factors of short DNA fragments at various temperatures (14,15). Subsequently, the measured j-factors are fitted by a theoretical equation to obtain the value of DNA persistence length (16,17). The second approach was based on measuring the equilibrium distribution of circular DNA molecules over the linking number of the complementary strands at different temperatures. The major contribution into the distribution variance comes from the fluctuations of DNA axis in the nicked circular molecules which depend on the persistence length (18). Fitting the measurements to the empirical equations, based on computer simulation of the linking number fluctuations, we obtained the values of a as a function of temperature. We found a good agreement between the results obtained with these two approaches. Our data show that DNA persistence length strongly depends on temperature. Thus, accounting for this dependence is necessary for a quantitative comparison between experiments performed at different temperatures.
MATERIALS AND METHODS
The j-factor measurement of short DNA fragments
Preparation of DNA fragments with EcoRI sticky ends
EcoRI fragments were obtained by chemical synthesis of sub-fragments, assembling them in solution, and cloning into pSP73 vector (Promega). First, a common part for all fragments of a set (∼160 bp) was inserted between the EcoRI and XbaI sites of the vector. The new plasmid was used as a vector for cloning the variable parts of the set, about 40 bp in length, which were inserted between XbaI and PstI sites. Each of the latter inserts also contained a EcoRI site near their right end which was needed to release the fragments from the vector. The sizes of the variable inserts diminished in 1-bp steps. The QIAGEN Miniprep Purification Kit was used to extract DNA from Escherichia coli cells. The desired fragments were obtained by treating the plasmids with EcoRI restriction endonuclease (NEB).
Preparation of DNA fragment with AgeI sticky ends
The 199-bp AgeI fragment was obtained by chemical synthesis of sub-fragments, assembling them in solution and cloning into pSP73 vector (Promega). First, a fragment (∼170 bp) containing an AgeI site near its right end was inserted between the PstI and HindIII sites of the vector. Into the new plasmid a fragment (∼40 bp) containing an AgeI site near its left end was inserted between XbaI and PstI sites. The QIAGEN Miniprep Purification Kit was used to extract DNA from E. coli cells. The desired fragments were obtained by treating the plasmids with AgeI restriction endonuclease [New England Biolabs (NEB)].
Preparation of DNA fragments with HindIII sticky ends was described in reference (17).
The sequences of all fragments were checked directly by Genewiz. The concentrations of purified DNAs were determined using a Hitachi Gene Spec I spectrophotometer.
Radioactive labeling
Each digested DNA was 5′-end labeled with 32P by OptiKinase (USB) in a 20-µl total volume, containing 5 µl of [γ-32P]ATP [10 mCi/ml, 6000 Ci/mmol (1 Ci = 37 GBq); PerkinElmer]. The DNA concentrations were 4–20 nM. The labeling was carried out at 37°C for 90 min, followed by heat inactivation of the restriction enzymes and DNA kinase at 65°C for 20 min.
Ligation time course
The plasmid vectors remained in solution, along with the excised ∼200-bp fragments, during the subsequent labeling and the ligation time course. Leaving the vector DNA in the reaction mixture does not affect the ratio of circular monomers and dimeric forms of the insert formed at the early stage of ligation while greatly facilitating sample preparation. Ligation experiments were performed in 100–200-µl volumes, using T4 DNA ligase (NEB) and its standard ligation buffer at temperatures of 5, 22 and 42°C. The final concentrations of DNA substrates in ligation buffer were 0.25–2 nM, depending on the expected value of the j-factor. Each reaction was initiated by the addition of ligase diluted from stock with its standard buffer just before the ligation experiments. The concentration of DNA ligase in the reaction mixture was 5–40 NEB U/ml. Aliquots of the ligation mixtures were withdrawn at specific time intervals and quenched with EDTA at a 40-mM final concentration. Depending on the ligase concentration, the ligation time was between 1 and 40 min. Unincorporated [γ-32P]ATP from the ligation samples was removed with Performa Spin columns (Edgebio) before the gel electrophoresis.
Gel electrophoresis
Ligation products obtained of linear DNA fragments were separated on 2.4% MetaPhor agarose gel (Lonza) in TBE buffer (89 mM Tris–borate/2 mM EDTA, pH 8.3). Under continuous circulation of TBE electrophoresis buffer, the gels were run at room temperature at 5.5 V/cm, for 7 h. After electrophoresis, the gels were equilibrated in ethanol/glycerol solution, dried between cellophane sheets in a gel drying frame, and analyzed using a Storm PhosphorImager and ImageQuant software (Amersham Bioscience).
Equilibrium fractions of joined sticky ends
Linear fragments with different sticky ends and the marker (1 kb plus DNA ladder, Invitrogen) were radioactively labeled as described above. The 199-bp circles were obtained by ligation with T4 DNA Ligase (NEB) of 199-bp HindIII fragment at room temperature for 1 h. Gel electrophoresis was performed at 7.5 V/cm in TBE buffer containing 10 mM MgCl2 at 5°C for 2.5 h or at 22°C for 1.5 h using 4–12% gradient Novex polyacrylamide gels (Invitrogen). After electrophoresis, the gels were treated as described above.
Measurement and analysis of the equilibrium distribution of topoisomers
Obtaining mixtures of topoisomers with the equilibrium distribution of 
pUC19 DNA (NEB) was treated with Nt.BstNBI nicking endonuclease (NEB) to introduce single-stranded nicks. The nicking endonuclease was then inactivated at 65°C for 20 min. 5′-phosphates at the nicks were removed by Calf Intestinal Alkaline Phosphatase (NEB). Subsequently, dephosphorylated DNA was purified from phosphatase and salts using QIAGEN PCR purification kit. The samples were then labeled by T4 Polynucleotide Kinase (NEB) in a 12-µl total volume, containing 7 µl of [γ-32P]ATP [10 mCi/ml, 6000 Ci/mmol (1 Ci = 37 GBq); PerkinElmer]. Unincorporated [γ-32P]ATP was removed from the samples with Performa Spin columns (Edgebio) before the ligation and gel electrophoresis. The ligation of the nicks was performed by T4 DNA Ligase (NEB) at temperatures of 5, 25 and 42°C or by Taq Ligase (NEB) at temperatures of 25, 42 and 60°C, for 90 min.
Gel electrophoresis
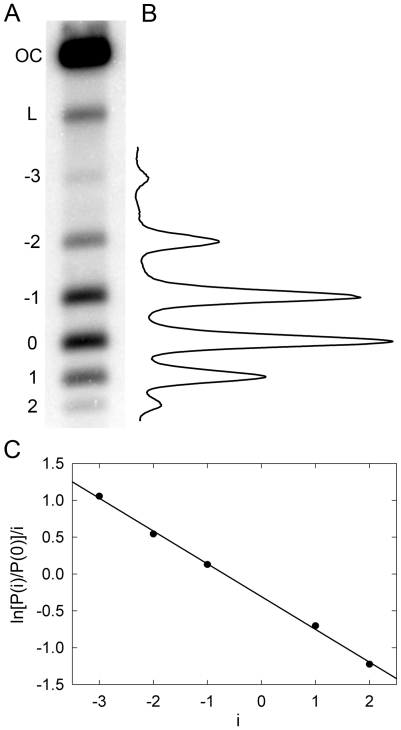
Topoisomers were separated on 1% SeaKem LE agarose gel (Lonza) in TBE buffer (89 mM Tris–borate/2 mM EDTA, pH 8.3). The gels were run at room temperature at 2.4 V/cm, for 18.5 h, under continuous circulation of TBE electrophoresis buffer. After electrophoresis, the gels were dried and quantified using a Storm PhosphorImager and ImageQuant software (Amersham Bioscience). To determine the variance of the topoisomer distribution,  , the topoisomers were numbered by assigning a value of zero to the most abundant one and the distribution was presented in the linearized form (Figure 4).
Figure 4.
Equilibrium distribution of DNA molecules over the linking number difference,  . To analyze the distribution, radioactively labeled DNA topoisomers were separated by agarose gel electrophoresis (A) and the gel was scanned by Phosphorimager (B). The symbols OC and L mark the bands of open circular and linear DNA molecules, correspondingly. (C) Linearized representation of the distribution. The slope of the line on the plot is specified by the distribution variance (see text for details).
Calculation of 
The value of  was calculated using the following interpolation equations describing the results of computer simulation:
 |
(2) |
where
 |
(3) |
In these equations, n is the number of Kuhn statistical segments ( , where L is the DNA contour length and a is the persistence length of the double helix), d is the effective diameter of the chain segments. These equations represent a slightly corrected version of the original equations obtained in reference (19). The correction is based on the much larger volume of the simulation performed in the current study by using the DNA model and the simulation method described in Supplementary Data and in reference (19).
RESULTS
Cyclization of short DNA fragments
Cyclization of short DNA fragments by DNA ligase has been widely used to study DNA conformational properties [see (5,20) for reviews]. Here, we will use a version of the method based on cyclization DNA fragments 200–350 bp in length, first suggested by Shore and Baldwin (15). This method provides an exceptionally accurate way to determine DNA persistence length (6,16,17,21). It is based on measuring the j-factors of DNA fragments and fitting the results to the theoretical equation relating j-factors to DNA persistence length (6,16,17,21). The following conditions, however, have to be satisfied in the method application (5,15,22). First, the equilibrium fraction of joined sticky ends of the fragments, which are substrates for DNA ligase, has to be small. Second, the ligase concentration has to be sufficiently low, so that the fragment sticky ends have to join each other and dissociate many times, on average, before the ligation event. In this case, the rate of ligation for each molecule is proportional to the total time when the sticky ends are joined, that is the equilibrium probability of conformations with joined ends. If this is true, the measured ratio of circles to dimers is independent of the ligase concentration (15). The latter condition can be used to determine permissible ligase concentrations.
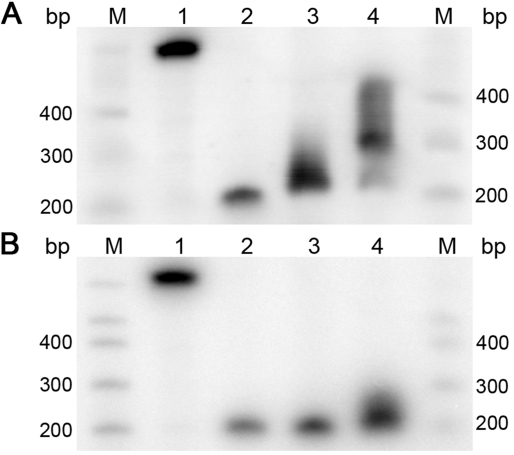
The equilibrium fraction of conformations with joined sticky ends, fc, depends on the sequence and length of the ends, as well as on DNA fragment length. In addition, for a given pair of sticky ends, the above conditions may be only satisfied for a limited range of temperatures. We tested if the condition is satisfied for DNA fragments and temperatures used in this study. To estimate the fraction of the fragment conformations with joined sticky ends, we analyzed fragment mobility using polyacrylamide gel electrophoresis. In such gels, the fragments in circular form move essentially slower than in linear form, allowing the estimation of fc from the average mobility of the fragment. The data for DNA fragments of 199 bp in length with different sticky ends are shown in Figure 1. The sequences of sticky ends correspond to the restriction sites of EcoRI (AATT), HindIII (AGCT) and AgeI (CCGG) endonucleases. Clearly, fc should increase with increasing GC-content of sticky ends, and this is exactly what one can observe in Figure 1. We see from the figure that only EcoRI sticky ends are suitable for the j-factor measurements at 5°C, while both EcoRI and HindIII sticky ends have sufficiently low fc at 25°C (and of course, at higher temperatures). However, the sticky ends created by AgeI endonuclease are not appropriate for either temperature.
Figure 1.
Equilibrium between circular and linear conformations of 199-bp DNA fragments with various sticky ends. The probability of finding a fragment in circular conformation, fc, can be estimated from its relative mobility in the polyacrylamide gel since the linear (lane M) and circular (lane 1) forms have different mobility in such a gel. The experiments were performed for sticky ends of 4 AT base pairs created by EcoRI restriction enzyme (lane 2), 2 AT and 2 GC base pairs created by HindIII (lane 3) and 4 GC base pairs created by AgeI (lane 4). The gel electrophoresis was run in TBE buffer containing additional 10 mM of MgCl2 at 5°C (A) and 25°C (B).
It is interesting that the bands corresponding to the fragments with AgeI sticky ends and with HindIII sticky ends at 5°C have increased width (Figure 1). It means that there is only limited averaging of fc over the electrophoresis time for individual DNA molecules due to slow exchange between circular and linear conformations. Such slow exchange can also affect the j-factor measurements if the ligation time course is short.
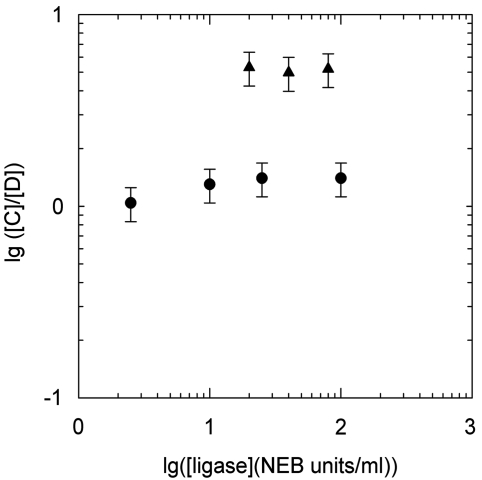
It has been shown that for ligation of 200-bp fragments with HindIII sticky ends at room temperature the ligase concentration should be smaller than 20 U/ml (in New England Biolabs, NEB, units) (22). We studied permissible ligase concentrations for EcoRI sticky ends at 5°C and for HindIII sticky ends at 42°C, used in the current study. The results presented in Figure 2 show that for both temperatures and sticky ends there are ligase concentrations that allow reliable measurements of the fragment j-factors.
Figure 2.
Dependence of the measured C/D on the concentration of T4 DNA ligase. The shown data correspond to the fragments with EcoRI (5°C, filled circle) and HindIII (42°C, filled triangle) sticky ends. The data show that the ratio does not change if the ligase concentration is below 100 U/ml.
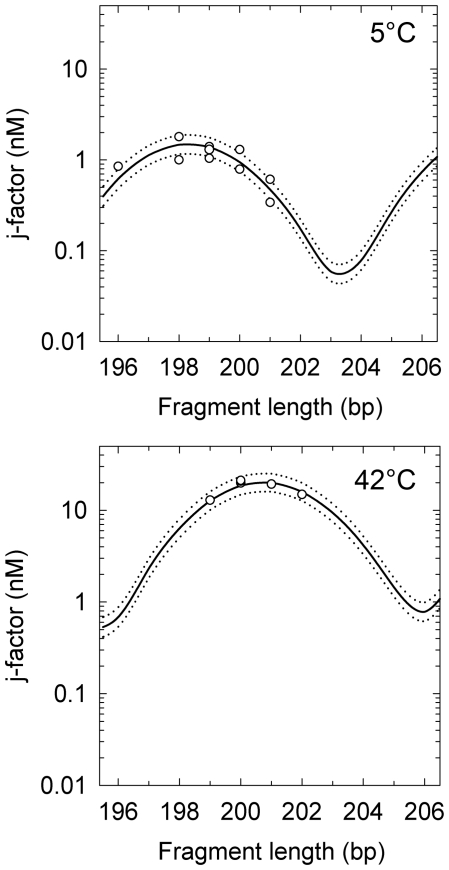
In accordance with the above tests we performed j-factor measurements for the DNA fragments of λ phage at 5 and 42°C, for EcoRI and HindIII sticky ends, respectively. The fragment was chosen because it does not contain any known intrinsically curved elements of the double helix (17). The procedure of the j-factor measurement is based on the measurement of relative amounts of circles and dimers formed during the ligation and has been described in detail earlier (6,17). The experimental data and their theoretical fit that allows determination of a are shown in Figure 3. These data show strong temperature dependence of DNA persistence length.
Figure 3.
The j-factor measured for λ phage DNA fragments with EcoRI sticky ends at 5°C (top) and HindIII sticky ends at 42°C (bottom). The lines correspond to the theoretical fit of the data. The best fit shown by the solid lines, correspond to DNA persistence length of 53.2 nm and γ of 10.43 for 5°C and 42.5 nm and γ of 10.56 for 42°C; the value of C was equal to 3.10−19 erg·cm for both temperatures. The dotted lines correspond to the theoretical equation with a reduced/increased by 1 nm from the best fits.
We were not able to perform the j-factor measurements for temperatures above 50°C where the ligase activity is too low to accumulate a sufficient amount of circles and dimers even for DNA fragments with AgeI sticky ends. Therefore, to proceed to higher temperatures we used a second approach which requires significantly less ligase activity.
Equilibrium distribution of topoisomers
In this second approach, we measured and analyzed the equilibrium distribution of topoisomers in circular DNA molecules. The distribution can be obtained by treating closed circular DNA molecules by a type IB DNA topoisomerase or by ligating either linear or nicked DNA (23,24). Using DNA ligase is preferred in our case since it excludes artifacts related to possible incomplete equilibration of the distribution by topoisomerases. It is also important for accurate quantitation of the topoisomer distribution to use radioactive labeling of DNA, rather than staining by a fluorescence dye. The latter method provides very limited linear dynamic range, insufficient for our goal. In our experiments, we nicked pUC19 plasmid DNA by a nicking endonuclease and end labeled the nicks by 32P. Then the nicks were ligated by DNA ligase at a chosen temperature. The result of one of such experiments is presented in Figure 4. In panel C of the figure, the distribution is plotted in a form that gives a linear presentation for the Gaussian distribution (23). For this form the slope of the straight line equals  , where
  is the variance of the topoisomer distribution. One can see from the panel that all points indeed lie on a straight line, in agreement with the previous data (23–25). We determined
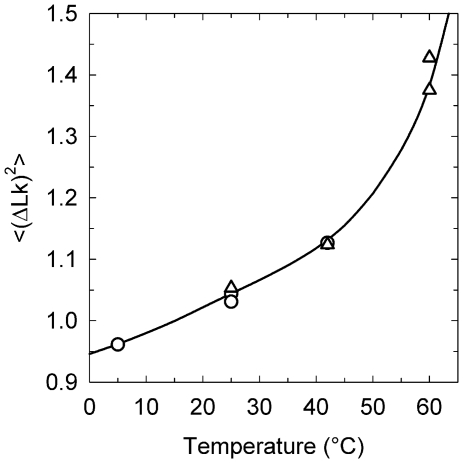
  at temperatures of 4, 25 and 42°C by using T4 DNA ligase and at temperatures of 25, 42 and 60°C using high-temperature Taq DNA ligase (Figure 5 and Table 1). The results show that the value of
  increases with temperature, corresponding to softening of the double helix.
Figure 5.
Temperature dependence of  . The distributions of the topoisomers were obtained by applying T4 DNA ligase (open circle) or Taq DNA ligase (open triangle) to nicked samples of pUC19 plasmid.
Table 1.
The values of a obtained from the analysis of the equilibrium topoisomer distributions
| Temperature (°C) | DNA persistence length, a | DNA ligase |
|---|---|---|
| 5 | 53.4 | T4 |
| 25 | 47.7 | T4 |
| 25 | 48.5 | Taq |
| 42 | 43.4 | T4 |
| 42 | 44.7 | Taq |
| 60 | 36.0 | Taq |
The last column of the table indicates the DNA ligase used in the experiment.
A few theoretical studies analyzed the equilibrium distribution of DNA topoisomers (18,19,26–31). All these studies assumed that the torsional and bending fluctuations in nicked DNA, which is subject to ligation, are independent, so
| (4) |
where  and
and  are the variances of twist, Tw and writhe, Wr, in nicked circular form of DNA. The value of
  is completely specified by the DNA torsional rigidity, C and temperature, T:
| (5) |
where N is the DNA length in bp, and l is the length of 1 bp (0.34 nm). The value of  can be obtained by computer simulation. A proper model for this kind of simulation is the discrete worm-like chain with a particular diameter d of the chain segments (19). Thus, the value of
  depends on two parameters of the DNA model, a and d, and, of course, on DNA length L. The computer simulation results are well described by the interpolation equations for
  (see ‘Material and Methods’ section). It should be noted that this theoretical description of
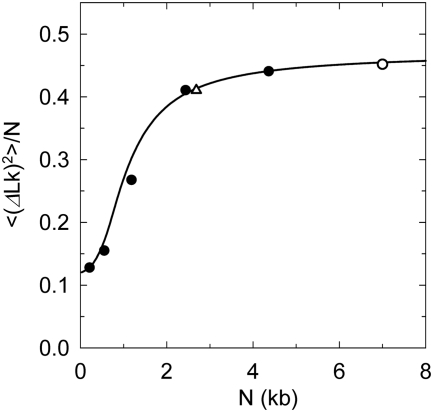
  is in very good agreement with the available experimental data (Figure 6). We used this description to analyze the values of
  presented in Figure 5.
Figure 6.
Comparison between theoretical and experimental values of the linking number variance,  . Experimental data (filled circle) for 37°C were taken from reference (25). The data from the current study (open triangle) and from reference (33) (open circle) were adjusted to 37°C according to the temperature dependence of
  presented in Figure 5. The line represents the best theoretical fit of the data. The shown curve corresponds to C of 3.1 × 10⁻¹⁹ erg ·cm, a of 45 nm and DNA effective diameter of 5 nm (33), in very good agreement with other available data.
Thus,  depends on a, C and d. Although the values of C and d should depend on temperature as well, there is no way to extract all the dependencies from the available data. Therefore, we neglected the temperature dependence of C and d and considered that only the DNA persistence length changes between 5°C and 60°C [The value of
  changed with temperature according to Equation (5)]. This approach is justified by the fact that dependence of
  on C and d is relatively weak comparing with the dependence on a. Thus, the value of C was equal to 3.1 × 10⁻¹⁹ erg·cm (19,25,32), and the value of d was equal to 5 nm, which corresponds to ionic conditions of the ligase buffer (33). The values of a obtained by this way are listed in Table 1.
DISCUSSION
The data on the temperature dependence of DNA persistence length obtained by the two methods used in this study are shown in Figure 7. First, we see the results obtained by two completely independent methods are in very good agreement. They both show that the temperature dependence of a is substantial. The value of a is changing from 53 nm at 5°C to 44 nm at 42°C, and the change can be well approximated by the linear dependence for this temperature interval. For higher temperatures the reduction of a accelerates, reaching 36 nm at 60°C. We do not think that this increase is related to transient kinks of the double helix, since the probability of kinks is very small at room temperature (34,35). Still, further study is needed to clarify this issue. As we expected, the obtained temperature dependence of a is substantially stronger than that predicted by Equation (1) under the assumption that DNA bending rigidity is temperature independent (Figure 7). There is an even larger difference between our results and the data of reference (12), also reproduced in Figure 7. Clearly, the temperature dependence of a has to be taken into account when the data obtained at different temperatures are compared.
The temperature dependence of DNA flexibility was also addressed by Forties et al. (13). The results obtained in this work, if converted into the temperature dependence of a, are in agreement with our data, although they cover relatively small interval of temperatures. The focus of that study, however, was the suggestion that transient openings (melting) of base pairs can contribute to enhanced flexibility of the double helix at higher temperatures. This idea originates from the theoretical study which analyzed possible effects of the base pair opening on the cyclization of short DNA fragments (36). However, the theoretical analysis of the base pair opening probability suggested in (36) and reproduced in (13) has an essential limitation. Opening of a single base pair is associated with the disruption of two stacking interactions between base pairs, one on the left from the opened base pair and another one on the right. The disruption of the second stacking was not taken into account in the analysis suggested in (36). Instead, the opening was analyzed similar to the opening of a base pair at the boundary of the melted and helical regions (or the helix end) where only one stacking is disrupted. The latter process has been extensively studied in the DNA melting experiments (see (37) for review). However, opening of isolated base pairs cannot be estimated from the studies of DNA melting, since such events make absolutely negligible contribution to the helix-coil transition. Rather reliable estimations of base pair opening probability have been derived from the hydrogen exchange experiments (38–40). According to these estimations the probability to find a chosen base pair in the opened state is between 10−7 and 10−5. Even these very low values of the probability should be considered as the upper limit, since they can be related to the flipping out of a single base of the pair, which does not result in a large increase of the double helix flexibility (35). A detailed theoretical analysis of the issue can be found in (41). Thus, the probability of base pair opening was exaggerated by a few orders of value in (13,36). It is easy to estimate that if the probability of base pair opening is smaller than 10−5, the opening cannot make a notable contribution to DNA flexibility at temperatures that are essentially below the DNA melting interval, covered in the current study.
One application of the obtained results is related to the free energy of DNA supercoiling,  . It was shown in the pioneering studies by Depew and Wang (23) and Pulleyblank et al. (24) that this energy can be presented as
| (6) |
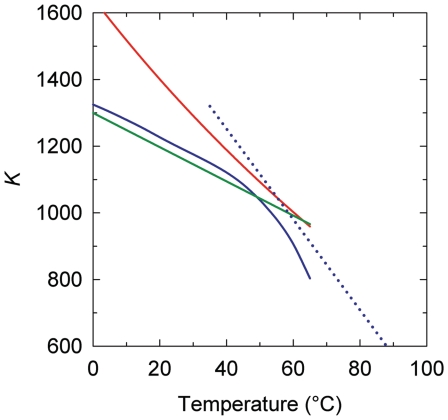
where K is a coefficient that does not depend on DNA length, N, if it exceeds 3000 bp. The value of K depends on temperature, however. This temperature dependence is important for our general understanding of DNA supercoiling and, in particular, for studying the base pair opening assisted by negative supercoiling. All earlier experimental studies of the temperature dependence showed that K is reducing with temperature increase (Figure 8). In the microcalorimetric study, Seidl and Hinz found a large positive value of ΔH for DNA supercoiling at 37°C (42). When they combined their result with the data from references (23,24) for  , they concluded that ΔS is also positive, thus the
  is reducing with temperature (42). We can see from Figure 8 that their result is in very good agreement with our data for temperature around 37°C. Bauer and Benham estimated temperature dependence of
  indirectly, from the analysis of early melting of supercoiled DNA (43). Although their data correspond to different ionic conditions, they are in reasonable agreement with our results for the temperature range between 30°C and 65°C (Figure 8), where the supercoiling-induced melting was observed. Duguet used the same approach as we did in the current study, although his data are less accurate since they are based on staining DNA in the gel rather than on radioactive labeling (44). Thus all available experimental data on the temperature dependence of the supercoiling free energy are in a reasonable agreement.
Figure 8.
The temperature dependence of supercoiling free energy,  . The shown data represent temperature dependence of K that specifies
  according to Equation (6). The lines correspond to the data obtained in the current study (blue solid line), references (42) (green line), (43) (red line) and (44) (dotted blue line).
The experimentally determined free energy of supercoiling, as a function of  , was also very well reproduced using computer simulation (45). This simulation showed, in agreement with a priori expectations, that supercoiling reduces the chain entropy. Initially, this finding was in apparent discrepancy with reference (42), which concluded that the supercoiling is associated with a positive change of entropy. The only way to resolve the controversy is to conclude that there is an entropic component in the free energy of DNA bending. We can estimate this entropic component from our data presented in Figure 7. To do so we calculated the temperature dependence of g using Equation (1). Over temperature interval between 5°C and 45°C, this dependence is well approximated by a linear function, so for this interval we can express g as a sum of enthalpy and entropy components:
| (7) |
The second term in this equation that corresponds to the entropy component of g is about 3 times smaller than the first term, corresponding to the enthalpy component.
Thus, the overall change of DNA entropy due to supercoiling has two components, the reduction of conformational entropy of the chain predicted in the simulation (45) and the entropy increase from the DNA bending in supercoiled conformations. Our current study shows that if we take the temperature dependence of a as an input for the computation, the simulated temperature dependence of  is in very good agreement with the measurement. This confirms that the simulation of
  is quite accurate, and that the temperature dependence of
  is mainly due to the temperature dependence of DNA persistence length. Thus, the results obtained in this study may have eliminated the last controversy between the simulated and experimentally measured large-scale conformational properties of the double helix.
SUPPLEMENTARY DATA
Supplementary Data are available at NAR Online.
FUNDING
This work was supported by the National Institutes of Health (GM54215 to A.V.). Funding for open access charge: National Institutes of Health (GM54215 to A.V.).
Conflict of interest statement. None declared.
REFERENCES
- 1.Bustamante C., Bryant Z., Smith S.B. Ten years of tension: single-molecule DNA mechanics. Nature. 2003;421:423–427. doi: 10.1038/nature01405. [DOI] [PubMed] [Google Scholar]
- 2.Allemand J.F., Bensimon D., Croquette V. Stretching DNA and RNA to probe their interactions with proteins. Curr. Opin. Struct. Biol. 2003;13:266–274. doi: 10.1016/s0959-440x(03)00067-8. [DOI] [PubMed] [Google Scholar]
- 3.Chaurasiya K.R., Paramanathan T., McCauley M.J., Williams M.C. Biophysical characterization of DNA binding from single molecule force measurements. Phys. Life Rev. 2010;7:299–341. doi: 10.1016/j.plrev.2010.06.001. [DOI] [PMC free article] [PubMed] [Google Scholar]
- 4.Hagerman P.J. Flexibility of DNA. Ann. Rev. Biophys. Biophys. Chem. 1988;17:265–286. doi: 10.1146/annurev.bb.17.060188.001405. [DOI] [PubMed] [Google Scholar]
- 5.Peters J.P., Maher L.J., III DNA curvature and flexibility in vitro and vivo. Q. Rev. Biophys. 2010;43:1–41. doi: 10.1017/S0033583510000077. [DOI] [PMC free article] [PubMed] [Google Scholar]
- 6.Geggier S., Vologodskii A. Sequence dependence of DNA bending rigidity. Proc. Natl Acad. Sci. USA. 2010;107:15421–15426. doi: 10.1073/pnas.1004809107. [DOI] [PMC free article] [PubMed] [Google Scholar]
- 7.Bresler S.E., Frenkel Y.I. The character of thermal motion of long organic chains with reference to the elastic properties of rubber. Zh. Eksp. Teor. Fiz. 1939;9:1094–1106. [Google Scholar]
- 8.Landau L., Lifshitz E. Statistical Physics. Oxford: Elsevier; 1951. [Google Scholar]
- 9.Schellman J.A. Flexibility of DNA. Biopolymers. 1974;13:217–226. doi: 10.1002/bip.1974.360130115. [DOI] [PubMed] [Google Scholar]
- 10.Marmur J., Doty P. Heterogeneity in deoxyribonucleic acids: I. Dependence on composition of the configurational stability of deoxyribonucleic acids. Nature. 1959;183:1427–1429. doi: 10.1038/1831427a0. [DOI] [PubMed] [Google Scholar]
- 11.Marmur J., Doty P. Determination of the base composition of deoxyribonucleic acid from its thermal denaturation temperature. J. Mol. Biol. 1962;5:109–118. doi: 10.1016/s0022-2836(62)80066-7. [DOI] [PubMed] [Google Scholar]
- 12.Gray H.B., Jr, Hearst J.E. Flexibility of native DNA from the sedimentation behavior as a function of molecular weight and temperature. J. Mol. Biol. 1968;35:111–129. doi: 10.1016/s0022-2836(68)80041-5. [DOI] [PubMed] [Google Scholar]
- 13.Forties R., Bundschuh R., Poirier M. The flexibility of locally melted DNA. Nucl. Acids Res. 2009;37:4580–4586. doi: 10.1093/nar/gkp442. [DOI] [PMC free article] [PubMed] [Google Scholar]
- 14.Shore D., Langowski J., Baldwin R.L. DNA flexibility studied by covalent closure of short fragments into circles. Proc. Natl Acad. Sci. USA. 1981;78:4833–4837. doi: 10.1073/pnas.78.8.4833. [DOI] [PMC free article] [PubMed] [Google Scholar]
- 15.Shore D., Baldwin R.L. Energetics of DNA twisting. I. Relation between twist and cyclization probability. J. Mol. Biol. 1983;170:957–981. doi: 10.1016/s0022-2836(83)80198-3. [DOI] [PubMed] [Google Scholar]
- 16.Taylor W.H., Hagerman P.J. Application of the method of phage T4 DNA ligase-catalyzed ring-closure to the study of DNA structure. II. NaCl-dependence of DNA flexibility and helical repeat. J. Mol. Biol. 1990;212:363–376. doi: 10.1016/0022-2836(90)90131-5. [DOI] [PubMed] [Google Scholar]
- 17.Vologodskaia M., Vologodskii A. Contribution of the intrinsic curvature to measured DNA persistence length. J. Mol. Biol. 2002;317:205–213. doi: 10.1006/jmbi.2001.5366. [DOI] [PubMed] [Google Scholar]
- 18.Vologodskii A.V., Anshelevich V.V., Lukashin A.V., Frank-Kamenetskii M.D. Statistical mechanics of supercoils and the torsional stiffness of the DNA. Nature. 1979;280:294–298. doi: 10.1038/280294a0. [DOI] [PubMed] [Google Scholar]
- 19.Klenin K.V., Vologodskii A.V., Anshelevich V.V., Klisko V.Y., Dykhne A.M., Frank-Kamenetskii M.D. Variance of writhe for wormlike DNA rings with excluded volume. J. Biomol. Struct. Dyn. 1989;6:707–714. doi: 10.1080/07391102.1989.10507731. [DOI] [PubMed] [Google Scholar]
- 20.Crothers D.M., Drak J., Kahn J.D., Levene S.D. DNA bending, flexibility, and helical repeat by cyclization kinetics. Meth. Enzymol. 1992;212:3–29. doi: 10.1016/0076-6879(92)12003-9. [DOI] [PubMed] [Google Scholar]
- 21.Shimada J., Yamakawa H. Ring-closure probabilities for twisted wormlike chains. Application to DNA. Macromolecules. 1984;17:689–698. [Google Scholar]
- 22.Du Q., Smith C., Shiffeldrim N., Vologodskaia M., Vologodskii A. Cyclization of short DNA fragments and bending fluctuations of the double helix. Proc. Natl Acad. Sci. USA. 2005;102:5397–5402. doi: 10.1073/pnas.0500983102. [DOI] [PMC free article] [PubMed] [Google Scholar]
- 23.Depew R.E., Wang J.C. Conformational fluctuations of DNA helix. Proc. Natl Acad. Sci. USA. 1975;72:4275–4279. doi: 10.1073/pnas.72.11.4275. [DOI] [PMC free article] [PubMed] [Google Scholar]
- 24.Pulleyblank D.E., Shure M., Tang D., Vinograd J., Vosberg H.P. Action of nicking-closing enzyme on supercoiled and nonsupercoiled closed circular DNA: formation of a Boltzmann distribution of topological isomers. Proc. Natl Acad. Sci. USA. 1975;72:4280–4284. doi: 10.1073/pnas.72.11.4280. [DOI] [PMC free article] [PubMed] [Google Scholar]
- 25.Horowitz D.S., Wang J.C. Torsional rigidity of DNA and length dependence of the free energy of DNA supercoiling. J. Mol. Biol. 1984;173:75–91. doi: 10.1016/0022-2836(84)90404-2. [DOI] [PubMed] [Google Scholar]
- 26.Benham C.J. The statistics of superhelicity. J. Mol. Biol. 1978;123:361–370. doi: 10.1016/0022-2836(78)90084-0. [DOI] [PubMed] [Google Scholar]
- 27.Le Bret M. Monte Carlo computation of supercoiling energy, the sedimentation constant, and the radius of gyration of unknotted and knotted circular DNA. Biopolymers. 1980;19:619–637. doi: 10.1002/bip.1980.360190312. [DOI] [PubMed] [Google Scholar]
- 28.Frank-Kamenetskii M.D., Lukashin A.V., Anshelevich V.V., Vologodskii A.V. Torsional and bending rigidity of the double helix from data on small DNA rings. J. Biomol. Struct. Dyn. 1985;2:1005–1012. doi: 10.1080/07391102.1985.10507616. [DOI] [PubMed] [Google Scholar]
- 29.Levene S.D., Crothers D.M. Topological distributions and the torsional rigidity of DNA. A Monte Carlo study of DNA circles. J. Mol. Biol. 1986;189:73–83. doi: 10.1016/0022-2836(86)90382-7. [DOI] [PubMed] [Google Scholar]
- 30.Shimada J., Yamakawa H. Statistical mechanics of DNA topoisomers: the helical worm-like chain. J. Mol. Biol. 1985;184:319–329. doi: 10.1016/0022-2836(85)90383-3. [DOI] [PubMed] [Google Scholar]
- 31.Shimada J., Yamakawa H. Moments for DNA topoisomers: the helical wormlike chain. Biopolymers. 1988;27:657–673. doi: 10.1002/bip.360270409. [DOI] [PubMed] [Google Scholar]
- 32.Shore D., Baldwin R.L. Energetics of DNA twisting. II. Topoisomer analysis. J. Mol. Biol. 1983;170:983–1007. doi: 10.1016/s0022-2836(83)80199-5. [DOI] [PubMed] [Google Scholar]
- 33.Rybenkov V.V., Vologodskii A.V., Cozzarelli N.R. The effect of ionic conditions on DNA helical repeat, effective diameter, and free energy of supercoiling. Nucleic Acids Res. 1997;25:1412–1418. doi: 10.1093/nar/25.7.1412. [DOI] [PMC free article] [PubMed] [Google Scholar]
- 34.Du Q., Kotlyar A., Vologodskii A. Kinking the double helix by bending deformation. Nucleic Acids Res. 2008;36:1120–1128. doi: 10.1093/nar/gkm1125. [DOI] [PMC free article] [PubMed] [Google Scholar]
- 35.Zheng X., Vologodskii A. Theoretical analysis of disruptions in DNA minicircles. Biophys. J. 2009;96:1341–1349. doi: 10.1016/j.bpj.2008.11.013. [DOI] [PMC free article] [PubMed] [Google Scholar]
- 36.Yan J., Marko J.F. Localized single-stranded bubble mechanism for cyclization of short double helix DNA. Phys. Rev. Lett. 2004;93:108108. doi: 10.1103/PhysRevLett.93.108108. [DOI] [PubMed] [Google Scholar]
- 37.SantaLucia J. A unified view of polymer, dumbbell, and oligonucleotide DNA nearest-neighbor thermodynamics. Proc. Natl Acad. Sci. USA. 1998;95:1460–1465. doi: 10.1073/pnas.95.4.1460. [DOI] [PMC free article] [PubMed] [Google Scholar]
- 38.Kochoyan M., Leroy J.L., Gueron M. Proton exchange and base-pair lifetimes in a deoxy-duplex containing a purine-pyrimidine step and in the duplex of inverse sequence. J. Mol. Biol. 1987;196:599–609. doi: 10.1016/0022-2836(87)90036-2. [DOI] [PubMed] [Google Scholar]
- 39.Leroy J.L., Kochoyan M., Huynh-Dinh T., Gueron M. Characterization of base-pair opening in deoxynucleotide duplexes using catalyzed exchange of the imino proton. J. Mol. Biol. 1988;200:223–238. doi: 10.1016/0022-2836(88)90236-7. [DOI] [PubMed] [Google Scholar]
- 40.Coman D., Russu I.M. A nuclear magnetic resonance investigation of the energetics of basepair opening pathways in DNA. Biophys. J. 2005;89:3285–3292. doi: 10.1529/biophysj.105.065763. [DOI] [PMC free article] [PubMed] [Google Scholar]
- 41.Krueger A., Protozanova E., Frank-Kamenetskii M.D. Sequence-dependent base pair opening in DNA double helix. Biophys. J. 2006;90:3091–3099. doi: 10.1529/biophysj.105.078774. [DOI] [PMC free article] [PubMed] [Google Scholar]
- 42.Seidl A., Hinz H.-J. The free energy of DNA supercoiling is enthalpy-determined. Proc. Natl Acad. Sci. USA. 1984;81:1312–1316. doi: 10.1073/pnas.81.5.1312. [DOI] [PMC free article] [PubMed] [Google Scholar]
- 43.Bauer W.R., Benham C.J. The free energy, enthalpy and entropy of native and of partially denatured closed circular DNA. J. Mol. Biol. 1993;234:1184–1196. doi: 10.1006/jmbi.1993.1669. [DOI] [PubMed] [Google Scholar]
- 44.Duguet M. The helical repeat of DNA at high temperature. Nucleic Acids Res. 1993;21:463–468. doi: 10.1093/nar/21.3.463. [DOI] [PMC free article] [PubMed] [Google Scholar]
- 45.Vologodskii A.V., Levene S.D., Klenin K.V., Frank-Kamenetskii M.D., Cozzarelli N.R. Conformational and thermodynamic properties of supercoiled DNA. J. Mol. Biol. 1992;227:1224–1243. doi: 10.1016/0022-2836(92)90533-p. [DOI] [PubMed] [Google Scholar]
Associated Data
This section collects any data citations, data availability statements, or supplementary materials included in this article.


