

Abstract
Visual attention improves perception for an attended location or feature and also modulates the responses of sensory neurons. In laboratory studies, the sensory stimuli and task instructions are held constant within an attentional condition, but despite experimenters' best efforts, attention likely varies from moment to moment. Because most previous studies have focused on single neurons, it has been impossible to use neuronal responses to identify attentional fluctuations and determine whether these are associated with changes in behavior. We show that an instantaneous measure of attention based on the responses of a modest number of neurons in area V4 of the rhesus monkey (Macaca mulatta) can reliably predict large changes in an animal's ability to perform a difficult psychophysical task. Unexpectedly, this measure shows that the amount of attention allocated at any moment to locations in opposite hemifields is uncorrelated, suggesting that animals allocate attention to each stimulus independently rather than moving their attentional focus from one location to another.
Introduction
The effects of cognitive processes on sensory representations are typically studied by comparing psychophysical performance or neural responses between sets of trials that differ only in their instructions to the subject. Visual attention affects both behavior and neural responses: when a subject directs attention to an area of space, perception at that location is greatly improved compared to blocks of trials when attention is directed elsewhere. Attention also modulates the responses of sensory neurons, typically by increasing responses to attended stimuli (Assad, 2003; Yantis and Serences, 2003; Reynolds and Chelazzi, 2004; Maunsell and Treue, 2006).
Analyses that compare either mean perceptual performance or mean neuronal responses between behavioral conditions implicitly assume that subjects follow task instructions consistently, making every trial within a task condition identical. Despite experimenters' best efforts, however, a subject's attentional state is likely to vary, even within an attentional condition. These uncontrolled fluctuations in attention could have important consequences for both perception and neuronal responses, and understanding the effects of these fluctuations is critical for our understanding of how attentional modulation of sensory responses leads to perceptual improvement.
Measuring uncued fluctuations in attention requires an estimate of a subject's attentional state on each trial, which has been impractical using either behavioral or neuronal responses. Most experiments measure behavioral performance as an average over many trials. A single trial typically yields a single behavioral response, which is not readily decomposed into contributions from attentional state and behavioral capacity. Obtaining single trial estimates of attention from the firing of sensory neurons has not been approachable, because most electrophysiological studies have recorded a single neuron at a time. While many previous studies have shown a relationship between the responses of single neurons and behavior (e.g., choice probability), those correlations are typically weak (Parker and Newsome, 1998). A neuron's response on a single trial therefore cannot provide useful information about an animal's behavioral state. Consequently, while previous studies have examined the relationship between neuronal responses on individual trials and different behavioral outcomes, they have not attempted to assess attentional fluctuations on specific trials within a behavioral condition.
We found that basing a single trial measure of attention on a few dozen simultaneously recorded neurons gave us the power to accurately predict behavior. We showed that within a behavioral condition, attention varies greatly from trial to trial, and these fluctuations caused the monkey's ability to detect a given small change in a stimulus to vary from ∼70% correct to nearly complete failure. Unexpectedly, this measure revealed that within a behavioral condition, the amount of attention allocated to two locations in opposite hemifields was uncorrelated, suggesting that uncontrolled fluctuations in attention may result from fluctuations in local groups of neurons rather than from a global control signal.
Materials and Methods
Subjects and electrophysiological recordings.
We recorded simultaneously from dozens of neurons in both hemispheres of V4 in two rhesus monkeys (Macaca mulatta, both adult males, 9 and 12 kg) while they performed a change–detection task in which we directed their attention to one of two flashing stimuli. All procedures were approved by the Institutional Animal Care and Use Committee of Harvard Medical School (Boston, MA). Before behavioral training, each animal was implanted with a head post and a scleral search coil for monitoring eye movements. After the animal learned the behavioral task (3–4 months), we implanted a 6 × 8 array of microelectrodes (Blackrock Microsystems) in V4 in each cerebral hemisphere (96 electrodes per animal). Each electrode was 1 mm long, and the distance between adjacent electrodes was 400 μm. The two arrays were connected to a percutaneous connector that allowed simultaneous recordings from all 96 electrodes.
We implanted the arrays between the lunate and superior temporal sulci, which were visible during surgery. The centers of the spatial receptive fields (RFs) for both monkeys were in the lower hemifield (eccentricities for monkey 1: left hemifield: 3–5°, right hemifield: 5–8°; monkey 2: left hemifield: 10–15°, right hemifield: 15–30°). Monkey 2 underwent an unscheduled explantation of both arrays before recordings began, so we implanted new arrays several millimeters dorsal to the sites of the original implants. Consequently, monkey 2 had more eccentric and more dispersed receptive fields than monkey 1. The receptive field distributions were the only physiological results that were distinguishable between the two monkeys.
The data presented here are a superset of data presented previously (Cohen and Maunsell, 2009). For the current study, it was important to have a range of behavioral performance. Therefore, in addition to data from 41 d of recording reported previously, we included eight additional datasets in which the monkey did not achieve 90% correct on the easiest orientation change (total 26 datasets from monkey 1 and 23 datasets from monkey 2).
We recorded from a total 461 single neurons (235 from monkey 1 and 226 from monkey 2) and 4413 multiunits (1721 from monkey 1 and 2692 from monkey 2) over 49 d of recording. All spike sorting was done manually offline using spike-sorting software (Plexon). Previously, we found that the physiological effects of attention in single units were indistinguishable from those in multiunits (Cohen and Maunsell, 2009), and the population analyses presented here required large populations of neurons recorded simultaneously; thus, all analyses include both single units and multiunits. On average, we recorded 46 single and multiunits per hemisphere each day (range 14–74). The chronic recordings provide stable recordings over long periods, so we almost certainly recorded from some of the same neurons on multiple days (Dickey et al., 2009). For this reason, all of the key statistical comparisons are made within a recording session, and we controlled for potentially nonindependent measurements in the across-day analyses (see Fig. 1D,E).
Figure 1.

Over the course of a day, average attentional modulation of V4 neurons correlates with average improvement in behavior. A, Schematic of orientation change detection task. Two Gabor stimuli synchronously flashed on for 200 ms and off for a randomized 200–400 ms period. At an unsignaled time, the orientation of one of the stimuli changed and the monkey was rewarded for making a saccade to the stimulus that changed. Attention was cued in blocks, and the cue was valid on 80% of trials, meaning that on an “attend-left” block of trials (depicted here), 80% of orientation changes were to the left stimulus. The monkey was rewarded for correctly detecting any change, even on the unattended side. Unless otherwise stated, all analyses were performed on responses to the stimulus before the orientation change (black outlined panel). B, Psychometric performance from a typical example experiment on trials when the change occurred in the left stimulus (left) or right stimulus (right). Proportion correct is plotted as a function of orientation change in degrees (deg) for trials in which the change occurred at the attended (filled circles) or unattended (open circles) location. Unattended changes occurred only at the middle difficulty level. Error bars represent 95% confidence intervals (binomial statistics). Behavioral improvement was quantified as the lateral shift in degrees between the measured performance when the change occurred at the unattended location and the Weibull fit of performance at the attended location. C, Frequency histograms of attentional modulation indices of neurons from the example dataset whose receptive fields overlapped the left stimulus (left plot) or the right stimulus (right). Attentional modulation index was defined as the difference between the average response to the stimulus before correct detections at the attended location and the unattended location, divided by the sum. D, Average attentional modulation index as a function of behavioral shift (in degrees) for all 98 hemisphere days for each monkey (M1 and M2, circles and crosses, respectively) and receptive field location (gray, left; black, right). E, Correlation coefficients between attentional modulation indices for two randomly selected groups of neurons within a hemisphere (black bar), the full groups of neurons recorded in opposite hemispheres (white bar), and behavioral shift in the two hemifields (gray bar).
Behavioral task and visual stimuli.
The monkeys performed an orientation change detection task depicted in Figure 1A. A trial began when the monkey fixated a small white spot within a 1.5° square fixation window in the center of a video display (85 Hz frame rate, 1024 × 768 pixels, gamma-corrected). Two achromatic, 100% contrast, odd-symmetric Gabor stimuli, whose size, location, spatial frequency, and orientation were optimized for one single unit in each hemisphere (new units and stimuli each day), flashed on for 200 ms and off for a randomized period (200–400 ms picked from a uniform distribution between each stimulus presentation). In one unsignaled presentation, the orientation of one of the stimuli was different from that of preceding stimuli, and the monkey was given a liquid reward for making a saccade to the stimulus that changed within 100–500 ms of its appearance. To encourage the monkey to maintain attention throughout the trial and to discourage guessing, the time of the orientation change was drawn from an exponential distribution (minimum, 1000 ms; mean, 3000 ms; maximum, 5000 ms). If no orientation change occurred within 5000 ms, the monkey was rewarded for simply maintaining fixation, and the trial was excluded from analysis. We found no dependence of behavioral performance on trial length.
Because we observed some adaptation of neuronal responses between the first and second stimulus presentations, the changed stimulus never occurred before the third stimulus presentation. The mean neuronal response was not significantly correlated with stimulus presentation number for the second through last stimuli (p = 0.21), and neuronal responses to the second stimulus and the stimulus immediately preceding the changed stimulus were not significantly different (paired t test on all 4874 single and multiunits, p = 0.13).
We manipulated attention in blocks of trials by including 10 instruction trials before the start of each block. Instruction trials (which were not analyzed) consisted of a single flashing Gabor stimulus. The stimulus that appeared in the instruction trials was the one that changed orientation in 80% of trials in the upcoming block. To obtain reliable neuronal and psychometric data at the orientation changes of interest and also to keep the monkey's reward rate sufficiently high, we used an unequal number of trials at each difficulty level. Of 125 trials per block, 100 contained changes in the cued stimulus. The block also contained 25 changes in the uncued stimulus, which were all an orientation change of a particular size. Within each block, the trial types were randomly interleaved. Only one stimulus change occurred in each trial, and the monkey was rewarded for correctly detecting a change in either stimulus regardless of cued location. Each analyzed dataset comprised at least four blocks of trials in each attention condition (at least 1000 trials).
Importantly, the pair of stimuli presented immediately before the orientation change was the same on every trial throughout an experimental session, regardless of attentional location or the size of the eventual orientation change. We were interested in a measure of attention on individual trials that was independent of the visual stimulus or motor plan. We therefore focused most analyses on the stimulus presentation immediately before the orientation change because the stimuli were the same at this point on every trial and because the monkey's attentional state at this time was likely to affect his ability to detect the upcoming change.
Analysis of psychophysical data.
We defined percentage correct as the number of correct detections divided by the number of correct detections plus the number of missed changes. We fit behavioral data for stimulus changes in the attended location (see Fig. 1) using a Weibull function,
 |
where p is the proportion of correct responses and c is the orientation change in degrees. The parameter α represents the orientation change at which performance is 63% correct, and the parameter β controls the slope of the curve. We did not analyze false alarms (eye movements to one of the stimuli before an orientation change occurred) or trials in which the monkey broke fixation by making an eye movement to a location other than one of our two stimuli. False alarms occurred on 4% of trials, and fixation breaks occurred on 5% of trials.
Attention is thought to primarily shift psychometric curves laterally (Lu and Dosher, 1998; Lee et al., 1999; Carrasco et al., 2000; Cameron et al., 2002), meaning that attending to a stimulus in this task can be considered to have a behavioral effect that is equivalent to increasing the size of the orientation change (and thereby making the task easier). We quantified the behavioral improvement caused by attention (Fig. 1) by finding the point along the fitted Weibull function at which performance matched the observed performance for orientation changes on the uncued side (Fig. 1B, open symbols) and subtracting that orientation from the size of the orientation change that was used on invalid trials. Shifts were therefore positive when attention improved performance.
Trial types and time period used to calculate neural responses.
Most analyses were based on responses to the stimulus before the orientation change because the stimuli were identical at that point on every trial (see Fig. 1A). For each single or multiunit we extracted spike counts from the period between 60 and 260 ms after stimulus onset, which allowed for the latency of visual responses in area V4. Some of the control analyses regarding a putative decision or stimulus selectivity axis (see Figs. 4, 5) were based on axes calculated using responses to the changed stimulus. For these responses, we computed firing rates from spikes that occurred from 60 to 260 ms after that stimulus onset or until 60 ms before the saccade, when that came before 260 ms (which was the case for 62% of trials). We also tried the same analyses using only the period from 60 to 160 ms after stimulus onset for all trials, and this did not qualitatively affect the results. Responses for the fixation period (see Fig. 4A) are based on spikes from 60 to 260 ms following the onset of fixation at the beginning of the trial.
Figure 4.
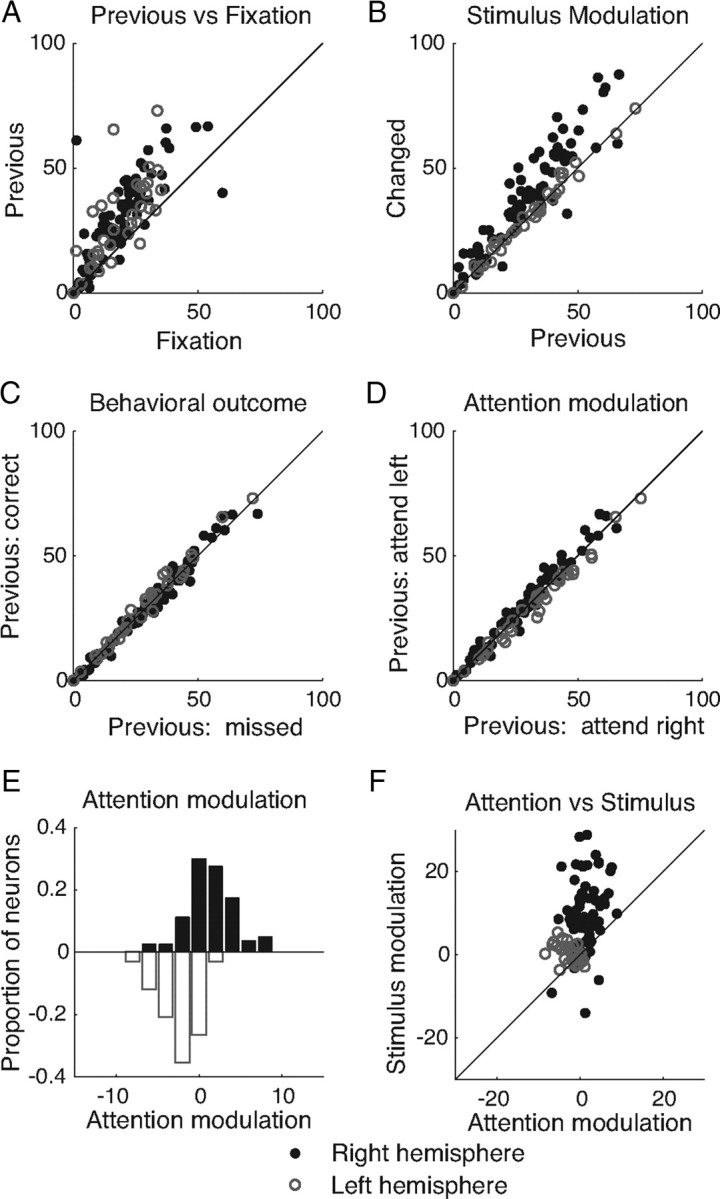
Modulation of the mean responses of individual neurons. A, Mean responses (in sp/s) of all simultaneously recorded neurons from an example dataset on trials in which a 4.7° change occurred in the stimulus in the left hemifield (validly cued trials only) during the stimulus immediately preceding the change (previous) as function of responses during the initial fixation period at the start of the trial (fixation). The responses of neurons in the left hemisphere (whose receptive fields do not overlap the attended stimulus) are represented with open circles, and responses of neurons in the right hemispheres are represented with filled circles. B, Mean responses to the changed stimulus as a function of responses to the previous stimulus. Trials and conventions are as in A. C, Responses to the previous stimulus as a function of behavioral outcome. Trials and conventions are as in A. D, Mean responses to the previous stimulus as a function of attention condition. The x-axis is as in B. The y-axis represents mean responses on trials with a 4.7° change in the right hemisphere (validly cued trials only). Plotting conventions are as in A. E, Frequency histogram of attention modulation (mean response to the previous stimulus on attend left minus attend right trials) for neurons in the right (top) and left (bottom) hemispheres. This mean attention modulation is used to construct the attention axis. F, Stimulus modulation (mean response to the changed minus the previous stimulus) as a function of attention modulation (same x-axis as in E).
Figure 5.

Variability in attention, not bottom-up responses, is correlated with behavior. A, Average projection of population responses to the stimulus preceding a missed orientation change in the left hemifield for subpopulations of neurons whose attentional indices and stimulus tuning indices are of the opposite sign. The mean of the distribution is shifted toward the mean of the opposite attentional condition, suggesting that missed changes result from improperly allocated attention (see Results). Conventions are as in Figure 2, D and E. B, Same as A for changes in the right hemifield.
The analyses of the effect of attention on behavior on single trials and the modulation of single neurons (see Figs. 2–6) were based on trials with a given orientation change for which psychophysical performance was in a range where attention can have a large effect on performance. Attention has the largest effect on the monkey's ability to detect near-threshold stimuli; stimuli that are far below the psychophysical threshold are undetected regardless of attentional state, and stimuli that are far above threshold are always detected. Our analyses are restricted to trials of a given difficult orientation change. Our goal was to select this change such that average performance was close to 50% correct (the actual percentage correct was 38% across all datasets). For this orientation change, the attentional cue was always valid, meaning that the orientation change always occurred at the attended stimulus. These trials comprised 16% of the total trials and were randomly interleaved with other orientation changes and invalid attentional cues.
Figure 2.

A single trial measure of attention based on population responses accurately predicts behavior. A, Procedure for calculating attentional allocation on a single trial. Analysis was restricted to a single difficult orientation change (4.7°) for which attentional cues were always valid. For each trial, the number of spikes fired by n simultaneously recorded neurons during the stimulus before an orientation change in the left hemifield (open circles) and right hemifield (filled circles) is plotted as a point in an n-dimensional space (a two-neuron example showing unusually large attention effects is plotted here). The attention axis (black line) is the line connecting the center of mass of the n-dimensional cloud of points for correct trials at each attention/change location (Xs). Each point (including missed trials) is projected onto the axis. The projections are scaled for each dataset so that a projection of −1 is equal to the mean response before correct left hemifield detections (left X), and +1 is the mean before correct right hemifield detections (right X). B, Frequency histogram of population projections on trials with left changes for the same example day before correct detections (upward bars) and missed changes (downward bars). Because of the way we normalized the distributions, the mean of the correct distribution is by definition −1. The mean of the missed distribution is shifted toward the mean of the opposite attentional location. C, Same as B, for changes in the right hemifield. D, Frequency histogram of average projection on missed changes in the left hemifield over all 49 d of data. Shaded bars indicate datasets for which the distribution of misses was shifted significantly toward the mean of the opposite attentional condition (t test, p < 0.05). E, Same as D, for right hemifield changes. F, Proportion correct detections as a function of population projection. For large negative projections, the proportion correct is high on left changes (dashed line) and low on right changes (solid line). For large positive projections, percentage correct is high on right changes and low on left changes. Error bars represent SEM. Points are plotted for bins that had ≥20 trials. G, Reaction time as a function of population projection. For large negative projections, reaction time is fast for left changes (dashed line) and slow for right changes (solid line). Conventions are as in F.
Figure 3.

Moderate neuronal populations are necessary for precise estimates of attention. A, Mean firing rate responses to the stimulus before the orientation change for each individual neuron (single and multiunits) in each combination of attentional condition and behavioral outcome. Error bars represent average SD of firing rates for individual neurons. The variability of individual neurons makes it impractical to use their responses to reliably predict attentional state and behavioral outcome on individual trials. B, Population DPAA as a function of the number of neurons used to calculate population projections. The point at the right represents mean population DPAA using projections based on all simultaneously recorded neurons for each dataset (mean, 79 neurons). C, Standard deviation of the distribution of population projections as a function of the number of neurons used to calculate the projection. At asymptote, this measure represents actual variability in attention rather than measurement noise. The gray line represents the theoretical asymptote (using the procedure depicted in D). Axes are plotted on a log scale to illustrate the dramatic reduction in SD that comes from adding even a few neurons to small population sizes (left side of the plot). Other conventions are as in B. D, Procedure for determining the amount of variability along the attention axis that could be caused by measurement noise. To test the hypothesis that all of the observed variance in the distribution of projections along the attention axis is caused by measurement noise, we assumed that attentional state is binary and that performance is at a fixed level for a given attentional state (a step function, dashed line). We fit the function relating proportion correct to attention axis projection with a cumulative Gaussian with fitted bounds (solid line; mean 0.45, SD 0.47, lower bound 0.07, upper bound 0.70). This fitted Gaussian (dotted line; height of the Gaussian is arbitrary) places an upper bound on the amount of variance that can be caused by measurement noise (fitted variance = 0.22), leaving a minimum variance of 0.59 (SD = 0.77) to be explained by true variability along the attention axis. This theoretical asymptote of variance in attentional state that cannot be explained by measurement noise is the gray line plotted in C.
Figure 6.

Fluctuations in attention allocated to the two hemispheres are independent. Correlation coefficient between population projections of randomly chosen subsets of neurons within a hemisphere (black bars) and all neurons across hemispheres (white bars) for the four combinations of attention conditions and trial outcomes. For all four combinations, the correlation coefficient was statistically greater than zero for the same hemisphere projections and indistinguishable from zero (p > 0.5) for opposite hemisphere projections. R, Right; L, left; cor, correct detections; miss, missed changes.
Detect probability.
Many of our analyses compare a single-trial measure of attention based on the response of the population of simultaneously recorded cells to behavioral performance (see Fig. 2). To summarize the correlation between the population response and the monkey's performance, we calculated the area under the receiver operating characteristic (ROC) curve for the distributions of responses before correct and missed detections. A similar measure has been used to quantify the ability of an ideal observer to predict an animal's behavioral choice based on the responses of single sensory neurons to the changed stimulus; this is termed detect probability (DP) for a detection task (Cook and Maunsell, 2002) or choice probability for a discrimination task (Britten et al., 1996; Dodd et al., 2001; Uka and DeAngelis, 2004; Barberini et al., 2005; Liu and Newsome, 2005; Purushothaman and Bradley, 2005; Uka et al., 2005; Nienborg and Cumming, 2006; Cohen and Newsome, 2009; Nienborg and Cumming, 2009; Sasaki and Uka, 2009). Our metric differs from these others in that it is based on projections of the population response onto a specific attention axis (see Fig. 2) rather than spike counts from single neurons. Also, we focused on responses to stimuli before the stimulus change, which is the period of focus for attention studies. We refer to our metric as DPAA to emphasize that the detect probability calculation is done on projections of the population responses onto the attention axis (AA).
We calculated DPAA by comparing distributions of projections of population responses for correct detections and missed changes in one stimulus (these distributions for an example day of data are plotted in Fig. 2B,C). The DPAA for a single day of data is the area under the ROC curve comparing these two distributions, which corresponds to the probability that an ideal observer could discriminate correct from missed trials based on responses to the stimulus before the change (Green and Swets, 1966). A value of DPAA greater than 0.5 corresponds to distributions in which the mean projection for missed left changes was greater than −1, or that for right changes was less than 1. Mean DPAA values in Figures 3 and 7 represent the average DPAA for all 49 datasets.
Figure 7.
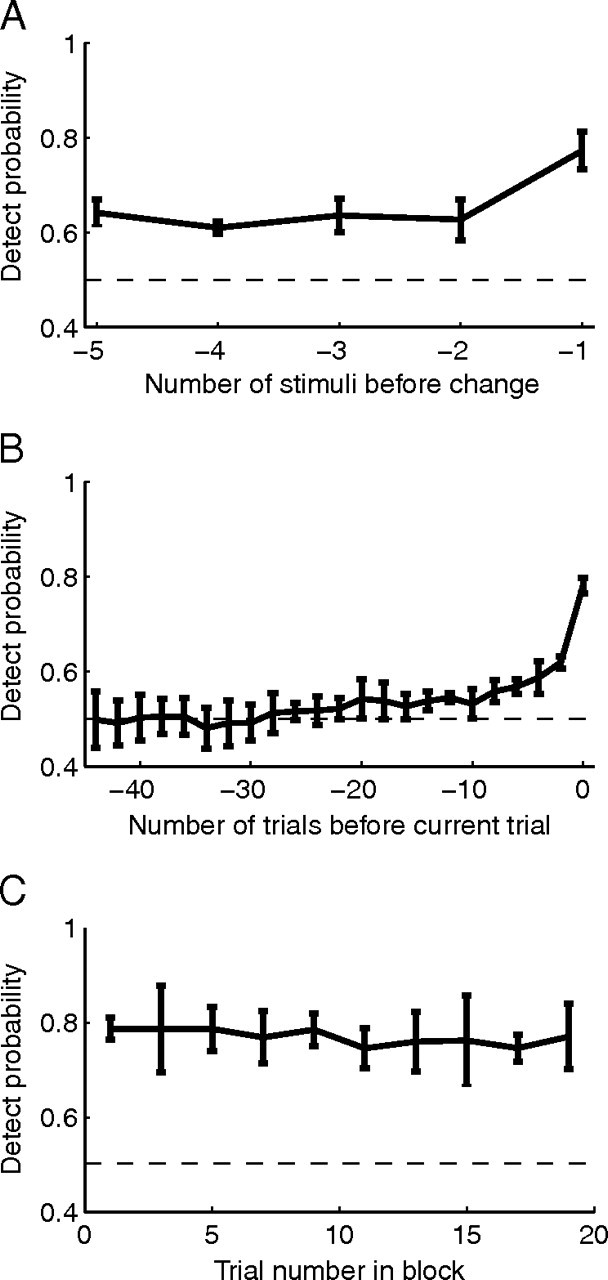
Dynamics of attention. A, Population DPAA as a function of number of stimuli before the change. Error bars represent SEM. B, Same as in A, as a function of number of trials before the current trial (based on the stimulus before the change in each trial). C, Population DPAA as a function of trial number within an attentional block.
Results
Across days, average modulation of V4 neurons is strongly correlated with behavioral improvement
As in previous studies (Assad, 2003; Yantis and Serences, 2003; Reynolds and Chelazzi, 2004; Maunsell and Treue, 2006), we found that attention both modulated individual neurons and improved behavioral performance. Furthermore, the size of the attentional effect on both neuronal responses and psychophysical performance varied from experiment to experiment. Our simultaneous recordings from many neurons allowed us to see that the variability in the mean neuronal modulation and the behavioral improvement was correlated from day to day. In the example day of data in Figure 1B, the behavioral improvement also differed in the two hemifields: attention caused a larger improvement in detection for the left stimulus (11.4° leftward shift of psychometric function, left plot) than for the right stimulus (3.6° leftward shift, right plot). The average shift for all 98 hemisphere days was 7.6° (5.5° SD; mean for monkey 1: left RFs = 4.1°, right RFs = 7.3°; mean for monkey 2: left RFs = 7.5°, right RFs = 10.1°).
To determine whether the amount of behavioral improvement was correlated with the average neuronal modulation across experiments, we calculated an attention index for each neuron based on its mean rates in each attention condition [(in − out)/(in + out)]. As is often observed in single neuron studies, there was considerable cell-to-cell variability in the attentional indices within the populations of neurons in each hemisphere (Fig. 1C). Nevertheless, the simultaneous recordings from populations of neurons allow us to see that like the behavioral improvement, the mean neuronal modulation differed between the two hemispheres. The mean index for neurons with left hemifield receptive fields was 0.10, which was significantly greater than the mean index for neurons with right hemifield RFs (0.03; t test, p < 0.05). Therefore, for this example day of data, attentional modulation was greater in neurons whose receptive fields overlapped the stimulus that showed more behavioral improvement caused by attention.
A relationship between neuronal and behavioral modulations held throughout our 98 datasets (Fig. 1D; each data point corresponds to one day of data for each hemisphere). The mean attentional modulation for all neurons within a hemisphere and the corresponding behavioral improvement were highly correlated (Pearson's correlation, r = 0.69, p < 10−9). The correlation was not caused by differences in mean modulation or behavioral improvement between the two animals or different hemispheres, because this correlation was present for each of the four hemispheres (monkey 1: left hemisphere: r = 0.88, p < 10−7, right hemisphere: r = 0.26, p < 0.05; monkey 2: left hemisphere: r = 0.89, p < 10−7, right hemisphere: r = 0.38, p < 0.01). Because we likely recorded from some of the same neurons on consecutive days, there is a potential concern that our measurements of attentional modulation may not have been independent from day to day. This turned out not to be the case, however; the average attentional modulation in a given hemisphere was uncorrelated with modulation on the following day (r = −0.06, p = 0.55). The behavioral improvement caused by attention was also uncorrelated from day to day (r = 0.004, p = 0.97).
There are several possible sources of the day-to-day variability in the effect of attention on both behavior and neuronal responses. Several factors in both the details of the experiment, such as the size, location, orientation, and spatial frequency of the visual stimuli, and in the monkey's internal state, such as arousal and motivation, varied from day to day. Consistent with previous studies in V4 (Spitzer et al., 1988; Boudreau et al., 2006), we found that average attentional modulation was higher when the task was more difficult (as evidence by poorer psychometric thresholds: correlation between mean attentional index and behavioral threshold in the attended condition was 0.37, p < 0.001; correlation between behavioral improvement and behavioral threshold was 0.34, p < 0.001).
Our results indicate that over the course of a recording session, the average attentional modulation of the responses of a population of V4 neurons is a good indicator of the expected behavioral improvement. Although many previous studies have shown that attention modulates individual neurons, the relationship between behavioral modulation and attentional modulation of individual neurons is so weak (Pearson's correlation, r = 0.06 in our dataset) that it would not be a striking feature of many single unit datasets (and may be statistically indistinguishable from zero in small datasets). Our simultaneous recordings from an average of 46 neurons per hemisphere per day allowed us to easily detect this strong correlation between mean neuronal modulation of a population and behavioral improvement.
As in the example day of data in Figure 1, B and C, we found that both the behavioral improvement and the mean neuronal modulation were often different in the two hemispheres. Across our dataset, day-to-day fluctuations were independent across hemispheres: the correlation coefficient for daily fluctuations in mean neuronal modulation between the left and right hemispheres was 0.09, which was not significantly different from zero (Fig. 1E, white bar, p = 0.37). Correspondingly, the average behavioral improvements on the two sides were also uncorrelated (Fig. 1E, gray bar, r = −0.01, p = 0.84). In contrast, when we divided the neurons within a hemisphere randomly into two groups, we found that the mean modulation indices of the two groups were positively correlated (Fig. 1E, black bar, r = 0.47, p < 0.01). Together, these results indicate that although modulation varied from neuron to neuron, the average attentional modulation of V4 neurons within a hemisphere is fairly consistent and closely associated with improvement in behavior, and that both neuronal modulation and behavioral modulation vary independently across hemispheres and attentional locations.
Population responses accurately predict performance on a trial-to-trial basis
The results in Figure 1 suggest that attention varies across experiments and that the responses of a population of V4 neurons can predict this variability. Across days, it is impossible to know the origin of this variability, so it was necessary to look within a day to see whether the relationship between the response of the neuronal population and behavioral improvement held on a trial-to-trial basis. We used the response of the population of simultaneously recorded cells to try to isolate neuronal variability caused by variability in attention.
We wanted to determine whether an estimate of attention based on neuronal responses to the stimulus before the orientation change (the same time period used to calculate attentional modulation in Fig. 1) could predict the monkey's ability to correctly detect an upcoming change. We focused our analyses on trials with a given difficult orientation change that occurred at the cued location, for which all trials had valid attentional cues. The average performance on these trials was 38% correct across all datasets (total correct trials divided by total correct plus total missed trials), which is in a range where attention can be the difference between correct and incorrect trials.
The goal of this analysis was to see whether we could use a single trial metric of attention to do the following: (1) accurately predict performance on the upcoming orientation change; (2) determine whether, as predicted by the results in Figure 1E, variation in the amount of attention allocated to each spatial location is independent; and (3) measure the dynamics of attentional allocation. We estimated the monkey's attentional state on a single trial by quantifying the similarity of the population response (generated from all simultaneously neurons recorded from both cerebral hemispheres) to the stimulus immediately preceding the orientation change on a given trial to the mean neuronal response in each attention condition. Importantly, we were not looking for an ideal decoder to distinguish between correct and incorrect trials based on responses to the stimulus before the change. Rather, we tested the hypothesis that a single-trial extension of the traditional definition of attention (during the time period typically used to calculate attentional modulation because it does not have confounds from stimulus changes and motor preparation) could predict behavior.
The process for calculating our single trial measure of attention is schematized for a two-neuron example in Figure 2A. We plotted the population response on each trial in an n-dimensional space in which the response of each simultaneously recorded neuron represented one dimension. Therefore, if we recorded 79 neurons in the two hemispheres combined, the population response on each trial would be a point in a 79-dimensional space. Both of the neurons in this example had receptive fields in the right hemifield, and correspondingly they showed a mean increase in firing rate when attention was directed toward the stimulus on the right (difference between the Xs in Fig. 2A). However, as shown by the scatter in the individual points, there is considerable trial-to-trial variability in the responses of the two neurons. Across attention conditions, this variability was correlated (on trials when one neuron fired more than its average, the other neuron was likely to fire more than its average).
To determine whether this neuronal variability was associated with variability in behavior, we projected the population response on each trial onto a putative “attention axis” connecting mean responses before correct detections in each attention condition. Note that variability along this axis depends both on the rates of each neuron and, importantly, on correlations between neurons (Cohen and Maunsell, 2009). We normalized the scalar projections for each day of data so that a projection of −1 was equal to the mean response before correct detections of stimulus changes on the left, and a projection of 1 was equal to the mean response before a correctly detected change in the right hemisphere. These projections are therefore a single trial extension of the traditional neuronal definition of attention; rather than simply comparing mean responses in the two attention conditions, each projection is a comparison of the population response on that trial to those two means.
This measure allows us to test the hypothesis that variability along this attention axis correlates with behavioral performance. Because the axis was defined by mean responses on correct trials, projections along the attention axis will differ for correct attend-left and correct attend-right trials. The key comparison comes from analyzing trials where the change was missed, which were not used to define the axis. If position on the attention axis is not correlated with behavior, projections for incorrect trials in a given condition will be indistinguishable from those for correct trials.
Instead, we found that that this putative metric of attention on incorrect trials is consistently shifted toward the mean of the opposite attention condition, indicating that missed detections may in part be a result of improperly allocated attention. On 27% of trials (3908 of 14,380 trials), the population projection was closer to the mean projection for the incorrect than for the correct attentional condition (i.e., projections on attend-left trials were greater than zero, or projections on attend-right trials were less than zero). On these trials, the monkey detected only 10% of orientation changes (401 of 3908 trials). In contrast, the monkey detected 49% of changes in which the population projection was closer to the mean for the correct attentional condition (5101 of 10,472 trials).
Figure 2, B and C show that population projections for the same example dataset as in Figure 1 were significantly different before correct detections (upward bars) and missed changes (downward bars). Because of the way we normalized the projections, the means of the distributions of projections for correct trials were by definition −1 and 1 for left and right changes. We found that, consistent with the hypothesis that variability along the attention axis is correlated with behavior, the projections of responses before missed trials in this dataset were shifted toward the mean of the opposite attentional condition (mean for left changes = −0.12, t test, p < 10−12; mean for right changes = 0.33, p < 10−6).
In nearly all of our 98 datasets, the distribution of projections before missed changes were shifted toward the mean projection for the opposite attentional condition (Fig. 2D,E) [mean projection for left changes was −0.53 over all 49 datasets, which is significantly different from −1, t test, p < 10−8 (mean = −0.56 for monkey 1 and −0.51 for monkey 2); mean for right changes was 0.16, which is significantly different from 1, p < 10−14 (mean = 0.16 for monkey 1 and 0.17 for monkey 2)], and this difference was individually statistically significant for 86 of 98 hemifield days (88%; t tests, p < 0.05). The fact that projections on missed trials were shifted toward to mean of the opposite attention condition was not an artifact of regression to the mean; when we defined the attention axis based on the mean projections on missed trials, the distributions of projections on correct trials were shifted away from the opposite attention condition on 81 of 98 datasets (83%).
The population projection provides a metric of attention on a single trial that correlates strongly with the animal's performance (Fig. 2F). On trials in which the projection was large and negative (near the mean for attend-left trials), the monkey did well detecting upcoming changes on the left (Fig. 2F, solid line) and poorly detecting changes on the right (Fig. 2F, dashed line). Conversely, on trials in which the projection was large and positive (similar to the mean of correct attend-right trials), the monkey correctly detected most changes on the right but very few on the left. Thus, while the overall performance was 38% correct on detecting the difficult (4.7°) orientation change, performance varied from nearly 0% correct to ∼70% correct depending on the amount of attention allocated to the relevant location.
In addition to predicting whether or not the animal would correctly detect the upcoming orientation change, the population projection also predicted the monkey's response time on correct trials. Reaction times in our task were short and tightly clustered (typically between 200 and 300 ms), leaving little variability to be explained by fluctuations in attention. Even so, our population projections predicted reaction time. On trials in which the projection was large and negative, reaction times tended to be fast for changes on the left (Fig. 2G, solid line) and slow for changes on the right (Fig. 2G, dashed line). Conversely, on trials in which the projection was large and positive, reaction times were faster on the right than on the left.
Dozens of simultaneously recorded neurons are necessary for accurate estimates of attention
The population projections in Figure 2, which were calculated using all simultaneously recorded neurons in each dataset, showed substantial trial-to-trial variability within each attention condition. Although our estimate of attention was based on relatively few neurons (mean 79 neurons), this variability was correlated with behavior (Fig. 2). The correlation was imperfect, however, leaving open two nonmutually exclusive possibilities: (1) that behavior is affected by variable factors in addition to attention; or (2) that our estimate of attention was noisy, perhaps because we recorded too few neurons to isolate variability in attention from other sources of neuronal variability. We next examined how much of the trial-to-trial variability in our attentional estimate was caused by measurement noise from using too few neurons and how much was due to actual variability in the animal's attentional state.
The variability in the responses of a single neuron and the relatively small effect of attention on its rate of firing make it impractical to use responses from one cell to estimate attention on a given trial. Figure 3A shows average firing rates for the stimulus before the orientation change for all 4874 single and multiunits separated by attention condition and behavioral outcome. These means reflect the well documented attentional increase in firing rates (Assad, 2003; Yantis and Serences, 2003; Reynolds and Chelazzi, 2004; Maunsell and Treue, 2006); responses to stimuli before correct detections were on average 8.6% higher when the stimulus in the neuron's receptive field was attended [Fig. 3A, black bar, mean rate = 22.5 spikes per second (sp/s)] than when it was unattended (mean rate = 20.7 sp/s; white bar). Individual neurons also show modest modulation by behavioral outcome; responses to stimuli before missed changes were on average between the responses on correct trials in the two attention conditions (Fig. 3A, gray bars, mean rates on missed trials were 21.8 sp/s and 21.0 sp/s when the stimulus was attended and unattended, respectively).
The differences in the mean rates of our 4874 neurons between the attention conditions and behavioral outcomes mean that on average, the responses of individual neurons carry some information about attention that is predictive of behavior. However, the responses of any one neuron are so variable (the error bars in Fig. 3A represent SD of the responses for the average individual neuron) that any one neuron predictably carries much less information about the animal's attentional state on a single trial than our population projections based on many simultaneously recorded neurons. We quantified our ability to predict behavior based on different numbers of simultaneously recorded neurons by calculating the population detect probability, DPAA (see Materials and Methods) (Fig. 3B). A population DPAA of 0.5 would mean that the population projections are uncorrelated with behavior, while DPAA values near 1 would mean that this estimate of attention predicts behavior nearly perfectly. The mean DP for individual neurons was 0.503, meaning that the fluctuations in the responses of individual neurons to the stimulus before the orientation change are very weakly correlated with behavior. [Note that, as in previous studies (Parker and Newsome, 1998; Cook and Maunsell, 2002), the responses of individual neurons to the changed stimulus are more highly correlated with behavior; our mean detect probability for that period was 0.528.]
We explored the effect of population size on our ability to predict behavioral outcomes by analyzing subsets that contained a specific number of neurons drawn randomly from our datasets. Population DPAA increases monotonically with the number of neurons used to calculate the attention axis and the projections onto it and appeared to approach an asymptote when we included all simultaneously recorded cells (Fig. 3B, rightmost point, mean = 79 neurons).
At asymptote, the variability in the population projections should be caused by actual trial-to-trial variability in the animal's attentional state rather than measurement noise resulting from our inability to record enough neurons to accurately estimate attention on an individual trial. To estimate the relative contributions of attentional fluctuations and measurement noise to the fluctuations in population projections we observed, we calculated the SD of the distribution of population projections as a function of the number of neurons used to calculate the projections (Fig. 3C). As in the analyses in Figure 2, projections onto the attention axis were normalized such that the mean for attend-left trials was −1, and the mean for attend-right trials was +1. Because the difference in mean rates was small or nonexistent for small numbers of neurons, the variability in attention axis projections is dominated by the variability of individual cells for small population sizes, leading to distributions with enormous SDs (Fig. 3C, left side). As the number of neurons increased, the SD appears to approach an asymptote. The distribution of projections using the full datasets (Fig. 3C, right point) had an SD of 0.90.
If the variability in the distribution of projections reflects fluctuations in attention rather than measurement noise, this large SD implies that spontaneous fluctuations in attention within a task condition can span a large range, comparable to the average effect of shifting attention between the two stimuli in our task. To confirm that this SD is not dominated by measurement noise, we used the procedure depicted in Figure 3D to quantify the maximum component of this SD that could be caused by measurement noise. Figure 2F shows that behavioral performance increases monotonically with increased attention. These same data have been replotted in Figure 3D after flipping values from one condition so that a projection of 1 always corresponds to the mean population response on correct trials with attention directed toward the location of the stimulus change. We then combined behavior from both attention conditions. The solid line is the best fitting cumulative Gaussian function.
One extreme possible relationship between attention and behavior is that behavior is a step function of attention, falling at one of two performance levels depending on the locus of attention (Fig. 3D, dashed line step function). This could only occur if there was no noise in the processes that link behavior and attentional state. In this extreme formulation, the deviation of the measured behavior–projection function (Fig. 3D, solid line) from a step function (dashed line) depends only on the measurement noise. Specifically, as noise in the measurements of position on the attention axis grows larger, the behavior–projection function becomes less steep. Thus, the steepness of the behavior–performance function places an upper limit on noise in measuring position on the attention axis. Making the assumption of an underlying step function places an upper limit on measurement noise, because a step function has the largest possible difference from the measured behavior–projection function.
To explore this limit, we fit a cumulative Gaussian to the actual plot of psychometric performance as a function of projection onto the attention axis. The fitted Gaussian (Fig. 3D, dotted line) had an SD of 0.47, which is substantially lower than the measured SD of 0.90. If the noise in measuring position on the attention axis were broader than this, the psychometric function would have had to be flatter, even if behavioral performance was a perfect step function of position on the attention axis.
A maximum SD of measurement noise of 0.47 corresponds to a maximum variance of 0.22. Because the measured variance of position on the attention axis is 0.81 (SD 0.90), the remaining variance must be accounted for by actual variability along the attention axis that is related to psychophysical performance. This amounts to a minimum variance of 0.59 or an SD of 0.7. Our measured SD of the distribution of attention axis projections (0.90) is close to this theoretical asymptote (Fig. 3C, gray line). This observation, combined with the strong relationship between projections onto the attention axis and behavior (Fig. 2F,G), suggests that the variability in projections using the full datasets is dominated by actual variability in attention rather than measurement noise.
Behavior correlates with fluctuations in attention rather than other sources of variability
We showed that projections of population responses onto the putative attention axis accurately predict the monkey's performance (Figs. 2, 3). This axis, defined as the line joining the mean population responses to identical stimuli in the two different attention conditions, is a neuronal population extension of the classical definition of attention, so it seems likely that variability along the attention axis corresponds to variability in attention. However, it is possible that variability along another axis in the population activity space is even more tightly correlated with behavior. If this other axis was similar to the attention axis, correlations between projections along the attention axis and performance (such as those in Figs. 2 and 3) could occur simply by association. We therefore did additional analyses that show that the attention axis predicts behavior much more reliably than candidate alternative axes.
To get a sense of how attentional modulation of individual neurons covaries with modulation by different factors, we compared measures of the responses of all of the simultaneously recorded neurons in each dataset in several periods and task conditions (Fig. 4, an example dataset). The attention axis is constructed from responses from all simultaneously recorded neurons in the two hemispheres combined, which allows us to separate effects of attention from global factors such as alertness or arousal, but the hemisphere from which each neuron was recorded is identified for clarity (Fig. 4, filled and open points). In general, individual neurons responded more during stimulus presentations than they did when the animal fixated a blank screen at the start of the trial (Fig. 4A). Neurons whose receptive fields were in the same hemifield as the stimulus that changed tended have higher responses to the changed than the previous stimulus; this was presumably caused by a release of adaptation to the repeating stimulus (Fig. 4B). The similarity in individual neurons' mean responses to the previous stimulus in the two behavioral outcomes (Fig. 4C) further illustrate the point that dozens of simultaneously recorded neurons are necessary to predict performance on individual trials (see also Fig. 3). As expected, neurons in the right hemisphere tended to respond more strongly when attention was directed to the left (Fig. 4D) and vice versa, but the modulation of individual neurons was modest, averaging 1.87 sp/s or 0.37 spikes per 200 ms stimulus presentation for this example dataset. The distributions of attentional modulation for neurons in the right (top histogram) and left (bottom histogram) hemispheres are shown in Figure 4E.
We first considered whether an axis that captures stimulus or decision-related variability that might be useful for computing a perceptual decision in this task could predict behavior as reliably as the attention axis. The monkey's task is to discriminate the new changed stimulus from the previous stimulus, so the monkey might compare the population response to the changed stimulus with the response to the previous stimulus. If so, responses to the previous stimulus that differ more from population responses to the change might be more discriminable than responses that are more similar to the change. Such a stimulus/decision axis would be qualitatively different than an attention axis, because attention modulation was not well correlated with decision modulation (Fig. 4F).
To directly compare the importance on a population level of stimulus/decision versus attentional modulation of responses to the previous stimulus in predicting performance, we repeated the analyses in Figure 2 of the subpopulation of neurons for which the attentional index and stimulus modulation index were of opposite sign (e.g., neurons that responded more strongly to attended than unattended stimuli but more weakly to the changed stimulus than the previous stimulus, or vice versa). We defined an attention axis for this subpopulation of neurons (average 31 of 92 neurons per dataset) and looked at projections for missed trials just as we did in Figure 2. For these neurons, if attentional modulation was more important than stimulus modulation in predicting performance, projections before missed detections would be shifted toward the opposite attentional location (as in Fig. 2). If, however, stimulus modulation was more important, projections before missed detections would be shifted away from the opposite attentional location.
Figure 5 shows that for nearly every dataset, projections were shifted toward the opposite attentional condition [the mean of the distribution of average projections was −0.45 for misses in the left hemifield, which is significantly greater than −1, the mean for correct trials in the left hemifield (t test, p < 10−9); the mean was 0.19 for misses in the right hemifield, which is significantly less than 1, the mean for correct trials in the right hemifield (p < 10−17)]. These results indicate that attentional modulation is more important for predicting performance based on responses before the change than stimulus modulation.
We also tested the effectiveness of a putative decision-selectivity or stimulus-selectivity axis in predicting performance based on responses to the previous stimulus by repeating the analyses in Figure 2 for this new axis (constructed using all neurons). This axis is a population extension of the axis that is implicitly used to calculate choice or detect probability from responses to the changed stimulus. Rather than defining the axis based on the mean response to the previous stimulus in the two attention conditions, we defined two separate decision axes, one for changes on the left and one for changes on the right. The decision axis for a given attention condition was the one that joined the mean response to the previous stimulus and the changed stimulus in that attention condition [these are the same axes used to calculate discriminability by Cohen and Maunsell (2009)]. We then calculated projections of population responses to the previous stimulus onto the decision axis and quantified the relationship between these projections and behavioral performance by calculating the population DP for changes in each hemifield. The population DP was lower for the decision axis than for an attention axis calculated separately for each hemifield (average DPAA = 0.62 and 0.58 for the decision axis versus 0.72 and 0.83 for the attention axis for left and right changes, respectively; t tests, p < 10−4 for left changes and 10−9 for right changes). In contrast, projections of responses to the changed stimulus onto the decision axis predict behavior very accurately (population detect probability along the decision axis during the changed stimulus = 0.76 and 0.84 for left and right changes, respectively).
We therefore have two lines of evidence suggesting that behavior correlates with variability in responses to the stimulus before the change along an attention axis rather than a stimulus or decision axis. First, behavior correlates with projections along the attention and not with the decision axis for subpopulations of neurons for which the two axes give opposite predictions. Second, population DP for the full population is lower along the decision axis than along the attention axis. Together, these analyses suggest that the correlations between projections along the attention axis and behavior (Figs. 2, 3) are not caused by variability along a stimulus or decision axis.
Another possibility is that the variability we observed along the attention axis arose from variability in global factors such as arousal or alertness. This seems unlikely, because the attention axis is constructed using responses from all simultaneously recorded neurons in the two hemispheres combined, and average attentional modulation tends to affect the two hemispheres in opposite ways. Neurons with receptive fields in the left hemifield tend to have higher firing rates in the attend-left than the attend-right condition, and the opposite is true for neurons whose receptive fields are in the right hemifield. In contrast, global factors should modulate all neurons in the same way, so an arousal axis should be orthogonal to the attention axis. To test this directly, we computed projections onto a response axis (from the origin to the mean response to the previous stimulus) and found that population DP along the response axis was not significantly different from chance for either hemifield (average DP = 0.51, t test, p = 0.16 for left changes; DP = 0.50, p = 0.34 for right changes). These results, combined with the above investigation of the decision axis, suggest that the variability we observed along our attention axis in fact represented variability in the amount of attention allocated to each location.
Within an attentional condition, the amount of attention allocated to the two stimuli is independent
The ability to measure attention on a single trial is important in part because it can remove variance from measurements of how attention affects behavioral and neuronal performance and provide insights into the mechanisms of attention. We used the population projections in Figure 2 to probe the limits on an animal's ability to monitor multiple stimuli simultaneously. One possibility is that an animal can attend to only one stimulus at a time and needs to switch attention between them. This idea is embodied in the metaphor of an attentional “spotlight” (Posner et al., 1980; Eriksen and Yeh, 1985; Eriksen and St James, 1986; Posner, 1987, 1994), which suggests that attention is a limited resource that can be directed to a specific location or small set of locations (Stark et al., 1997; Müller and Hubner, 2002; Müller et al., 2003). In our task, the prediction of this metaphor is that directing attention to one stimulus decreases attention to the other stimulus. Alternately, an animal may partition either a fixed or variable amount of attention to two stimuli independently.
Across blocks of trials, an anticorrelation between the two attentional conditions in our task is imposed by the structure of most psychophysical tasks, including ours. The definition of attention requires that shifting attention from one location to another will improve behavioral performance at the newly attended location and reduced performance at the other. If a single mechanism determines the cued, blockwise effects and the trial-to-trial fluctuations we observed, then the trial-to-trial fluctuations should similarly show an anticorrelation between the two stimulus representations. Our single trial measure of attention allows us to determine whether such an anticorrelation exists. Using the same method depicted in Figure 2A, we defined attention axes for the subpopulations of neurons in each hemisphere separately. Therefore, on each trial we obtained two population projections, one from the population of neurons in each hemisphere. We investigated whether increasing attention at one location decreases attention to the other within an attention condition by computing the correlation coefficient between the trial-to-trial variability in the population projections for the two hemispheres in that condition.
Surprisingly, we found that the correlation between the population projections for the two hemispheres was statistically indistinguishable from zero for each change location and trial outcome (Fig. 6, white bars). In contrast, when we randomly divided the neurons within a hemisphere into two groups and calculated a population projection for each group, the correlation coefficient between projections for the two groups within a hemisphere was significantly greater than zero for all four conditions (Fig. 6, black bars), showing that the population projection method has the statistical power to detect a consistent amount of attention directed to the joint receptive fields of neurons within a hemisphere.
Consistent with the independence of the two hemispheres, we found that including neurons from the hemisphere opposite the change was only slightly useful in predicting the monkey's performance. The population DPAA for the attention axis based on all simultaneously recorded neurons in both hemispheres (Fig. 2) was 0.75 for changes in the left hemifield and 0.81 for the right hemifield. Our ability to predict behavior using projections on the attention axis was only slightly diminished by using only neurons whose receptive fields were in the same hemifield as the changed stimulus (DPAA = 0.71 and 0.77 for the left and right hemifields, respectively, which was significantly different from 0.75 and 0.81, p < 0.01 for both comparisons). Our ability to predict behavior based only on the responses of neurons whose receptive fields were in the opposite hemifield as the changed stimulus was significantly greater than chance, but much lower when using the neurons whose receptive fields overlapped the changed stimulus (DPAA = 0.58 and 0.54 for changes in the left and right hemifields, respectively). These results indicate that, consistent with the observation that projections for the two hemispheres were independent (Fig. 6), neurons whose receptive fields are in the opposite hemifield as a visual stimulus do not provide very much information about the amount of attention directed to that stimulus.
Dynamics of attention
The ability to estimate attention on a single trial also allows us to investigate the dynamics with which attention to a given location varies. We used the population DPAA measure to summarize the relationship between population projections at a given time and the animal's future performance. These analyses use a somewhat different set of trials and stimuli than the analyses in Figure 2–6; we used responses to all stimuli before an orientation change except the first stimulus of the trial (Fig. 7A), the stimulus immediately before the change on all correctly completed trials, regardless of the eventual orientation change (Fig. 7B), or the stimulus immediately before the change on the single orientation change used in the other analyses (Fig. 7C). All responses were projected onto a single attention axis computed using the stimulus immediately before the change as usual.
Overall, we found that attention varies somewhat from one stimulus presentation to the next (on a timescale of a few hundred milliseconds), but a component of attentional allocation varies much more slowly. Between the first and second stimuli preceding the change, the population DPAA drops significantly from 0.78 to 0.64 (Fig. 7A; t test, p < 0.01), meaning that attention varies appreciably on the timescale of a single stimulus. These quick shifts in attention mean that attention likely varies somewhat between the stimulus before the change (when we measured responses) and the changed stimulus to which the monkey responds. Therefore, even if we could record from an arbitrarily large number of cells, information about the animal's attention state measured during the stimulus before the change may never allow us to predict responses to the changed stimulus perfectly (DPAA may never reach 1).
In addition to variability on the timescale of individual stimuli, a component of attentional allocation varies more slowly; DPAA was fairly constant between the second and fifth stimuli before the change (no DPAAs were significantly different, paired t tests, p > 0.05) and remains significantly greater than 0.5 until at least 10 trials before the current trial (Fig. 7B). This attentional allocation does not appear to reflect the animal increasingly attending to the cued side over successive trials within a block, as we did not observe consistent changes across a block in either the average DPAA (Fig. 7C) or the average raw population projection (slope of the best fit line = 0.001, which is not significantly different from 0, p = 0.41).
Discussion
A fundamental question in systems neuroscience is how populations of neurons encode sensory stimuli and guide behavior. In the laboratory, this question is often addressed by analyzing the average response of a single neuron to many ostensibly identical trials. A major assumption of this approach is that all trials within a condition are the same, but we show here that attention varies considerably from trial to trial and that this variability has important behavioral consequences. Our results suggest that studying moderate-sized populations of neurons instead of single neurons may yield important insights about how behavior is controlled. Our study focused on the relationship between a single-trial measure of attention and psychophysical performance. In the future, studies of moment-to-moment variability in neuronal populations in other brain areas, time periods, and tasks may reveal how populations of neurons guide other aspects of behavior.
The ability to measure attention on a single trial is important in part because it can remove variance from measurements of how attention affects behavioral and neuronal performance and provide insights into the mechanisms of attention. Here, we were able to use this metric to probe the limits on an animal's ability to monitor multiple stimuli simultaneously. One possibility is that an animal can attend to only one stimulus at a time and needs to switch attention between them. This idea is embodied in the metaphor of an attentional spotlight (Posner et al., 1980; Eriksen and Yeh, 1985; Eriksen and St James, 1986; Posner, 1987, 1994), which suggests that attention is a limited resource that can be directed to a specific location or small set of locations (Stark et al., 1997; Müller and Hubner, 2002; Müller et al., 2003). Alternately, an animal may partition either a fixed or variable amount of attention to two stimuli independently.
Unexpectedly, we found that within an attentional condition the amount of attention allocated to each hemifield is independent (Fig. 6). This result was somewhat surprising, because the structure of our task imposed a blockwise anticorrelation in both behavior and neuronal modulation; on blocks of trials in which attention was directed to the left stimulus, it was directed away from the right. The mean neuronal modulation reflects this anticorrelation. Attention typically increases firing rates (attention indices are on average positive) (Fig. 1,D,E); thus, on attend-left blocks of trials, firing rates in the right hemisphere typically increased while responses in the left hemisphere decreased. However, our analysis of population projections (Fig. 2) shows that attention varies from trial to trial and that this variability affects behavior but shows no sign of blockwise anticorrelation.
The lack of anticorrelation between the population projections suggests that within-block variability is not attributable to errors in remembering the attention condition of the current block of trials, which would have produced a measurable anticorrelation. Instead, our results suggest that the variability came from retinotopically local processes that control attention to each stimulus. The fact that the monkey did not make many errors in block identification is unsurprising because discriminating the attention conditions was easy; there were only two attention conditions, the blocks were long (125 trials), and each block was preceded by 10 instruction trials that served as attentional cues (see Materials and Methods). Instead, variability in attention was local to each stimulus location.
Thus, while attention may have an average effect that appears like a movable spotlight, within a trial there is no evidence that increases in one representation are tied to decreases at another. This result is consistent with the psychophysical finding that observers' ability to attend to a stimulus is unaffected by attending to a second stimulus in the opposite hemifield (Alvarez and Cavanagh, 2005). When the two stimuli are in opposite hemifields, attention appears less like a spotlight and more like a filter that independently adjusts the strength of neuronal responses at different retinotopic locations to reflect the behavioral significance of those locations. Our results suggest that attention may flexibly weight each part of the visual scene according to its current behavioral relevance.
We did not find that trial-to-trial fluctuations in attention acted through a mechanism like a spotlight in which a unitary, top-down input modulated populations of V4 neurons in both hemispheres in a push–pull fashion. Such top-down input would be expected to produce anticorrelation in the fluctuations in the activity of pairs of V4 neurons in opposite hemispheres (noise correlations), which are thought to reflect common inputs to the pair of neurons. Noise correlations in neurons with overlapping receptive fields are typically positive (Gawne and Richmond, 1993; Gawne et al., 1996; Reich et al., 2001; Kohn and Smith, 2005; Cohen and Newsome, 2008; Smith and Kohn, 2008; Thiele and Hoffmann, 2008; Cohen and Maunsell, 2009; Mitchell et al., 2009; Poort and Roelfsema, 2009), and these correlations are modulated by attention (Cohen and Maunsell, 2009; Mitchell et al., 2009). In contrast, fluctuations in the responses of V4 neurons in opposite hemispheres are independent (Cohen and Maunsell, 2009). This result, along with the observations that population projections in the two hemispheres are independent and that neurons whose receptive fields are in the opposite hemifield do not predict the amount of attention allocated to a given stimulus, suggests that trial-to-trial fluctuations in attention to each of the two stimulus locations in our task is governed not by a single top-down control mechanism but by separate groups of neurons whose variability is independent. It is possible that the blockwise anticorrelation that is invariably observed reflects the opposing actions of these independent mechanisms rather than a mechanism with an obligatory push–pull action on different retinotopic representations.
Our physiological results, as well as this view of attention as governed by local populations of neurons, are consistent with a recent theory that attention depends on the same mechanisms that underlie divisive normalization (Boynton, 2009; Lee and Maunsell, 2009; Reynolds and Heeger, 2009). Neurons with overlapping receptive fields likely share a normalization pool, resulting in consistent attentional allocation to a given stimulus (Fig. 3). In contrast, neurons in opposite hemispheres probably have independent normalization pools, leading to independent trial-to-trial fluctuations in attention between hemispheres.
We showed that the responses of modestly sized populations of sensory neurons can reliably predict psychophysical performance a short time later. In future studies, this approach may allow experimenters to associate the single-trial responses of neural populations in other cortical areas mediating other aspects of behavior, thus enhancing our understanding of the role of different areas in guiding behavior. Our results in particular suggest that the most simple view of attention as a single, top-down entity is likely incorrect, and that, like many cortical processes, variability in the amount of psychophysical improvement caused by attention can be explained by the variability of local populations of neurons.
Footnotes
This work was supported by National Institutes of Health Grant R01EY005911 and the Howard Hughes Medical Institute. We thank John Assad, Mark Histed, Incheol Kang, Amy Ni, Hendrikje Nienborg, Douglas Ruff, Alec Scharff, and Alexandra Smolyanskaya for helpful discussions and comments on an earlier version of the manuscript.
References
- Alvarez GA, Cavanagh P. Independent resources for attentional tracking in the left and right visual hemifields. Psychol Sci. 2005;16:637–643. doi: 10.1111/j.1467-9280.2005.01587.x. [DOI] [PubMed] [Google Scholar]
- Assad JA. Neural coding of behavioral relevance in parietal cortex. Curr Opin Neurobiol. 2003;13:194–197. doi: 10.1016/s0959-4388(03)00045-x. [DOI] [PubMed] [Google Scholar]
- Barberini CL, Cohen MR, Wandell BA, Newsome WT. Cone signal interactions in direction-selective neurons in the middle temporal visual area (MT) J Vis. 2005;5:603–621. doi: 10.1167/5.7.1. [DOI] [PubMed] [Google Scholar]
- Boudreau CE, Williford TH, Maunsell JHR. Effects of task difficulty and target likelihood in area V4 of macaque monkeys. J Neurophysiol. 2006;96:2377–2387. doi: 10.1152/jn.01072.2005. [DOI] [PubMed] [Google Scholar]
- Boynton GM. A framework for describing the effects of attention on visual responses. Vision Res. 2009;49:1129–1143. doi: 10.1016/j.visres.2008.11.001. [DOI] [PMC free article] [PubMed] [Google Scholar]
- Britten KH, Newsome WT, Shadlen MN, Celebrini S, Movshon JA. A relationship between behavioral choice and the visual responses of neurons in macaque MT. Vis Neurosci. 1996;13:87–100. doi: 10.1017/s095252380000715x. [DOI] [PubMed] [Google Scholar]
- Cameron EL, Tai JC, Carrasco M. Covert attention affects the psychometric function of contrast sensitivity. Vision Res. 2002;42:949–967. doi: 10.1016/s0042-6989(02)00039-1. [DOI] [PubMed] [Google Scholar]
- Carrasco M, Penpeci-Talgar C, Eckstein M. Spatial covert attention increases contrast sensitivity across the CSF: support for signal enhancement. Vision Res. 2000;40:1203–1215. doi: 10.1016/s0042-6989(00)00024-9. [DOI] [PMC free article] [PubMed] [Google Scholar]
- Cohen MR, Maunsell JHR. Attention improves performance primarily by reducing interneuronal correlations. Nat Neurosci. 2009;12:1594–1600. doi: 10.1038/nn.2439. [DOI] [PMC free article] [PubMed] [Google Scholar]
- Cohen MR, Newsome WT. Context-dependent changes in functional circuitry in visual area MT. Neuron. 2008;60:162–173. doi: 10.1016/j.neuron.2008.08.007. [DOI] [PMC free article] [PubMed] [Google Scholar]
- Cohen MR, Newsome WT. Estimates of the contribution of single neurons to perception depend on timescale and noise correlation. J Neurosci. 2009;29:6635–6648. doi: 10.1523/JNEUROSCI.5179-08.2009. [DOI] [PMC free article] [PubMed] [Google Scholar]
- Cook EP, Maunsell JHR. Dynamics of neuronal responses in macaque MT and VIP during motion detection. Nat Neurosci. 2002;5:985–994. doi: 10.1038/nn924. [DOI] [PubMed] [Google Scholar]
- Dickey AS, Suminski A, Amit Y, Hatsopoulos NG. Single-unit stability using chronically implanted multielectrode arrays. J Neurophysiol. 2009;102:1331–1339. doi: 10.1152/jn.90920.2008. [DOI] [PMC free article] [PubMed] [Google Scholar]
- Dodd JV, Krug K, Cumming BG, Parker AJ. Perceptually bistable three-dimensional figures evoke high choice probabilities in cortical area MT. J Neurosci. 2001;21:4809–4821. doi: 10.1523/JNEUROSCI.21-13-04809.2001. [DOI] [PMC free article] [PubMed] [Google Scholar]
- Eriksen CW, St James JD. Visual attention within and around the field of focal attention: a zoom lens model. Percept Psychophys. 1986;40:225–240. doi: 10.3758/bf03211502. [DOI] [PubMed] [Google Scholar]
- Eriksen CW, Yeh YY. Allocation of attention in the visual field. J Exp Psychol Hum Percept Perform. 1985;11:583–597. doi: 10.1037//0096-1523.11.5.583. [DOI] [PubMed] [Google Scholar]
- Gawne TJ, Richmond BJ. How independent are the messages carried by adjacent inferior temporal cortical neurons? J Neurosci. 1993;13:2758–2771. doi: 10.1523/JNEUROSCI.13-07-02758.1993. [DOI] [PMC free article] [PubMed] [Google Scholar]
- Gawne TJ, Kjaer TW, Hertz JA, Richmond BJ. Adjacent visual cortical complex cells share about 20% of their stimulus-related information. Cereb Cortex. 1996;6:482–489. doi: 10.1093/cercor/6.3.482. [DOI] [PubMed] [Google Scholar]
- Green DM, Swets JA. Signal detection theory and psychophysics. New York: Wiley; 1966. [Google Scholar]
- Kohn A, Smith MA. Stimulus dependence of neuronal correlation in primary visual cortex of the macaque. J Neurosci. 2005;25:3661–3673. doi: 10.1523/JNEUROSCI.5106-04.2005. [DOI] [PMC free article] [PubMed] [Google Scholar]
- Lee DK, Itti L, Koch C, Braun J. Attention activates winner-take-all competition among visual filters. Nat Neurosci. 1999;2:375–381. doi: 10.1038/7286. [DOI] [PubMed] [Google Scholar]
- Lee J, Maunsell JHR. A normalization model of attentional modulation of single unit responses. PLoS One. 2009;4:e4651. doi: 10.1371/journal.pone.0004651. [DOI] [PMC free article] [PubMed] [Google Scholar]
- Liu J, Newsome WT. Correlation between speed perception and neural activity in the middle temporal visual area. J Neurosci. 2005;25:711–722. doi: 10.1523/JNEUROSCI.4034-04.2005. [DOI] [PMC free article] [PubMed] [Google Scholar]
- Lu ZL, Dosher BA. External noise distinguishes attention mechanisms. Vision Res. 1998;38:1183–1198. doi: 10.1016/s0042-6989(97)00273-3. [DOI] [PubMed] [Google Scholar]
- Maunsell JHR, Treue S. Feature-based attention in visual cortex. Trends Neurosci. 2006;29:317–322. doi: 10.1016/j.tins.2006.04.001. [DOI] [PubMed] [Google Scholar]
- Mitchell JF, Sundberg KA, Reynolds JH. Spatial attention decorrelates intrinsic activity fluctuations in macaque area V4. Neuron. 2009;63:879–888. doi: 10.1016/j.neuron.2009.09.013. [DOI] [PMC free article] [PubMed] [Google Scholar]
- Müller MM, Hübner R. Can the spotlight of attention be shaped like a doughnut? Evidence from steady-state visual evoked potentials. Psychol Sci. 2002;13:119–124. doi: 10.1111/1467-9280.00422. [DOI] [PubMed] [Google Scholar]
- Müller NG, Bartelt OA, Donner TH, Villringer A, Brandt SA. A physiological correlate of the “Zoom Lens” of visual attention. J Neurosci. 2003;23:3561–3565. doi: 10.1523/JNEUROSCI.23-09-03561.2003. [DOI] [PMC free article] [PubMed] [Google Scholar]
- Nienborg H, Cumming BG. Macaque V2 neurons, but not V1 neurons, show choice-related activity. J Neurosci. 2006;26:9567–9578. doi: 10.1523/JNEUROSCI.2256-06.2006. [DOI] [PMC free article] [PubMed] [Google Scholar]
- Nienborg H, Cumming BG. Decision-related activity in sensory neurons reflects more than a neuron's causal effect. Nature. 2009;459:89–92. doi: 10.1038/nature07821. [DOI] [PMC free article] [PubMed] [Google Scholar]
- Parker AJ, Newsome WT. Sense and the single neuron: probing the physiology of perception. Annu Rev Neurosci. 1998;21:227–277. doi: 10.1146/annurev.neuro.21.1.227. [DOI] [PubMed] [Google Scholar]
- Poort J, Roelfsema PR. Noise correlations have little influence on the coding of selective attention in area V1. Cereb Cortex. 2009;19:543–553. doi: 10.1093/cercor/bhn103. [DOI] [PMC free article] [PubMed] [Google Scholar]
- Posner MI. Cognitive neuropsychology and the problem of selective attention. Electroencephalogr Clin Neurophysiol Suppl. 1987;39:313–316. [PubMed] [Google Scholar]
- Posner MI. Attention: the mechanisms of consciousness. Proc Natl Acad Sci U S A. 1994;91:7398–7403. doi: 10.1073/pnas.91.16.7398. [DOI] [PMC free article] [PubMed] [Google Scholar]
- Posner MI, Snyder CR, Davidson BJ. Attention and the detection of signals. J Exp Psychol. 1980;109:160–174. [PubMed] [Google Scholar]
- Purushothaman G, Bradley DC. Neural population code for fine perceptual decisions in area MT. Nat Neurosci. 2005;8:99–106. doi: 10.1038/nn1373. [DOI] [PubMed] [Google Scholar]
- Reich DS, Mechler F, Victor JD. Independent and redundant information in nearby cortical neurons. Science. 2001;294:2566–2568. doi: 10.1126/science.1065839. [DOI] [PubMed] [Google Scholar]
- Reynolds JH, Chelazzi L. Attentional modulation of visual processing. Annu Rev Neurosci. 2004;27:611–647. doi: 10.1146/annurev.neuro.26.041002.131039. [DOI] [PubMed] [Google Scholar]
- Reynolds JH, Heeger DJ. The normalization model of attention. Neuron. 2009;61:168–185. doi: 10.1016/j.neuron.2009.01.002. [DOI] [PMC free article] [PubMed] [Google Scholar]
- Sasaki R, Uka T. Dynamic readout of behaviorally relevant signals from area MT during task switching. Neuron. 2009;62:147–157. doi: 10.1016/j.neuron.2009.02.019. [DOI] [PubMed] [Google Scholar]
- Smith MA, Kohn A. Spatial and temporal scales of neuronal correlation in primary visual cortex. J Neurosci. 2008;28:12591–12603. doi: 10.1523/JNEUROSCI.2929-08.2008. [DOI] [PMC free article] [PubMed] [Google Scholar]
- Spitzer H, Desimone R, Moran J. Increased attention enhances both behavioral and neuronal performance. Science. 1988;240:338–340. doi: 10.1126/science.3353728. [DOI] [PubMed] [Google Scholar]
- Stark ME, Grafman J, Fertig E. A restricted ‘spotlight’ of attention in visual object recognition. Neuropsychologia. 1997;35:1233–1249. doi: 10.1016/s0028-3932(97)00049-3. [DOI] [PubMed] [Google Scholar]
- Thiele A, Hoffmann KP. Neuronal firing rate, inter-neuron correlation and synchrony in area MT are correlated with directional choices during stimulus and reward expectation. Exp Brain Res. 2008;188:559–577. doi: 10.1007/s00221-008-1391-z. [DOI] [PubMed] [Google Scholar]
- Uka T, DeAngelis GC. Contribution of area MT to stereoscopic depth perception: choice-related response modulations reflect task strategy. Neuron. 2004;42:297–310. doi: 10.1016/s0896-6273(04)00186-2. [DOI] [PubMed] [Google Scholar]
- Uka T, Tanabe S, Watanabe M, Fujita I. Neural correlates of fine depth discrimination in monkey inferior temporal cortex. J Neurosci. 2005;25:10796–10802. doi: 10.1523/JNEUROSCI.1637-05.2005. [DOI] [PMC free article] [PubMed] [Google Scholar]
- Yantis S, Serences JT. Cortical mechanisms of space-based and object-based attentional control. Curr Opin Neurobiol. 2003;13:187–193. doi: 10.1016/s0959-4388(03)00033-3. [DOI] [PubMed] [Google Scholar]