

Abstract
A genetic deficiency of lysosomal alpha-mannosidase causes the lysosomal storage disease alpha-mannosidosis (AMD), in which oligosaccharide accumulation occurs in neurons and glia. The purpose of this study was to evaluate the role of magnetic resonance spectroscopy (MRS) in detecting the oligosaccharide accumulation in AMD. Five cats with AMD and eight age-matched normal cats underwent in vivo MRS studies with a single voxel short echo time (20 ms) STEAM spectroscopy sequence on a 4.7T magnet. Two voxels were studied in each cat, from the cerebellar vermis and the occipital cortex. Metabolites of brain samples from these regions were extracted with perchloric acid and analyzed by high resolution NMR spectroscopy. A significantly elevated unresolved resonance signal between 3.4 and 4. ppm was observed in the cerebellar vermis and occipital cortex of all AMD cats, which was absent in normal cats. This resonance was shown to be from carbohydrate moieties by high resolution NMR of tissue extracts. Resonances from the Glc-NAc group (1.8–2.2 ppm) along with anomeric proton signals (4.6–5.4 ppm) from undigested oligosaccharides were also observed in the extract spectra from AMD cats. This MRS spectral pattern may be a useful biomarker for AMD diagnosis as well as for assessing responses to therapy.
Keywords: lysosomal storage disease, alpha-mannosidosis, magnetic resonance spectroscopy, oligosaccharides
INTRODUCTION
The lysosomal storage diseases (LSDs) are a group of cellular function disorders that usually occur in childhood and predominantly affect the central nervous system leading to mental retardation (1). Most of the LSDs are caused by mutations in the genes encoding lysosomal acid hydrolases. The deficiencies in enzymatic activity result in an accumulation of uncatabolized substrate molecules in the secondary lysosomes, leading to cell swelling and dysfunction. An ability to non-invasively monitor the accumulation of these substrates in brain tissue will facilitate the diagnosis of LSDs and provide a tool for monitoring response to therapy.
We have analyzed a cat model of human alpha-mannosidosis (AMD), which is caused by a genetic deficiency of lysosomal alpha-mannosidase (LAMAN) with an accompanying accumulation of undigested oligosaccharides (2). Cats with AMD exhibit similar clinical, biochemical, and neuropathological abnormalities to those observed in human patients suffering from AMD (2). Previous MRI studies have shown that the magnetization transfer ratio (MTR) and T2 mapping can be used to monitor abnormal myelination in the white matter of AMD cats (3,4), and that MTR can measure improvement in myelination following successful gene therapy (3). However, these imaging modalities are not sensitive enough to detect the difference in gray matter between AMD and normal cats, which is severely affected in the disease (5). More recently, diffusion-weighted (DW)-MRI has been shown to detect abnormalities in both gray and white matter in cats with AMD (4). While MRI methods are useful for detecting gross abnormalities in the diseased brain, these changes are only evident at an advanced stage of the disease (5).
Magnetic resonance spectroscopy (MRS) has been used for assessing tissue and cellular metabolism in vivo (6–9). Although in vivo MRS is often used for detection and characterization of brain tumors (10), the use of MRS in LSDs has been limited (11,12). High resolution NMR spectroscopy of brain extracts and urine samples of cats with AMD has identified resonances from several oligosaccharides, as well as anomeric proton signals from partially degraded mannose moieties using 2D-NMR spectroscopic techniques (13,14). In addition, elevated resonances due to the N-CH3 protons of the Glc-NAc group of oligosaccharides were also observed in those studies (13). The data suggest that in vivo MRS may be sensitive in detecting signature spectra for the disease. Thus, in the present study, in vivo experiments were performed on a feline model of AMD to evaluate the role of MRS in detecting oligosaccharide accumulation as a potential marker for AMD.
MATERIALS AND METHODS
Cats were raised in the animal colony under NIH and USDA guidelines for the care and use of animals in research and the experiments were approved by the Institutional Animal Care and Use Committee of the University of Pennsylvania. Eight normal cats and five cats with AMD were examined. Peripheral blood leukocytes were tested at 1 day of age for the four base pair deletion causing AMD using methods described earlier (15). All affected cats were homozygous for the mutation and all normal cats were homozygous for the normal allele. Imaging experiments were performed when the cats were 16 weeks old. At this age, affected cats show significant whole body tremor, ataxia, and dysmetria such that walking is hindered. Cats were sedated with intravenous ketamine (2.2 mg/kg) and acepromazine maleate (0.1 mg/kg), and were given intravenous atropine sulfate (0.02 mg/kg). Following sedation, cats were anesthetized with intravenous propofol (up to 6 mg/kg), intubated, and maintained under anesthesia with isoflurane for imaging experiments.
In vivo NMR spectroscopy
All MRS exams were performed on a 4.7 T, 50 cm horizontal bore magnet equipped with a 12 cm, 250 mT/m gradient set, which was interfaced to a Varian Inova console (Varian Inc, Palo Alto, CA, USA). A 10 cm inner diameter transmit-receive Litz coil (Doty Scientific Inc., Columbia, SC, USA) was used for transmission and reception. The animal was placed in the magnet with the head positioned in the center of the coil. Core body temperature and heart rate were monitored during data collection using an MRI-compatible vital signs monitoring unit (SA Instruments Inc., Stony Brook, NY, USA). The body temperature was maintained at 37°C by blowing warm air through the magnet bore. Additional temperature regulation was provided by placing a heated water pad under the animal. Initial scout images were acquired in the trans-axial plane using a multi-slice gradient echo sequence (TR/TE/flip angle =150 ms/5 ms/20°). These images were used for selecting two voxels for spectroscopy in each cat. One voxel was selected from the occipital cortex, while the other was selected from the cerebellar vermis. The cerebellar vermis was chosen since body tremor, ataxia, and dysmetria are indicative of cerebellar dysfunction, while occipital cortex is mostly affected in the case of mental retardation in humans. Magnetic resonance spectra were then acquired using a single voxel STEAM spectroscopy sequence with CHESS water suppression pulses. Three CHESS pulses were used before the start of STEAM sequence and one CHESS pulse was used during the mixing time (TM). The following sequence parameters were used for each spectrum, TR =1500 ms, TE =20 ms, TM =40 ms, voxel dimensions 7 ×7 ×7 mm3, number of averages =256. The 7 mm3 voxel was selected to minimize partial voluming effects, while obtaining reasonable signal to noise ratio (SNR). A spectrum without water suppression was also acquired from both voxels.
Tissue extraction
After the end of in vivo MRS experiments, brain tissues were extracted from four normal and two AMD cats for analysis by high resolution NMR spectroscopy. In order to minimize postmortem metabolite degradation, brain biopsies were obtained and snap frozen in liquid N2 (16). The animals were deeply anesthetized, the skull was opened, and tissue samples (100–300 mg) were surgically excised from the cerebellar vermis and the occipital cortex. The samples were immediately frozen in liquid nitrogen and stored at −80°C for further processing. Following surgical biopsy, the animal was euthanized using an overdose of barbiturate and the entire brain was extracted from the skull and stored at −80°C. Frozen biopsy tissues (~200 mg) were ground under liquid nitrogen and homogenized with 6% cold (4°C) perchloric acid (3.25 ml/gm of frozen tissue) using the method described previously (16). The homogenate was centrifuged at 13,000 rpm for 30 min at 4°C. The supernatant was neutralized to a pH of 7.0 ± 0.2 using 3M KOH. The precipitate was removed by centrifugation at 1,000 rpm for 10 min, and the supernatant was stored at −20°C until further processing.
High resolution NMR spectroscopy
The tissue extract was concentrated by lyophilization and the resulting powder was re-dissolved in 0.6 ml D2O and the pD was adjusted to 7.0 ± 0.1. The solution was then placed in a 5-mm NMR tube and a capillary tube containing sodium 3-(trimethylsilyl)-[2,2,3,3,-2H4]-1-propionate (TSP) was inserted to serve as an external reference standard. High-resolution 1H NMR spectra were acquired on a 9.4 T superconducting magnet interfaced with a Bruker DMX400 spectrometer (Bruker BioSpin, Billerica, MA, USA). For 1D spectroscopy, the following parameters were used: 45° flip angle, TR 8.8 s, and 128 averages. A pre-saturation pulse was used to suppress the water signal. The Fourier transformed spectra were analyzed using the XWin NMR program (Bruker, BioSpin, Billerica, MA, USA).
Two-dimensional (2D) total correlated spectroscopy (TOCSY) experiments were performed on two samples from AMD cats to identify peaks originating from oligosaccharides. The TOCSY experiment was performed using a 120 ms MLEV-17 spin-lock pulse during the mixing time. Other sequence parameters included: sweep widths (SW) 1 and 2 of 4.125 kHz (centered at 4.9 ppm), water saturation during the relaxation delay of 1.8 s, 1K data points in the F2 dimension, 112 scans and 256 increments in F1. The acquired data was zero-filled once in the F2 and twice in the F1 dimension. A sine bell squared filter was applied in both dimensions before Fourier transformation.
Data analysis for in vivo spectra
The raw free induction decay signal was line broadened followed by Fourier transformation and phase correction (zero and first order). The resulting frequency domain spectrum was then baseline corrected using a polynomial function. The integrated area of the signal between 1.8 and 2.2 ppm around N-acetyl aspartate (NAA) region and 3.4–4.3 ppm due to oligosaccharide sugar resonances was calculated from the water suppressed STEAM spectra using the MestRe-C program (Mestrelab Research SL, Feliciano Barrera 9B - Bajo, 15706 Santiago de Compostela, Spain). The area of the water signal between 4.4 and 5.0 ppm was calculated from the unsuppressed spectrum. The integrated area of the metabolite signals was normalized to the area of the unsuppressed water signal. The average metabolite to unsuppressed water peak ratio from AMD cats was compared to the metabolite ratios of normal cats using a two tailed Student’s t-test using unequal variance. These metabolite ratios between normal and AMD cats were compared from both the cerebellar vermis and occipital cortex. Results from the extract spectra were compared for the presence/absence of peaks that were observed in the in vivo spectrum.
RESULTS
The in vivo spectrum from all AMD cats exhibited a broad and intense signal in the 3.4–4.3 ppm region which is believed to be primarily due to the presence of mannose-rich sugar protons, with some contribution from glutamine, glutamate, creatine and myo-inositol. This broad resonance signal was observed from the cerebellar vermis as well as the occipital cortex (Fig. 1a and c). The area of the resonance in the 1.8–2.2 ppm region was also elevated in the spectra of AMD cats relative to normal controls (Fig. 1). There were no significant differences (p >0.1) in the peaks at 3.0 (Creatine) and 3.2 ppm (Choline) between normal and AMD cats. The integrated area of the peaks at 1.8–2.2 and 3.4–4.3 ppm, normalized to the unsuppressed water resonance area, was significantly higher in the AMD cat brain than in the normal cat brain, from both the cerebellar vermis and the occipital cortex (Fig. 2). The normalized area ratio at 3.4–4.3 ppm from the cerebellar vermis of AMD cats was 0.23 ± 0.06 while the normal controls had a ratio of 0.03 ± 0.02 (p <0.002, Fig. 2a). In the occipital cortex of AMD cats, this ratio was 0.16 ± 0.07 compared to 0.03 ± 0.03 in the normal cats (p <0.02, Fig. 2b). The area of the signal at 1.8–2.2 ppm also exhibited an increase in the AMD cats. The differences were significant for the spectrum of the occipital cortex region (0.04 ± 0.01) compared to normal cats (0.027 ± 0.01, p <0.05, Fig. 2b), while the resonances from the cerebellar vermis region were not significantly different between the AMD (0.04 ± 0.01) and normal cats (0.027 ± 0.02, p =0.19, Fig. 2a).
Figure 1.

In vivo MR spectra of AMD (a, c) and normal (b, d) cat brains. The spectra were acquired from the cerebellar vermis (a, b) and the occipital cortex regions (c, d) of the brain. Increased resonances due to accumulation of oligosaccharides can be clearly observed from the spectra of AMD cats.
Figure 2.

Normalized signal intensity (peak area/water area ratio) of the resonances at 1.8–2.2 and 3.4–4.3 ppm regions from the cerebellar vermis (a) and occipital cortex (b) regions of normal and AMD cats. A significant increase in signal intensity from AMD animals due to increased oligosaccharides (3.4–4.3 ppm region) and due to NAA +Glc-NAc (1.8–2.2 ppm region) is apparent. * indicates significant differences between the two groups (p <0.01).
The increase in resonances from the carbohydrate region (3.4–4.3 ppm) in the spectra from AMD cats was corroborated by high-resolution NMR spectra of perchloric acid extracts of brain samples taken from two of the AMD cats. Figure 3 shows representative spectra from extracts taken from AMD (Fig. 3a) and normal cats (Fig. 3b). The spectrum from the AMD cat demonstrates elevated multiple resonances from protons attached to the carbon atom with OH group (H-C-OH), including a broad underlying signal in the 3.4–4.3 ppm region in comparison to the spectrum from a normal cat (Fig. 3b). Resonances from anomeric sugar protons were also observed from 4.6–5.4 ppm. These observations are consistent with increased concentrations of oligosaccharides in the AMD cat brain. Due to the complexity and multiplicity of the various sugar protons, it was not possible to individually identify the sugars contributing to these resonances. Figure 4 demonstrates that the increased resonance area around 1.8–2.2 ppm in the in vivo spectra of AMD cats correlated with a substantial increase in the concentration of the N-CH3 protons of the Glc-NAc group of oligosaccharides in extract spectra (peaks 1, 2 and 3). The increased concentration of sugar moieties was further confirmed by the presence of anomeric protons signals from complex sugars in the 5.0–5.4 ppm region of the spectra from AMD cat specimens (Fig. 4a, peaks 4–9), which were not observed in the normal brain spectra (Fig. 4c).
Figure 3.
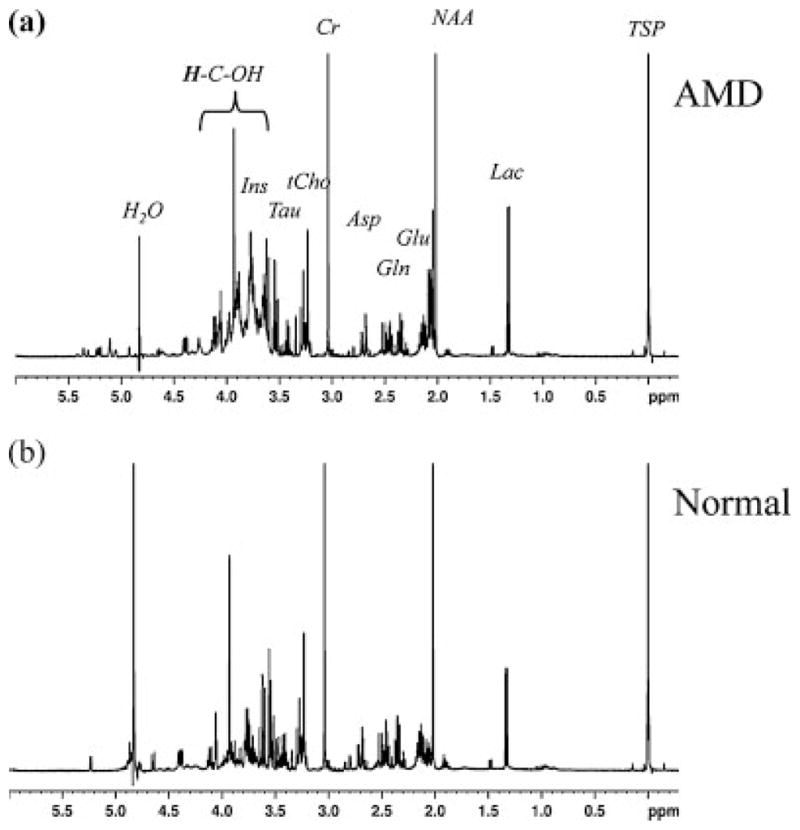
High resolution NMR spectrum of brain extract from occipital cortex of AMD (a) and normal (b) cats. The presence of a broad resonance due to the mannose rich oligosaccharide (H-C-OH) protons is evident from the AMD spectrum. Asp, Aspartate; Cho, Choline; Cr, Creatine; Gln, Glutamine; Glu, Glutamate; Ins, Myo-Inositol; Lac, lactate; NAA, N Acetyl Aspartate; Tau, Taurine; TSP – 3, (trimethylsilyl)-[2,2,3,3,-2H4]-1-propionate.
Figure 4.
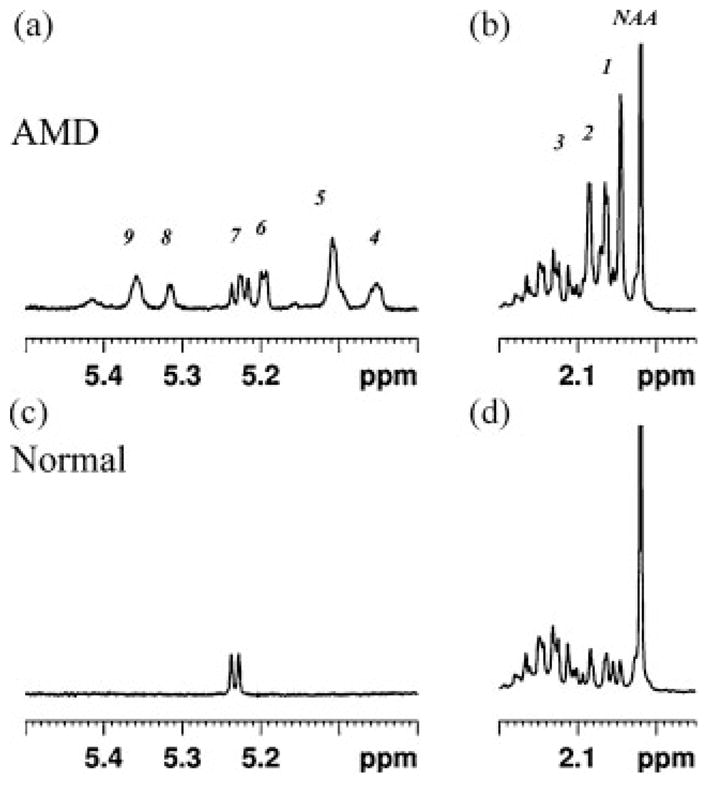
High resolution NMR spectra showing the 1.95–2.2 ppm and the 5.0–5.5 ppm region of the spectra shown in Figure 3. The spectrum from the occipital cortex of AMD cat is shown in (a) and that from the same anatomical region of normal cat is shown in (b). Increased peaks due to the N-CH3 protons of Glc-NAc group of oligosaccharides is clear in the AMD spectrum (peaks 1–3). Additionally the anomeric protons signals from undigested oligosaccharides can also be seen in the AMD spectrum (peaks 4–9), which were not observed from the normal brain spectrum. Chemical shifts (ppm) are: 1 =2.046; 2 =2.063–2.065; 3 =2.085; 4 =5.052; 5 =5.109; 6 =5.193–5.199; 7 =5.217–5.237; 8 =5.314–5.37; 9 =5.359.
In order to confirm the coupling between the carbohydrate ring and anomeric sugar proton resonances, a two-dimensional total correlated spectroscopy (TOCSY) spectrum was acquired from the same sample as that in Figure 3a. The TOCSY spectrum in Figure 5 depicts the presence of multiple cross peaks linking resonances in the 3.4–4.3 ppm region, consistent with the presence of elevated oligosaccharides. In addition, a number of cross peaks were observed connecting this carbohydrate region and the anomeric sugar region from 4.6–5.4 ppm. These data confirmed the presence of elevated oligosaccharides in the AMD spectra.
Figure 5.
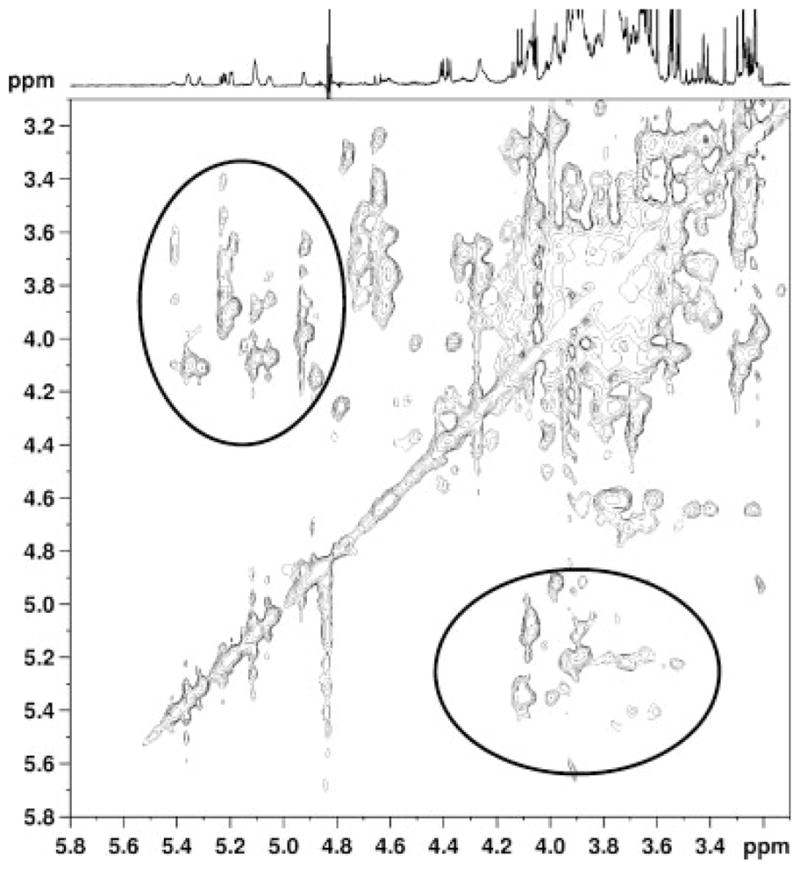
2D-TOCSY spectrum from the of brain extract of an AMD cat. Two prominent groups of cross peaks are observed, those close to the diagonal connecting carbohydrate ring protons in the 3.4–4.3 ppm region, and those connecting the carbohydrate ring protons to the anomeric oligosaccharide protons in the 4.6–5.4 ppm regions (circled).
DISCUSSION
The data presented here show that in vivo proton MR spectra of the cerebellar vermis and occipital cortex of cats affected with AMD display significant increases in resonances in the carbohydrate 3.4–4.3 ppm and 1.8–2.2 ppm regions. 1D and 2D NMR spectra of perchloric acid extracts of the brain demonstrated the presence of increased concentrations of carbohydrates in AMD cats, probably due to mannose-containing sugars. The presence of multiple resonances in the anomeric region of the spectrum is consistent with the accumulation of oligosaccharides. The observation of multiple N-acetyl resonances, which were not due to N-acetylaspartate, suggests the accumulation of methyl groups in N-acetylated sugars, such as Glc-NAc (17,18). Taken together, these data indicate that these resonances can potentially be used as non-invasive biomarkers for detection of oligosaccharide storage present in AMD.
Previous studies have demonstrated an excess of mannose-rich oligosaccharides detected by high resolution NMR in extracts of feline brain tissue and urine samples (13). These studies also reported the presence of additional peaks at 5.2 ppm region from a mixture of oligosaccharides purified from AMD brain, which were identified as anomeric protons from the partially degraded mannose sugars by 2D-spectroscopy (13,14). Thus, the in vitro and in vivo MRS findings are consistent with the known defects in the catabolic pathway of AMD. In our study, we were able to observe the sugar protons in the in vivo spectrum; however, we were unable to detect the anomeric protons in vivo due to their lower concentration and the sub-optimal water suppression observed in vivo.
An increase in signal intensity at 1.8–2.2 ppm region was detected in AMD affected cat brains in vivo. The brain extract obtained from these animals revealed that similar levels of NAA were present in both normal and AMD animals. However, the presence of three additional peaks in the same region was also observed, which have been associated with the N-CH3 protons of Glc-NAc group of oligosaccharides (13). These findings further support our hypothesis that the increase in signal intensity at 1.8–2.2 ppm region, and the broad multiplet peak at 3.4–4.3 ppm of the in vivo spectra is primarily associated with an excess undigested oligosaccharides in AMD cats. Other resonances that can contribute to the 3.4–4.3 ppm region are due to myo-inositol, glutamine, glutamate and creatine. However, as no difference in the CH3 resonance due to creatine at 3.03 ppm and glutamate, glutamine resonances at 2.2–2.4 ppm were observed, we believe that the broad resonance at 3.4–4.3 ppm was due to increased oligosaccharide resonances, which was confirmed by the high resolution spectra. Furthermore, the high concentration of oligosaccharides that was observed in both the cerebellar vermis and the occipital cortex of AMD cats is consistent with the histopathology, which shows storage lesions present throughout the brains of AMD affected cats (3).
The composition of urinary oligosaccharides in the feline model of AMD has been examined using HPLC (19). That study reported that the urine only contained mannose and Glc-NAc, and that the storage products appeared to be different in the bovine model and humans (19). Another study observed slightly elevated N-acetyl aspartate+glutamate (NAA+G)/Cho and myo-Inositol (mI)/Cr ratios in AMD human patients compared to controls, but did not see changes in the NAA/Cr ratios in three siblings with AMD (20). However, our data indicate that the NAA peak seen in vivo could mask small increases in Glc-NAc resonances since they could only be resolved by in vitro analysis. Taken together, the findings suggest that the presence of oligosaccharide resonances in the 3.4–4.3 ppm region in the in vivo MRS spectrum of the brain can be used as a potential biomarker for the lysosomal storage disease in AMD. The finding that all AMD cat brains were clearly distinguishable from the normal age-matched brain indicates that MRS may be useful for following the effects of treatment in individual animals. The ability to detect excess oligosaccharides by MRS may also be useful in other LSDs where oligosaccharides accumulate, as either a major or minor component of the undegraded substrate pool. Besides AMD, undegraded oligosaccharides are found in mucolipidosis types I and II, Schindler disease, β-mannosidosis, alpha-fucosidosis, sialidosis, aspartylglucosaminuria, GM1 gangliosidosis, galactosialidosis, and the Sandghoff variant of GM2 gangliosidoisis (21).
The study is limited by some of the inherent drawbacks of in vivo NMR spectroscopy in particular and NMR spectroscopy in general. In comparison to the high resolution NMR spectra of tissue extracts, the lower resolution of the in vivo spectrum limited the ability to resolve the Glc-NAc resonances from NAA, glutamine and glutamate resonances. The relatively lower quality of the in vivo spectra, in comparison to the high resolution spectra, is due to several factors including differences in the magnetic field strength (4.7T vs 9.4T), tissue heterogeneity leading to increased susceptibility (broader line widths), the field homogeneity (shimming) and the coil loading factor. The lack of general consensus in post processing routines for in vivo NMR spectroscopy results in differences in baseline correction between different studies. These differences may lead to inaccuracies in peak integral values as calculation of peak integrals is highly dependent on optimal baseline correction methods. While these limitations may have contributed to a certain degree of variability, we believe that these limitations are unlikely to affect our observation that the increased oligosaccharide concentration, detected in vivo (3.4–4.3 ppm region), can be used as a potential marker for AMD as this resonance was 5–8 fold larger in AMD cats than in the normal cats.
In summary, the presence of the characteristic resonance observed by spectroscopy may allow direct monitoring of oligosaccharide levels in the brain tissue that will assist in early diagnosis and detection of treatment response to enzyme replacement therapy, bone marrow transplantation, or gene transfer for the neuronal and glial storage present in AMD. The translational potential will rely on future studies of experimental treatments in the animal model, where significant cohorts can be examined to determine the fidelity and sensitivity of the method and to detect correction which can be achieved by gene therapy (22).
Acknowledgments
Contract/grant sponsor: NIH; contract/grant numbers: DK063973; K08-NS02032.
Contract/grant sponsor: Ara Parseghian Medical Research Foundation.
We would like to thank P. O’Donnell and C. Bryan for excellent technical assistance and the P40 Animal Models Core of the WF Goodman Center for Comparative Medical Genetics (NIH-NCRR grant RR002512) for breeding and care of the animals under study. Magnetic resonance studies were performed in the Small Animal Imaging Facility in the Department of Radiology at the University of Pennsylvania.
Abbreviations used
- AMD
alpha mannosidosis
- CHESS
chemical shift selective
- DW
diffusion weighted
- HPLC
high performance liquid chromatography
- KOH
potassium hydroxide
- LSD
lysosomal storage disease
- LAMAN
lysosomal alpha-mannosidase
- MTR
magnetization transfer ratio
- NAA
N-acetyl aspartate
- NIH
National Institutes of Health
- SW
sweep width
- TE
echo time
- TM
mixing time
- TOCSY
total correlated spectroscopy
- TR
relaxation time
- TSP
3-(trimethylsilyl)-[2,2,3,3,-2H4]-1-propionate
- USDA
United States Department of Agriculture
References
- 1.Pierson TM, Wolfe JH. Gene therapy for inherited diseases of the central nervous system. In: Lynch D, editor. Neurogenetics: Scientific and Clinical Advances. Marcel Dekker, Inc; New York: 2005. pp. 43–85. [Google Scholar]
- 2.Sun H, Wolfe JH. Recent progress in lysosomal alpha-mannosidase and its deficiency. Experiment Molec Med. 2001;33:1–7. doi: 10.1038/emm.2001.1. [DOI] [PubMed] [Google Scholar]
- 3.Vite C, McGowan J, Niogi S, Passini M, Drobatz K, Haskins M, Wolfe J. Effective gene therapy for an inherited CNS disease in a large animal model. SO Ann Neurol. 2005;57(3):355–364. doi: 10.1002/ana.20392. [DOI] [PubMed] [Google Scholar]
- 4.Vite CH, Magnitsky S, Aleman D, O’Donnell P, Cullen K, Ding W, Pickup S, Wolfe JH, Poptani H. Apparent diffusion coefficient reveals gray and white matter disease, and T2 mapping detects white matter disease in the brain in feline alpha-mannosidosis. Am J Neuroradiol. 2008;29:308–313. doi: 10.3174/ajnr.A0791. [DOI] [PMC free article] [PubMed] [Google Scholar]
- 5.Vite CH, McGowan JC. Magnetization transfer imaging of the canine brain: a review. Veterinary Radiol Ultrasound. 2001;42:5–8. doi: 10.1111/j.1740-8261.2001.tb00896.x. [DOI] [PubMed] [Google Scholar]
- 6.Kimberley TJ, Lewis SM. Understanding neuroimaging. Physical Ther. 2007;87:670–683. doi: 10.2522/ptj.20060149. [DOI] [PubMed] [Google Scholar]
- 7.Appenzeller S, Costallat LT, Li LM, Cendes F. Magnetic resonance spectroscopy in the evaluation of central nervous system manifestations of systemic lupus erythematosus. Arthritis Rheumatism. 2006;55:807–811. doi: 10.1002/art.22228. [DOI] [PubMed] [Google Scholar]
- 8.Delikatny EJ, Poptani H. MR techniques for in vivo molecular and cellular imaging. Radiologic Clin N Am. 2005;43:205–220. doi: 10.1016/j.rcl.2004.07.004. [DOI] [PubMed] [Google Scholar]
- 9.Bianchi MC, Tosetti M, Battini R, Manca ML, Mancuso M, Cioni G, Canapicchi R, Siciliano G. Proton MR spectroscopy of mitochondrial diseases: analysis of brain metabolic abnormalities and their possible diagnostic relevance. Am J Neuroradiol. 2003;24:1958–1966. [PMC free article] [PubMed] [Google Scholar]
- 10.Chawla S, Poptani H, Melhem ER. Anatomic, physiologic and metabolic imaging in neurooncology. Cancer Treat Res. 2008;143:3–42. doi: 10.1007/978-0-387-75587-8_1. [DOI] [PubMed] [Google Scholar]
- 11.Takahashi Y, Sukegawa K, Aoki M, Ito A, Suzuki K, Sakaguchi H, Watanabe M, Isogai K, Mizuno S, Hoshi H, Kuwata K, Tomatsu S, Kato S, Ito T, Kondo N, Orii T. Evaluation of accumulated mucopolysaccharides in the brain of patients with mucopolysaccharidoses by (1)H-magnetic resonance spectroscopy before and after bone marrow transplantation. Pediatric Res. 2001;49:349–355. doi: 10.1203/00006450-200103000-00008. [DOI] [PubMed] [Google Scholar]
- 12.Vedolin L, Schwartz IV, Komlos M, Schuch A, Azevedo AC, Vieira T, Maeda FK, Marques da Silva AM, Giugliani R. Brain MRI in mucopolysaccharidosis: effect of aging and correlation with biochemical findings. Neurol. 2007;69:917–924. doi: 10.1212/01.wnl.0000269782.80107.fe. [DOI] [PubMed] [Google Scholar]
- 13.Hard K, Mekking A, Kamerling JP, Dacremont GA, Vliegenthart JF. Different oligosaccharides accumulate in the brain and urine of a cat with alpha-mannosidosis: structure determination of five brain-derived and seventeen urinary oligosaccharides. Glycoconjugate J. 1991;8:17–28. doi: 10.1007/BF00731639. [DOI] [PubMed] [Google Scholar]
- 14.Hard K, Spronk BA, Hokke CH, Kamerling JP, Vliegenthart JF. The potency of amide protons for assignments of NMR spectra of carbohydrate chains of glycoproteins, recorded in 1H2O solutions. FEBS Lett. 1991;287:108–112. doi: 10.1016/0014-5793(91)80027-z. [DOI] [PubMed] [Google Scholar]
- 15.Berg T, Tollersrud O, Walkley S, Siegel D, Nillsen O. Purification of feline lysosomal alpha-mannosidase, determination of its cDNA sequence and identification of a mutation causing alpha-mannosidosis in Persian cats. Biochem J. 1997;328:863–870. doi: 10.1042/bj3280863. [DOI] [PMC free article] [PubMed] [Google Scholar]
- 16.Trautschold I, Lamprecht W, Schweitzer G. UV-method with hexokinase and glucose-6-phosphate dehydrogenase. In: Bergmeyer HU, editor. Methods of Enzymatic Analysis. 7. VCH; Weinheim: 1983. pp. 346–357. [Google Scholar]
- 17.Salimath PV, Spiro RC, Freeze HH. Identification of a novel glycosaminoglycan core-like molecule. II. Alpha-GalNAc-capped xylosides can be made by many cell types. J Biol Chem. 1995;270:9164–9168. doi: 10.1074/jbc.270.16.9164. [DOI] [PubMed] [Google Scholar]
- 18.Manzi A, Salimath PV, Spiro RC, Keifer PA, Freeze HH. Identification of a novel glycosaminoglycan core-like molecule. I. 500 MHz 1H NMR analysis using a nano-NMR probe indicates the presence of a terminal alpha-GalNAc residue capping 4-methylumbelliferyl-beta-D-xylosides. J Biol Chem. 1995;270:9154–9163. doi: 10.1074/jbc.270.16.9154. [DOI] [PubMed] [Google Scholar]
- 19.Abraham D, Daniel P, Dell A, Oates J, Sidebotham R, Winchester B. Structural analysis of the major urinary oligosaccharides in feline alpha-mannosidosis. Biochem J. 1986;233:899–904. doi: 10.1042/bj2330899. [DOI] [PMC free article] [PubMed] [Google Scholar]
- 20.Gutschalk A, Harting I, Cantz M, Springer C, Rohrschneider K, Meinck HM. Adult alpha-mannosidosis: clinical progression in the absence of demyelination. Neurol. 2004;63:1744–1746. doi: 10.1212/01.wnl.0000143057.25471.4f. [DOI] [PubMed] [Google Scholar]
- 21.Thomas GH. Disorders of glycoprotein degradation and structure: alpha-mannosidosis, beta-mannosidosis, fucosidosis, and sialidosis. In: Scriver CR, Beaudet AL, Sly WS, Valle D, editors. Metabolic Basis of Inherited Disease. 8. McGraw Hill; New York: 2001. pp. 3507–3533. [Google Scholar]
- 22.Troxel M, Drobatz K, Vite C. Signs of neurologic dysfunction in dogs with central versus peripheral vestibular disease. J Am Veterinary Medic Assoc. 2005;227(4):570–574. doi: 10.2460/javma.2005.227.570. [DOI] [PubMed] [Google Scholar]