Abstract
We show that the transitions which occur between close orders of synchronization in the cardio-respiratory system are mainly due to modulation of the cardiac and respiratory processes by low-frequency components. The experimental evidence is derived from recordings on healthy subjects at rest and during exercise. Exercise acts as a perturbation of the system that alters the mean cardiac and respiratory frequencies and changes the amount of their modulation by low-frequency oscillations. The conclusion is supported by numerical evidence based on a model of phase-coupled oscillators, with white noise and low-frequency noise. Both the experimental and numerical approaches confirm that low-frequency oscillations play a significant role in the transitional behavior between close orders of synchronization.
1 Introduction
Cardiac and respiratory oscillations have been known to interact with each other since the 18th century, when the respiratory modulation of cardiac frequency, or respiratory sinus arrythmia (RSA), was first observed by Hales [1]. Following the introduction of phase synchronization (see [2] references therein) it was found that the cardiac and respiratory oscillations can synchronize, providing a further indication of their interaction [3-6]. Generally, phase synchronization is a phenomenon that can occur in any combination of self-sustained oscillators due to a weak interaction between their phases or frequencies. There have already been many studies of cardio-respiratory synchronization (CRS), not only for subjects at rest [3,4,7] but also e.g. during paced respiration [6,8] and anaesthesia [9-11], which have revealed that synchronization does occur, but only as short epochs in the case of conscious subjects at rest. Toledo et al. [12] confirmed that synchronization is a real cardio-respiratory phenomenon, and not just an artifact.
Although the functional role and precise physiological basis of cardio-respiratory interactions are still being revealed [13], it has been shown that this interaction changes between different states, such as during anæsthesia [14]. Phase-transition-like phenomena in synchronization have been shown to occur in rats as their depth of anæsthesia varies [9]. Furthermore, experiments such as [4,7], in which synchronization in resting subjects is more pronounced in athletes [7] than in non-athletes [4], may imply that synchronization analysis can give useful information about the health of an individual. The complete lack of synchronization in a critically ill coma patient [5] is consistent with this idea. More importantly, subsystems can go through changes even in an apparently steady state. The transitions between different orders of synchronization can potentially yield information about the couplings and their evolution with time. However, to our knowledge, the underlying mechanisms of transition have not yet been investigated.
In this paper, we show that even during a steady state, such as in repose, cardio-respiratory phase transitions exist and changes occur between close orders of synchronization ratios. Exercise not only perturbs the oscillators but also their interactions, which manifest as a temporary reduction in synchronization. The cardiac and respiratory frequencies were extracted from ECG and respiration signals by use of the marked events [4]. The analysis was based on the phase dynamics approach introduced by Kuramoto [15] and its subsequent applications to synchronization analysis [2-4,16,17]. We use the cardio-respiratory synchrogram to provide an illustration of regions of phase synchronization, and synchronization indices to test the apparent synchronization epochs and their transitions. Wavelet analysis is then used to determine the lower frequency components modulating the cardiac and respiratory frequencies, and their associated energies [18]. Finally, using a phase-coupled model with low-frequency noise, we show that synchronization transitions are mainly due to the presence of low-frequency fluctuations resulting from the activity of lower frequency oscillatory components.
2 Data Collection
2.1 Subjects
Signals were obtained from 10 healthy volunteers, aged 20-30 years. The procedure was explained to each subject and written consent was obtained. All were requested not to eat or drink caffeine-containing drinks at least 2 hours before the time of the measurements, and not to drink alcohol from the night before.
2.2 The experiment
Signals were recorded simultaneously using non-invasive sensors. The cardiac signal was obtained from a 3 lead ECG system, and the respiration signal by means of a piezo-resistive sensor attached to a fabric strap placed around the thorax, and both were stored after passage through a signal conditioning unit (Cardiosignals, Jožef Stefan Institute, Ljubljana, Slovenia). Initially, the volunteers lay down on a bed in a relaxed position and signals were recorded for 30 minutes at rest (RE). Subjects then immediately moved to a semi-recumbent exercise bike (Vision, R2100) and performed exercise (EX) at approximately 60 rpm. They were asked to approximately maintain this velocity by monitoring the LCD display of the bike. A constant effort was set at 50 Watts, maintained automatically to compensate for changes in the pedalling rpm.
Movement artifacts in the signals were reduced by using the back rest on the bike to keep the upper body as still as possible for the duration of the exercise. Exercise continued for 30 minutes, and signals were recorded throughout. The subjects then moved back to the bed and signals were recorded for a further 30 minutes after exercise (AE). There was a ~1-2 minute interval between the different states, whereupon recording was interrupted, however, neither ECG electrodes nor the respiration sensor were removed during this time to ensure they remained in the same positions. The tension in the respiratory belt usually had to be adjusted to allow for the deeper breathing associated with exercise, and subsequently for the shallower breathing afterwards. This was calibrated before recording recommenced.
2.3 Recordings
The sampling frequency for the simultaneous measurements was 400 Hz. To remove noise artifacts a moving average filter was applied to both signals, allowing isolation of the required frequency regions for observation.
2.4 Instantaneous frequencies
R-R intervals in the ECG were used as markers for the phase of the heart. As the respiration belt effectively measured the changes in volume of the thorax, a sine-like pattern was produced, and maxima were used as event markers for respiratory cycles. The time for one cycle of each oscillator was taken as the time between two consecutive peaks. From this, the instantaneous frequencies of both signals were calculated where tk is the time of the kth peak.
3 Methods of investigation
3.1 Synchronization analysis
Generally, synchronization can be seen as the appearance of a relationship between the states of two interacting systems. This can be manifested as phase locking which, for nonlinear oscillations, is given by |n 1 − m
1 − m 2 − δ| < const where n and m are both integers,
  1 and
1 and  2 are the phases of the oscillators, and δ is some average phase shift. The rhythms are said to be n:m locked when n periods of one oscillator have exactly the same interval as m periods of the second oscillator. The frequency ratio of the two oscillators gives a good indication of possible intervals of synchronization; even when the instantaneous frequencies of the two systems seem strongly variable, it is possible that the two may be fluctuating together, which would be apparent if their ratio around that time was constant.
3.1.1 The cardio-respiratory synchrogram
The cardio-respiratory synchrogram (or phase stroboscope) is a visual tool that may be used for detecting periods of synchronization between heart rhythm and respiration [3, 2]. The synchrogram is created such that one observes the phase of one oscillator not just periodically in time, but relative to the actual cycle of the other (slower) oscillator. If these times are denoted tk, and the value at this time is θ =  1(tk) mod 2π, a synchrogram can be produced by plotting Ψ(tk) vs tk, where
| (1) |
For perfect noiseless n:m synchronization, Ψ(tk) attains a fixed value of θ for m respiratory cycles. Hence the synchrogram will produce n horizontal lines that can generally be identified visually.
3.1.2 Synchronization indices
We calculated Ψn,m =  n,m mod 2π, the normalized relative phase, directly from the measured data, exploiting the fact that both signals contain sharp peaks that clearly mark the instantaneous cycles. The instantaneous phase is then
| (2) |
where tk is the time of the kth marker event. The distribution of Ψn,m is then a δ function, smeared in the presence of noise. Since in noisy systems phase synchronization can be understood in a statistical sense as the existence of preferred values of generalized phase difference, measures based on quantifying the distribution of phases η =  2 mod 2πn|
 1 mod 2πm were proposed. We use an index based on conditional probability which was introduced in [16] and was shown to facilitate reliable detection of synchronous epochs of different order n:m [19, 6]. Accordingly, the phase of the second oscillator is observed at fixed values of the phase of the first oscillator, θ. The interval of each phase
  1 and
1 and  2, [0, 2πm) and [0, 2πn) respectively, is divided into N bins. The values of
  1 mod 2πm that belong to bin l are denoted as θl, while the number of points inside this bin is denoted as Ml, and Ml values of ηj,l, j = 1, … , Ml, are calculated. If there is no synchronization between the oscillators, a uniform distribution of ηj,l can be expected on the interval [0, 2πn), or else it clusters around a certain value resulting in a unimodal distribution. Hence, for each bin the distribution is quantified as for each j when
  1(tj) belongs to the lth bin and tk − tp/2 ≤ tj < tk + tp/2. Ml(tk) is the number of points in this bin at the kth instant. An average over 6 periods for 1:n, and 8 periods for 2:n, tp, of the slower oscillator was used. Where the phases are completely locked, or completely unlocked we obtain |rl(tk)| = 1 or |rl(tk)| = 0, respectively. To improve reliability, we also calculate the average over all bins and obtain the index of synchronization .
Accordingly, λn,m is a measure of the conditional probability that  2 has a certain value within the lth bin when
  1 belongs to this bin. Synchronization can occur in several regimes, switching from one index to another with time. The indices are found by trial and error, although a good indication of where the regimes occur can be obtained from the frequency ratio of the two oscillators. A frequency ratio of would indicate m:n indices of 1:4. As we mentioned before, perfect synchronization appears when the value of the index = 1, and is zero when there is no synchronization. However, in a noisy system such as with cardio-respiratory interactions, perfect synchronization is rarely seen. Hence a high index value close to 1 is used as an indication of synchronization. For this investigation, only values above 0.95 were considered (i.e. within 5% of perfect synchronization). We sum all the intervals during which the indices meet these criteria and refer to the result as the synchronization time.
3.2 Time-frequency analysis using wavelet transform
Frequency analysis can give information about the signals modulating a rhythm. Whereas Fourier analysis gives good frequency information for a stationary signal, a broadening of peaks is seen if the signal is time variant, as with respiratory and cardiac signals. Also, there is a trade-off between frequency and localization resolution, as governed by the uncertainty principle. Wavelet analysis provides frequency component information of a signal with time. We use a Morlet mother wavelet as it is a Gaussian function and allows for the best time-frequency localization the uncertainty principle will allow. There is also a straightforward inverse relationship between frequency and the scale f = 1/s. A Morlet mother waveform is given by
| (3) |
This is scaled (stretched and compressed) by some factor s
| (4) |
to create wavelets that are compared in time to the original signal (p = −1). The wavelet transform is a convolution of the wavelet and the time series
| (5) |
Hence, for every wavelet at each moment in time a coefficient is obtained, representing the strength of correlation between wavelet and original signal. Thus a high coefficient for a small-scale wavelet at a given moment in time corresponds to the presence of a high frequency component at that time.
The total energy of the signal can be calculated as
| (6) |
where the constant C is determined by the shape of the wavelet. Therefore, can be interpreted as the energy density of the signal in the time scale plane [18].
4 Results
4.1 The effect of exercise on cardiac and respiratory rates
As expected, exercise caused an increase in both cardiac and respiratory frequencies as compared with the resting state (Table 1). During exercise the cardiac frequency usually increased significantly over the course of several minutes, generally reaching a plateau after 10 – 20 minutes. After exercise there was a period (< 10 mins) during which heart rate decreased to a level similar to that observed before exercise. A similar trend was generally not seen in respiration, which was already at its resting value when measurements recommenced.
Table 1.
Subject characteristics, HR and RR are average heart and respiration rate (in Hz) respectively
| RE | EX | AE | |||||
|---|---|---|---|---|---|---|---|
|
| |||||||
| Subject (Gender) | HR | RR | HR | RR | HR | RR | Age |
| 1 (F) | 1.21 | 0.24 | 2.24 | 0.39 | 1.26 | 0.24 | 26 |
| 2 (M) | 1.02 | 0.22 | 1.57 | 0.33 | 1.04 | 0.25 | 21 |
| 3 (M) | 1.23 | 0.32 | 1.80 | 0.41 | 1.31 | 0.35 | 29 |
| 4 (F) | 1.47 | 0.30 | 2.31 | 0.43 | 1.50 | 0.30 | 28 |
| 5 (F) | 1.23 | 0.38 | 2.01 | 0.46 | 1.21 | 0.36 | 21 |
| 6 (M) | 1.05 | 0.29 | 1.77 | 0.51 | 1.07 | 0.29 | 20 |
| 7 (M) | 1.11 | 0.29 | 2.13 | 0.43 | 1.16 | 0.27 | 20 |
| 8 (M) | 1.06 | 0.29 | 1.94 | 0.46 | 1.21 | 0.28 | 21 |
| 9 (M) | 0.99 | 0.28 | 1.54 | 0.40 | 0.92 | 0.16 | 22 |
| 10 (F) | 1.13 | 0.27 | 2.54 | 0.48 | 1.24 | 0.26 | 30 |
|
| |||||||
| Median | 1.12 | 0.29 | 1.98 | 0.43 | 1.21 | 0.28 | 22.5 |
The instantaneous cardiac frequency, or heart rate variability (HRV), varied less during exercise than before, as can be seen in Fig. 1; see also Fig. 4 below and associated discussion. After exercise, the variability increased to approximately the same amount as before. The reduction of variability during exercise suggests that there is less “external” modulation of heart rate from other processes within the cardiovascular system. Conversely, the variation in respiratory rate variability (RRV) appears to increase with the onset of exercise: breathing was at a much steadier pace at rest than during exercise. These two effects show that exercise creates an observable perturbation of the phase dynamics of the system.
Fig. 1.
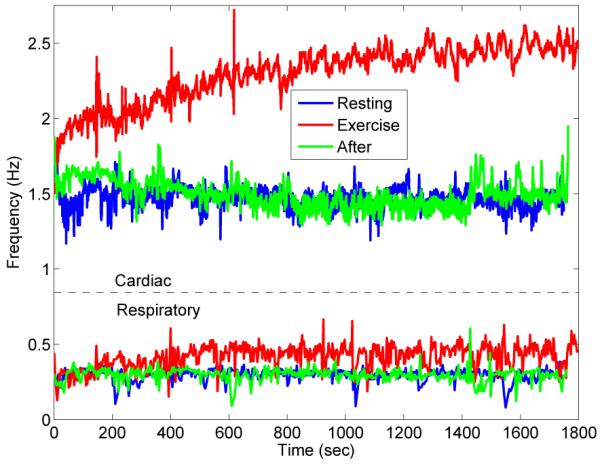
An overview of instantaneous frequencies of cardiac (upper) and respiratory (lower) signals for subject 4 (RE, EX and AE). Notice the obvious increase in cardiac and respiratory instantaneous frequencies. Also note the visible reduction in variability of the cardiac signal, and the increase in variability of the respiratory signal.
Fig. 4.
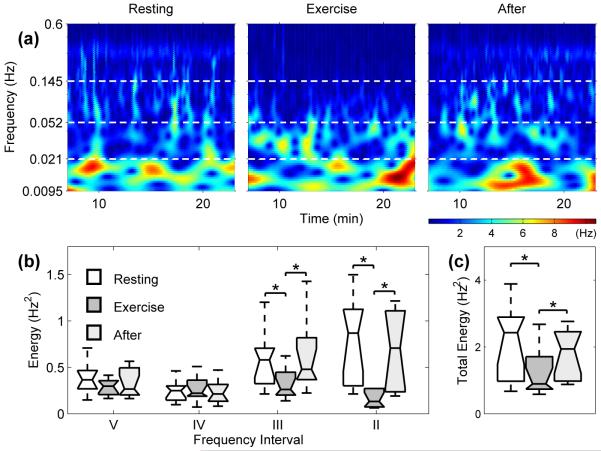
(a) Wavelet transform showing the time-frequency domain of the HRV for subject 4 during RE, EX and AE. For all 10 subjects we have (b) box plots showing the energy of the wavelet transforms of HRV in different intervals (see Table 2) and (c) the total energy within the interval 0.0095 – 0.6 Hz. The horizontal lines of the box plots indicate the 10th, 25th, 50th, 75th and 90th percentiles, with outliers not plotted. Significant changes of p < 0.05 are denoted by *.
4.2 Synchronization
Synchronization indices evaluated for a typical subject are shown in Fig. 2, revealing epochs of synchronization at different n:m orders. Surrogate data were used to test the reliability with which synchronization could be identified: one hundred different surrogate realizations were created by shuffling the instantaneous cardiac and respiratory frequencies for each subject. Evidence for synchronization was then sought in the shuffled signals and compared with the real data. The results in Fig. 3 show very significant differences between the real and shuffled signals for all three states (RE, EX and AE). At RE, synchronization was observed for all subjects. Taking subject 4 as an example (Fig. 2) three different orders of synchronization, 2:9, 1:5 and 2:11, are clearly present during RE and AE, with transitions occurring between them. We rarely see a discontinuous jump i.e. from 2:9 to 2:11, but rather a smooth transition whereby 1:5 is reached before going to 2:11 or returning to 2:9. This trend appears for all subjects showing that, despite the nonlinearity in the dynamics of HRV and RRV, the synchronization ratios change between close orders.
Fig. 2.
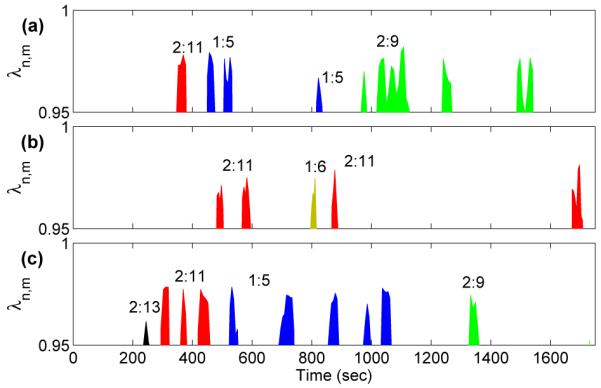
Synchronization epochs in subject 4 (a) before, (b) during and (c) after exercise. The criterion for synchronization is that the synchronization index should exceed 0.95, and the duration of the episode should be greater than 20 seconds. For details see text.
Fig. 3.
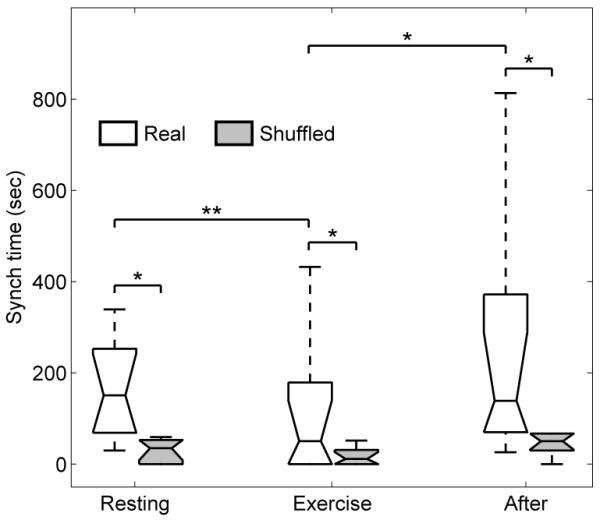
The total synchronization times for all subjects. The synchronization time decreases significantly during EX and increases again AE. The results are compared with synchronization times computed from shuffled data, demonstrating the reliability of the synchronization episodes (* represents p < 0.05 and ** represents p < 0.01).
As we shall see, these transitions are attributable to the influence of lower frequency oscillatory components on the phases of cardiac activity and respiration. We emphasize that cardio-respiratory synchronization does not occur continuously at a fixed frequency ratio. The cardio-respiratory system is thermodynamically open and the external influences on it can be perceived as noise (see below) that sometime destroys the synchronization [3,9,19]. Consistent with earlier work [20], the short epochs of synchronization (Fig. 2) are separated by longer intervals of apparent non-synchronization. Note that the analysis was done for n ≤ 2 using the relatively strict criteria as described in Sec. 3.1.2. It is possible that intervals without synchronization are on account of transitions between synchronization ratios or synchronization is not detected because n ≥ 3 was not considered due to reliability.
It is clear from Figs. 2 and 3 that synchronization is markedly decreased during EX and is of a higher n:m order. For AE, we usually see these higher orders for the first few minutes before switching down to the lower orders observed at rest.
4.3 Modulation analysis by wavelets
HRV and RRV can be considered as two interacting oscillators with time-variable frequencies. Wavelet analysis was carried out on both the HRV and RRV in order to reveal how their frequencies are modulated in time, i.e. which lower frequencies are responsible for the fluctuations in the cardiac and respiratory rhythms seen in Fig. 1.
4.4 Time-frequency analysis of cardiac frequency
Wavelet analysis of HRV reveals the existence of many modulating frequencies. For example, we see very clearly a frequency between 0.145 and 0.6Hz throughout (Fig. 4(a)), corresponding to respiration and showing clearly the modulation of heart rate by respiration. The modulation is a manifestation of RSA. During EX this modulation becomes much less apparent, and is correspondingly of a lower energy, while AE we see a return of the modulation.
Cardiovascular signals can be divided into frequency intervals, each relating to a specific physiological activity and containing a corresponding spectral peak. Here we split the signal into 4 frequency intervals (Table 2). For details of the frequency intervals, see [18,21] and references therein. This allows us to determine the origins of the various spectral components in the modulation. Frequency and amplitude wandering cause a broadening of the frequency peaks, due to couplings between the other oscillatory processes. Energies were calculated separately for these frequency intervals to compare the dynamic changes between the states. A ranked sum statistical test was applied, performed at a p = 0.05 significance level. Hereafter p1,2 refers to the change between RE and EX, p1,3 the changes between RE and AE, and p2,3 the change between EX and AE. The results were then plotted as box plots (Fig. 4(b)). The total energy across all four frequency intervals (Fig. 4(c)) shows how the modulation of HRV decreases during EX, accounting for the reduction in variability seen in Fig. 1.
Table 2.
Frequency domains (Note the omission of region I, relating to cardiac activity, as the frequency of an oscillator can not be modulated by itself or anything of higher frequency)
| Frequency band (Hz) | Related Activity | |
|---|---|---|
| II | 0.145 - 0.6 | Respiration |
| III | 0.052 - 0.145 | Myogenic |
| IV | 0.021 - 0.052 | Neurogenic |
| V | 0.0095-0.021 | Endothelial |
During EX, there is a marked decrease in the absolute energy of regions II and III, relating to respiratory (p1,2 and p2,3 < 0.05) and myogenic (p1,2 and p2,3 < 0.05) activity respectively. This myogenic activity originates in the vascular smooth muscle that is also involved in the regulation of blood pressure. In addition, the capillaries dilate to regulate heat transfer during EX and could contribute to the observed reduction in energy. Respiration seems to play a less significant part in the modulation of heart rate during EX, in agreement with previous studies of HRV [22]. Within intervals II–V, there is no statistically significant difference between the energies in RE and AE (p1,3 > 0.05).
One contributory factor to the reduction in energy could be the introduction of another oscillatory process, namely locomotion, with which the heart and respiratory functions interact [23,24]. The reduction in the contribution to HRV from respiration during EX, as evident from the significantly reduced energy, would suggest that the coupling between cardiac and respiratory processes is weakened during EX, and hence we would see less synchronization. We would not, however, expect a complete disappearance of synchronization, as there still remains some modulation during EX.
4.5 Time-frequency analysis of respiratory frequency
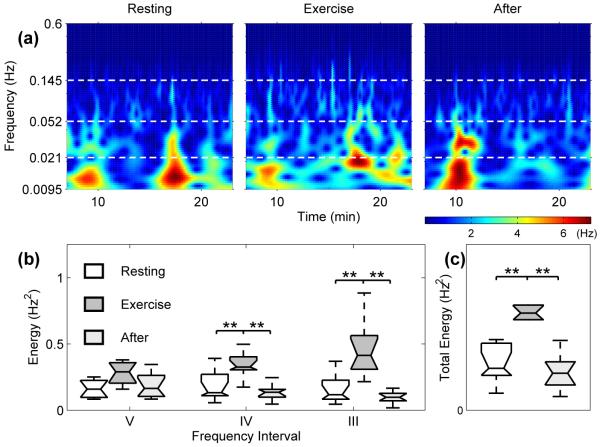
Wavelet analysis was also carried out on RRV in the same manner (Fig. 5). During EX, the absolute energy of the wavelet transform of RRV across the whole observed spectrum increased with the onset of EX (p1,2 and p2,3 < 0.01). This accounts for the increased variability in respiratory frequency seen in Fig. 1, as opposed to the decrease in HRV. It would seems that it is this increased variability of respiration, together with the reduction in external influence on cardiac frequency, that is destroying the synchronization epochs.
Fig. 5.
(a) Wavelet transform showing the time-frequency domain of the RRV for subject 4 during RE, EX and AE. For all 10 subjects we have (b) the energy content of the wavelet transforms for the various frequency intervals and (c) the energy of the respiration wavelet transforms between 0.0095 – 0.145 Hz.
The origin of this overall increase in absolute energy is the neurogenic-related activity band and the myogenic frequency component (all p1,2 and p2,3 < 0.01). There was no significant change in the endothelial-related activity.
5 A model for the results
It is clear from Fig. 2 that the perturbation caused by exercise reduces epochs of synchronization. Our wavelet analysis showed that the modulation of heart rate by respiration is reduced during EX, an effect that is short-lived in the recovery period AE. The reduction in synchronization epochs agrees with the drop in energy found in the frequency spectrum of HRV relating to respiration during EX, so that we have less interaction between the two oscillators. So, the questions raised here are (i) why the transitions between close orders of synchronization occur and (ii) can we account for the differences between resting and exercise?
To answer these questions, we begin by reviewing and generalizing the phase dynamical model of two interacting oscillators. If we have a small coupling ε between our two self-sustaining systems, namely the heart and respiration, we can derive closed equations for the phases [25,15]. Hence we investigate two interacting oscillators, X1 and X2, representing the cardiac and respiratory oscillations respectively
| (7) |
We do not assume any similarity between the two interacting systems. As it is well known that a perturbation in respiration will change HRV more than a similar perturbation in HRV will change respiration[10,26,27], the coupling between the two should be asymmetric. The only assumption we make is that the autonomous dynamics given by the functions f1,2 can be separated from the interaction described by generally different terms p1,2 multiplying the coupling constant ε.
For self-sustained systems there exists a motion whose amplitude neither grows nor decays, and the motion is said to approach a limit cycle. By setting the coupling constant ε to zero, the system is said to achieve a stable limit cycle of frequency ω1,2. Hence we can introduce two phases on the cycles and their vicinities,
| (8) |
In general, the frequencies ω1 and ω2 are incommensurate, so that the motion of the uncoupled oscillators is quasi-periodic. If we assume that for a weak coupling the perturbations in amplitude are small, in the first approximation we can write the equation for phases [?] in coupled a system as
| (9) |
where the functions Q1,2 are 2π periodic. Q1,2 can be represented as a double Fourier series
| (10) |
In the zeroth approximation, the phases rotate with natural frequencies and in Q1,2 all terms correspond to fast rotations, with the exception of those satisfying the resonant condition kω1 + lω2 = δ ≈ 0. Assuming that the two natural frequencies ω1,2 are nearly in resonance, then . Therefore all the terms in the Fourier series with k = nj and l = −mj are resonant and contribute to the averaged equations. One can then obtain Qi → qi(n 1 − m
1 − m 2) where qi are the resonant terms of summations (10). More generally, there are other terms like qi (with different arguments) which contribute to summations (10).
It is evident from Figs. 4 and 5, there are many oscillatory components interacting with the heart and respiration. While the physiological origin of the oscillations contributing to HRV has been extensively studied, there is no report to date on the possible mechanisms of oscillations in RRV. However, most of the oscillations propagate through the CVS, so for RRV we consider the same frequency intervals identified by wavelet analysis of other signals such as blood flow and HRV (Table 2) [18,21]. Note that the respiratory interval and any higher frequency do not appear in the wavelet transform of RRV due to the construction of instantaneous frequencies.
We therefore regard CVS signals as containing two oscillating components originating from cardiac and respiratory activity, together with colored noise representing various other oscillatory processes and some interactions between each system. When focusing on cardio-respiratory interactions, therefore, we treat everything else that may have some interaction with our two systems, cardiac and respiratory, as “noise”. However, through spectral analysis we can determine the contribution of the rest of the CVS to the modulation of these two systems. Currently, the full extent of all the interactions is undetermined. We do not have enough information about the couplings (such as the direction and strength of the couplings) to investigate all possible interactions in our phase-coupled model, so we investigate them as low-frequency noise
| (11) |
where ηi(t) represent low-frequency noise of variance σηi . A sequence of values ηi(t) is produced by Fourier filtering [28]. This method is based on a transformation of the Fourier components {u(k)} of a sequence {u(t)} which are uncorrelated random numbers with a Gaussian distribution. A sequence of ηi(k) is generated for a given α using the formula: ηi(k) = k−(2α−1)/2u(k) = k−β/2u(k). Inverse Fourier transformation of the sequence ηi(k) leads to ηi(t). It consists of random variables, spatially correlated with spectral density
with Gaussian distribution. The exponent α is called the correlation exponent, and quantifies the degree of correlation imposed on the system. Note that the case α = 0.5 (or β = 0) corresponds to uncorrelated disorder (white noise), while the case α > 0.5 indicates positive correlation. We note that the sequences produced by this method are normalized, so that the mean value of ηi(t) is set to zero and its variance is fixed at σηi. In Fig. 6 and 7 we have two different cases, β = 0 and β = 1, corresponding to white and correlated noise respectively, together with their wavelet transforms. For β = 0 (white noise) wavelet analysis shows fluctuations around a constant value for the whole range of frequencies. However, for β = 1 (correlated noise), the wavelet amplitude increases for lower frequencies. Therefore, low-frequency noise is a good candidate for approximating the other oscillatory components e.g. myogenic, neurogenic and endothelial.
Fig. 6.
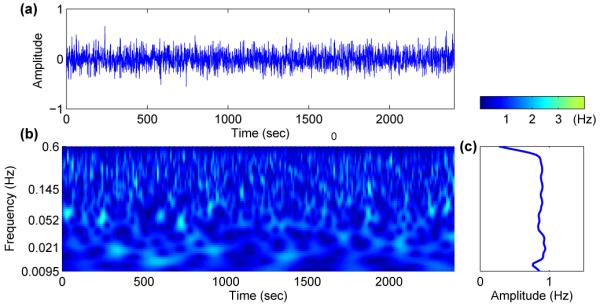
(a) White noise and (b) its wavelet transform. The time average of the wavelet (c) shows fluctuation around 1 for all frequencies.
Fig. 7.
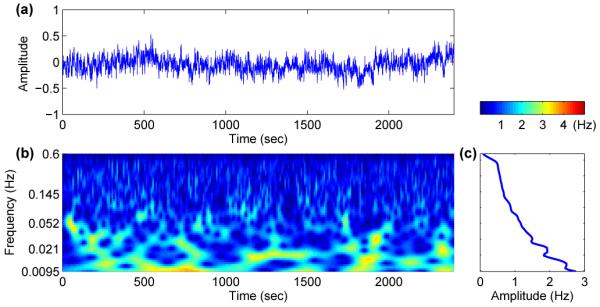
(a) Low-frequency noise and (b) its wavelet transform. Unlike white noise the time averaged wavelet (c) increases for lower frequencies.
We now use this model to see if it can illuminate the questions raised in the discussion. To parameterize it we have used the median values of cardiac and respiration frequencies at rest for the 10 subjects (i.e. from Table. 1, the median value of cardiac frequency is ω1 = 1.12Hz and for respiration frequency is ω2 = 0.29Hz). Next we need to deal with the couplings between the cardiac and respiration phases, . It is already established from the results of methods specifically developed for detecting the coupling directionality of interacting phases [26,27,29-31], and with direct physiological observations, that respiration drives the heart more than the reverse. Moreover, these coupling terms should have perturbation characteristics comparable to natural frequencies ω1,2. An appropriate choice is therefore and . We have also set ση1 = 0.22 and ση2 = 0.1.
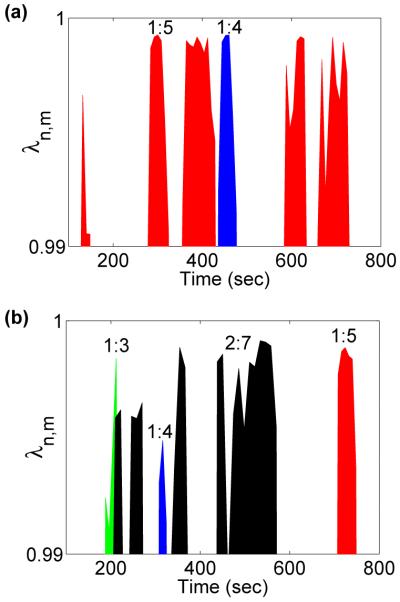
Starting with Eq. (11) we construct two phase series and then calculate their synchronization episodes (8) for β = 0 and β = 1. The results are shown in Figs. 8 (a) and (b). For the β = 0 case, there are episodes of synchronization separated by intervals of apparent non-synchronization, but almost no transitions to different synchronization indices. For β = 1, however, we see synchronization with several different indices. These results suggest that transitions between the different cardio-respiratory synchronization indices originate via couplings to lower frequency oscillatory components i.e. the myogenic, neurogenic and endothelial oscillations (see Table 2).
Fig. 8.
Synchronization epochs derived from phase coupled with white noise (a) and low-frequency noise (b) during RE. In the white noise case, we have very few transitions between synchronization indices, whereas in the low-frequency noise case, the transitions between close synchronization indices occur more often.
This model can also easily be applied to the EX regime. EX brings about many physiological changes as we can see from the experimental data that must be regulated by both the cardiovascular and respiratory systems. The muscles and various organs have a greater demand for oxygen and nutrients from the blood, increasing both cardiac and respiratory output, and hence their frequencies. Taking this into account, we have increased the model cardiac frequency from 1.13Hz (the median during RE) to 1.85 Hz (the median during EX) and respiration frequency from 0.29 Hz to 0.42Ḣz. Fig. 8 shows the synchronization indices during EX derived numerically for and , ση1 = 0.22 and ση2 = 0.14. In agrement with experimental results, the synchronization is markedly decreased during EX. This is due to the change in variation of respiration (see Fig. 1) which makes the system noisier and reduces our chance of having synchronization, even though the variability of cardiac activity is reduced during EX. In fact, this observation confirms that respiration plays the major role in cardio-respiratory synchronization. The synchronization that appeared during EX is clearly of a higher n : m order, corresponding to the fact that cardiac frequency has increased proportionally more than respiration frequency.
6 Summary and conclusion
In summary, there are differences between cardiovascular oscillations during exercise, as compared to the resting states before exercise and afterwards. In all cases, episodes of cardio-respiratory synchronization occurred, separated by intervals of apparent non-synchronization. Synchronization during EX tended to be of higher order, presumably on account of the larger frequency ratio, and the synchronization time (integrated duration of episodes) was smaller. The occurrence of transitions between synchronization states of different order and non-synchronization is attributable to the modulation of the cardiac and respiratory frequencies by lower-frequency components coming from e.g. myogenic, neurogenic and endothelial processes. The reduced HRV during exercise, despite the increased RRV, is taken to imply that the strength of the cardio-respiratory interaction is reduced in EX. The observed synchronization phenomena were reproduced using a simple numerical model in which the lower frequency processes were lumped together as a form of low-frequency coloured noise.
Acknowledgements
The research was supported in part by EPSRC, the FP6 EU NEST-Pathfinder project “BRACCIA”, the Wellcome Trust (UK), and the ARRS (Slovenia).
Footnotes
PACS. 05.45.Xt Synchronization; coupled oscillators – 87.19.ug Heart and lung dynamics – 87.18.Tt Noise in biological systems – 05.45.Tp Time series analysis
References
- 1.Hales S. Statistical Essays II, Hæmastatisticks. Innings Manby; London: 1773. [Google Scholar]
- 2.Pikovsky A, Rosenblum M, Kurths J. Synchronization – A Universal Concept in Nonlinear Sciences. Cambridge University Press; Cambridge: 2001. [Google Scholar]
- 3.Schäfer C, Rosenblum MG, Kurths J, Abel HH. Nature. 1998;392(6673):239. doi: 10.1038/32567. [DOI] [PubMed] [Google Scholar]
- 4.Lotrič MB, Stefanovska A. Physica A. 2000;283(3-4):451. [Google Scholar]
- 5.Stefanovska A, Bračič Lotrič M, Strle S, Haken H. Physiol. Meas. 2001;22(3):535. doi: 10.1088/0967-3334/22/3/311. [DOI] [PubMed] [Google Scholar]
- 6.Stefanovska A. Nonlinear Phenomena in Complex Systems. 2002;5(4):462. [Google Scholar]
- 7.Schäfer C, Rosenblum MG, Abel HH, Kurths J. Phys. Rev. E. 1999;60(1):857. doi: 10.1103/physreve.60.857. [DOI] [PubMed] [Google Scholar]
- 8.Rzeczinski S, Janson NB, Balanov AG, McClintock PVE. Phys. Rev. E. 2002;66(5):051909. doi: 10.1103/PhysRevE.66.051909. [DOI] [PubMed] [Google Scholar]
- 9.Stefanovska A, Haken H, McClintock PVE, Hožič M, Bajrović F, Ribarič S. Phys. Rev. Lett. 2000;85(22):4831. doi: 10.1103/PhysRevLett.85.4831. [DOI] [PubMed] [Google Scholar]
- 10.Musizza B, Stefanovska A, McClintock PVE, Paluš M, Petrovčič J, Ribarič S, Bajrović FF. J. Physiol. 2007;580(1):315. doi: 10.1113/jphysiol.2006.126748. [DOI] [PMC free article] [PubMed] [Google Scholar]
- 11.Entwistle M, Bandrivskyy A, Musizza B, Stefanovska A, McClintock PVE, Smith A. Br. J. of Anæsthesia. 2004;93(4):608P. [Google Scholar]
- 12.Toledo E, Akselrod S, Pinhas I, Aravot D. Med. Eng. & Phys. 2002;24(1):45. doi: 10.1016/s1350-4533(01)00114-x. [DOI] [PubMed] [Google Scholar]
- 13.Eckberg DL. J. Physiol. (Lond.) 2003;548(2):339. doi: 10.1113/jphysiol.2003.037192. [DOI] [PMC free article] [PubMed] [Google Scholar]
- 14.Galletly DC, Larsen PD. Brit. J. Anæsth. 1997;79(1):35. doi: 10.1093/bja/79.1.35. [DOI] [PubMed] [Google Scholar]
- 15.Kuramoto Y. Chemical Oscillations, Waves, and Turbulence. Springer-Verlag; Berlin: 1984. [Google Scholar]
- 16.Tass P, Rosenblum MG, Weule J, Kurths J, Pikovsky A, Volkmann J, Schnitzler A, Freund HJ. Phys. Rev. Lett. 1998;81(15):3291. [Google Scholar]
- 17.Glass L. Nature. 2001;410(6825):277. doi: 10.1038/35065745. [DOI] [PubMed] [Google Scholar]
- 18.Stefanovska A, Bračič M. Contemporary Phys. 1999;40(1):31. [Google Scholar]
- 19.Mrowka R, Patzak A, Rosenblum M. Int. J. Bifurcation and Chaos. 2000;10(11):2479. [Google Scholar]
- 20.Bartsch R, Kantelhardt JW, Penzel T, Havlin S. Phys. Rev. Lett. 2007;98:054102. doi: 10.1103/PhysRevLett.98.054102. [DOI] [PubMed] [Google Scholar]
- 21.Lotrič MB, Stefanovska A, Štajer D, Urbančič-Rovan V. Physiological Measurement. 2000;21:441. doi: 10.1088/0967-3334/21/4/302. [DOI] [PubMed] [Google Scholar]
- 22.Cottin FO, Medigue C, Lepretre PM, Papelier Y, Koralsztein J, Billat V. Medicine and Science in Sports and Exercise. 2004;36(4):594. doi: 10.1249/01.mss.0000121982.14718.2a. [DOI] [PubMed] [Google Scholar]
- 23.Nomura K, Takei Y, Yanagida Y. European Journal of Applied Physiology. 2003;89(3–4):221. doi: 10.1007/s00421-002-0784-0. [DOI] [PubMed] [Google Scholar]
- 24.Morin D, Viala D. Journal of Neuroscience. 2002;22(11):4756. doi: 10.1523/JNEUROSCI.22-11-04756.2002. [DOI] [PMC free article] [PubMed] [Google Scholar]
- 25.Malkin IG. Some Problems in Nonlinear Oscillation Theory. Gostechizdat; Moscow: 1956. [Google Scholar]
- 26.Paluš M, Stefanovska A. Phys. Rev. E. 2003;67:055201(R). doi: 10.1103/PhysRevE.67.055201. [DOI] [PubMed] [Google Scholar]
- 27.Bahraminasab A, Ghasemi F, Stefanovska A, McClintock PVE, Kantz H. Phys. Rev. Lett. 2008;100(8):084101. doi: 10.1103/PhysRevLett.100.084101. [DOI] [PubMed] [Google Scholar]
- 28.Makse A, Havlin S, Schwart M, Stanley HE. Phys. Rev. E. 1996;53(5):5445. doi: 10.1103/physreve.53.5445. [DOI] [PubMed] [Google Scholar]
- 29.Rosenblum MG, Cimponeriu L, Bezerianos A, Patzak A, Mrowka R. Phys. Rev. E. 2002;65(4):041909. doi: 10.1103/PhysRevE.65.041909. [DOI] [PubMed] [Google Scholar]
- 30.Jamšek J, Stefanovska A, McClintock PVE. Phys. Med. Biol. 2004;49(18):4407. doi: 10.1088/0031-9155/49/18/015. [DOI] [PubMed] [Google Scholar]
- 31.Smelyanskiy VN, Luchinsky DG, Stefanovska A, McClintock PVE. Phys. Rev. Lett. 2005;94(9):098101. doi: 10.1103/PhysRevLett.94.098101. [DOI] [PubMed] [Google Scholar]


