

Abstract
Chemokines are implicated in the neuroinflammation of several chronic neurodegenerative disorders. However, the precise role of chemokines in neurodegeneration is unknown. Thiamine deficiency (TD) causes abnormal oxidative metabolism in the brain as well as a well‐defined microglia activation and neurodegeneration in the submedial thalamus nucleus (SmTN), which are common features of neurodegenerative diseases. We evaluated the role of chemokines in neurodegeneration and the underlying mechanism in a TD model. Among the chemokines examined, TD selectively induced neuronal expression of monocyte chemoattractant protein‐1 (MCP‐1) in the SmTN prior to microglia activation and neurodegeneration. The conditioned medium collected from TD‐induced neurons caused microglia activation. With a neuron/microglia co‐culture system, we showed that MCP‐1‐induced neurotoxicity required the presence of microglia, and exogenous MCP‐1 was able to activate microglia and stimulated microglia to produce cytokines. A MCP‐1 neutralizing antibody inhibited MCP‐1‐induced microglia activation and neuronal death in culture and in the thalamus. MCP‐1 knockout mice were resistant to TD‐induced neuronal death in SmTN. TD selectively induced the accumulation of reactive oxygen species in neurons, and antioxidants blocked TD‐induced MCP‐1 expression. Together, our results indicated an induction of neuronal MCP‐1 during mild impairment of oxidative metabolism caused by microglia recruitment/activation, which exacerbated neurodegeneration.
Keywords: chemokines, microglia activation, neurodegeneration, oxidative stress, thiamine deficiency
INTRODUCTION
Neuronal death in neurodegenerative diseases is associated with chronic neuroinflammation and oxidative stress 20, 22, 40, 46. In the brain, neuroinflammation is governed primarily by microglia, a cell type of the monocyte–macrophage lineage that accounts for up to 20% of brain cells 39, 52, 55, 59. The accumulation and the activation of microglia are implicated in the pathogenesis of Alzheimer's disease (AD) 5, 12, 27, 37, Parkinson's disease (PD) (50), autism (64) and retina detachment (48); the activated microglia specifically distribute in affected regions. Activated microglia produce cytokines, chemokines, prostaglandins, excitatory amino acids, quinolinic acid, complement proteins, reactive oxygen intermediates and nitric oxide 2, 38; these substances may enhance oxidative stress and activate cell death pathways, which promote neurodegeneration (45). In fact, anti‐inflammatory drugs have been shown to delay the onset or slow down the progression of neurodegenerative disease (1). Oxidative stress, in which the production of highly reactive oxygen species (ROS) and reactive nitrogen species overwhelms antioxidant defenses, is a common feature of neurodegeneration 22, 68. Oxidative stress is involved in microglia activation, and chronic activation of microglia seems to exacerbate oxidative stress (20); however, the causal relationship is unclear. Furthermore, the role of oxidative stress in neuron/microglia interaction during neurodegeneration remains to be elucidated.
Chemokines are a family of small conserved cytokines that have been shown to attract distinct leukocyte subpopulations into damaged or traumatized tissues. Chemokines and their receptors are expressed in endothelial cells, microglia, astrocytes and neurons in the brain 4, 6. Induction of chemokines has been reported in AD (18), multiple sclerosis (MS) (44), PD (49), ischemia (67) and autism (64). We hypothesize that oxidative stress triggers neurons to produce and secrete chemokines, which recruit microglia to the affected sites, exacerbating the neurodegeneration.
In this study, we use a mouse model of thiamine (vitamin B1) deficiency (TD) to test this hypothesis and investigate the role of chemokines in neuron/microglia interaction in response to oxidative stress. TD induces chronic mild impairment of oxidative metabolism and promotes selective changes in oxidative stress and neuroinflammation that lead to neuronal loss in specific brain regions, which are commonly observed in neurodegenerative diseases 35, 36. As in human AD, experimental TD reduces thiamine‐dependent enzyme activities in multiple brain regions 7, 25. The most sensitive brain area is the submedial thalamic nucleus (SmTN) (35). TD induces oxidative stress, activation of microglia and astrocytes, upregulation of cytokines including tumor necrosis factor α (TNF‐α), interleukin (IL)‐1β and IL‐6, as well as neuronal loss in this region; the temporal sequence of these events following TD induction has been well studied in mice 7, 8, 26, 28, 29, 31, 42. Using this model system, we investigated the role of chemokines in neuron/microglia interaction in response to oxidative stress. We demonstrated that TD selectively induced monocyte chemoattractant protein‐1 (MCP‐1) in neurons of the SmTN prior to microglia recruitment and neurodegeneration. Administration of a MCP‐1 neutralizing antibody to the SmTN significantly inhibited TD‐induced microglia activation and neurodegeneration. Using a neuron/microglia co‐culture system, we confirmed that TD‐ and MCP‐1‐induced neurotoxicity required the presence of microglia, and exogenous MCP‐1 was able to activate microglia. Antioxidants blocked TD‐induced MCP‐1 induction in neurons as well as microglia activation. Together, our results support the hypothesis that neuronal induction of MCP‐1 during mild impairment of oxidative metabolism caused microglia recruitment/activation, which exacerbated the neurodegeneration.
MATERIALS AND METHODS
Chemicals and other reagents
All chemicals were obtained from Sigma Chemical Co. (St. Louis, MO, USA) unless otherwise mentioned. Trolox was obtained from Calbiochem® (San Diego, CA, USA). 5‐(and‐6)‐chloromethyl‐2′, 7′‐dichlorodihydrofluorescein diacetate acetyl ester (CM‐H2DCFDA) was obtained from Molecular Probes® (Eugene, OR, USA). MCP‐1 (mouse recombinant) was obtained from AbD Serotec (Raleigh, NC, USA). Annexin V‐fluorescein isothiocyanate (FITC) Apoptosis Detection Kit was obtained from Biovision Inc. (Mountain View, CA, USA). 3, 3′‐diaminobenzidine (DAB) was obtained from Vector Laboratories Inc. (Burlingame, CA, USA). Rabbit anti‐MCP‐1, mouse anti‐neuron‐specific nuclear protein (NeuN) antibody and biotin‐labeled secondary antibodies were obtained from Chemicon International Inc. (Temecula, CA, USA). Mouse anti‐glial fibrillary acidic protein (GFAP) antibody was obtained from Sigma Chemical Co. Rat anti‐platelet/endothelial cell adhesion molecule‐1 (PECAM1) antibody was obtained from Santa Cruz Biotechnology Inc. (Santa Cruz, CA, USA). Rat anti‐cluster of differentiation 68 (CD68) antibody was obtained from AbD Serotec. Rabbit anti‐ ionized calcium‐binding adaptor molecule‐1 (IBA1) antibody was obtained from Wako Pure Chemical Industries, Ltd (Osaka, Japan), and anti‐glyceraldehyde‐3‐phosphate dehydrogenase (GAPDH) antibody was obtained from Kangcheng Bio‐tech Inc. (Shanghai, China). Alexa‐labeled secondary antibodies were obtained from Molecular Probes. All culture dishes, plates and flasks were obtained from Corning Inc. (Corning, NY, USA). Trizol was obtained from Invitrogen Inc. (Carlsbad, CA, USA). Culture plate inserts were obtained from Millipore Co. (Billerica, MA, USA).
Animal and TD induction
Male C57BL/6J mice were obtained from Shanghai SLAC Laboratory Animal Co. Ltd. (Shanghai, China). Homozygous MCP‐1‐deficient mice chemokine C‐C motif ligand 2 (CCL2‐/‐) breeders were purchased from the Jackson Laboratories (Bar Harbor, ME, USA) and bred in the Shanghai SLAC Laboratory Animal Facility. The disruption of MCP‐1 gene in these mice has been previously described (41). The procedure for animal surgery was performed in accordance with the Guidelines of Animal Care and Use Committee of the Institute for Nutritional Sciences, Shanghai Institutes for Biological Sciences, Chinese Academy of Sciences. Every effort was made to minimize the number of animals used and their suffering. The animal TD model has been previously described 35, 70, 75. Briefly, adult male C57BL/6J mice or CCL2−/− mice (20–25 g) were housed in a controlled environment (one mouse/cage at 23°C and 53% humidity). The animals were fed with either a control diet or a thiamine‐deficient diet (ICN Nutrition Biomedicals, Cleveland, OH, USA) ad libitum. TD animals also received a daily intraperitoneal (i.p.) injection of a thiamine antagonist, pyrithiamine hydrobromide (5 µg/10 g body weight), while control animals were injected with saline. Pyrithiamine is a potent inhibitor of thiamine pyrophosphokinase and blocks the synthesis of thiamine diphosphate. Previous studies showed that TD mice displayed a characteristic neuronal death and microglia activation in the SmTN of thalamus after 9 days of TD (9). We confirmed that this paradigm of TD induced a duration‐dependent accumulation of microglia (IBA1‐positive cells) and neurodegeneration in the SmTN (data not shown).
Stereological injection of MCP‐1 antibody
Mice were anesthetized with chloral hydrate (400 mg/kg, i.p.) and positioned in a stereotaxic apparatus (NARISHIGA Scientific Instrument Lab, Tokyo, Japan). Anti‐MCP‐1 antibody [4 µg in 4 µL phosphate buffer saline (PBS)] or PBS only (control) was administrated by intra‐thalamus injection into the SmTN by the following stereotaxic coordinates: 1.45 mm posterior to the bregma, 0.5 mm lateral to the midline and 4 mm below the surface of pia. All injections were performed by 10‐µL Hamilton syringe at the rate of 0.1 µL/minute. After injections, the syringe remained in the injection site for 5 minutes before being withdrawn.
Sample collection
For immunoblotting analysis, the tissues were isolated after treatment and frozen in liquid nitrogen and stored at −80°C for later analysis. The thalamus and cerebral cortex were divided into two parts: left part for immunoblotting analysis and right part for quantitative real‐time polymerase chain reaction (RT‐PCR). Proteins were extracted with a previously described method 70, 75. Briefly, tissues or cultured cells were homogenized in an ice‐cold lysis buffer containing 5 mM ethylenediaminetetraacetic acid (EDTA), 0.5% Nonidet P 40 (NP‐40), 0.1% Triton‐100 (Sigma‐Aldrich, St. Louis, MO, USA), 0.1% sodium dodecyl sulfate (SDS), 10 mg/mL phenylmethanesulfonyl fluoride (PMSF), 10 µg/mL leupeptin and 100 mM sodium orthovanadate in PBS. Homogenates were centrifuged at 14 000 rpm for 30 minutes at 4°C, and the supernatant fraction was collected.
For immunohistochemical analysis, animals were anesthetized by i.p. injection of chloral hydrate (500 mg/kg) after treatment and were perfused with 10 mL of saline, followed by 100 mL of 4% paraformaldehyde in 0.1 M PB (pH 7.2) 35, 75. The brains were removed and post‐fixed in the same fixative overnight, and then transferred to 30% sucrose for an additional 24 h. The brain block that contained the thalamus was dissected on a Rodent Brain Matrix (ASI Instruments, Warren, MI, USA) and sectioned with a sliding microtome (Microm Laborgerate GmbH, Welldorf, Germany) at the thickness of 40 µm. Sections were collected from the bregma level 0.70 to −2.06 (21). As the SmTN appears from the bregma level −0.94 and disappears at the level −1.94, a total of 25 sections containing SmTN were obtained per mouse.
Cell cultures and TD induction in vitro
We have compared TD‐induced neurodegeneration in primary cultures of thalamic neurons and cortical neurons; TD caused neuronal apoptosis in both cultures, and thalamic neurons showed a greater sensitivity to TD‐induced damage (data not shown). In the current study, we used primary cortical neuron cultures because a relatively large amount of cells were required for biochemical analyses. Primary cultures of cortical neurons were generated using a previously described method 43, 71. Briefly, the 14‐day C57BL/6J mouse embryos were decapitated, and cerebra were removed. The cerebra were minced with a sterile razor blade and suspended in 10 mL of trypsin solution (0.025%) at 37°C. After incubation for 15 minutes, an equal volume of a solution containing DNase (130 Kunitz units/mL) and trypsin inhibitor (0.75 mg/mL) was added, and the tissue was sedimented by a brief (5 s) centrifugation. The tissue was dissociated by trituration, and the cell suspension was mixed with 4% bovine serum albumin and centrifuged. The cell pellet was resuspended in Neurobasal/B27 medium containing 2% B27 and 1 mmol/L glutamine (Invitrogen Inc.), 100 units/mL penicillin and 100 µg/mL streptomycin (Gibco Inc., Los Angeles, CA, USA). Cells were plated into poly‐D‐lysine (50 µg/mL) coated cell culture wells or dishes, and maintained at 37°C in a humidified environment containing 5% CO2. To induce TD, cortical neurons were treated with amprolium (0, 1 mmol/L) for indicated times after being cultured in Neurobasal/B27 medium for 7 days51, 69, 70. Amprolium is a competitive inhibitor of thiamine transport and effectively depletes intracellular thiamine. Amprolium was selected to induce TD for neurons because Neurobasal/B27 medium contained thiamine. Previous studies indicated that amprolium (1 mM) effectively induced TD in neurons 69, 70.
Microglia and astrocytes were isolated from the forebrains of newborn (postnatal 1–2 days) C57BL/6J mice and cultured according to previously published methods 32, 51. For each experiment, primary cultures of microglia and astrocytes were used without passaging to ensure the consistency. The purity of microglia or astrocytes was confirmed to be greater than 98% by immunocytochemical staining for IBA1 (microglia) and GFAP (astrocyte). To induce TD, microglia and astrocytes were exposed to pyrithiamine hydrobromide (300 nmol/L) in thiamine‐deficient Dulbecco's Modified Eagle Medium (DMEM) (JRH Biosciences Inc., Lenexa, KS, USA) supplemented by 10% fetal bovine serum (FBS) (Hyclone, South Logan, UT, USA), 100 units/mL penicillin and 100 µg/mL streptomycin. For control cultures, the culture medium was supplemented with thiamine (75). SH‐SY5Y, a human neuroblastoma cell line, and mouse immortalized brain capillary endothelial (b.End3) cell line were maintained in DMEM supplemented by 10% FBS, 100 units/mL penicillin and 100 µg/mL streptomycin. The method for induction of TD in these cells was the same as that in microglia and astrocytes.
For co‐cultures of microglia and neurons, primary cortical neurons were plated in six‐well plates or 35‐mm dishes, and maintained in a Neurobasal medium supplemented with B27 for 7 days. Microglia were plated on 30‐mm culture plate inserts for 24 h for adhesion. Each insert containing microglia (1 × 10⁶) was then placed in the culture dish where neurons (1 × 10⁶) were maintained. With this system, microglia and neurons can communicate without direct contact, and neurons and microglia can be processed separately for further biochemical and immunocytochemical analyses. To induce TD in the co‐cultures, neuron/microglia co‐cultures were treated with amprolium (0 or 1 mmol/L) for 7 days. For treatment of MCP‐1 neutralizing antibody, anti‐MCP‐1 antibody (10 µg/mL) was added to the co‐cultures on the fourth day and sixth day after amprolium treatment. To scavenge ROS, Trolox (200 µmol/mL) was added to the co‐cultures with amprolium at the same time. The neurons were prepared for annexin V and propidium iodide (PI) staining, while microglia were processed for RNA isolation on day 7 after TD.
RNA extraction and real‐time PCR
Total RNA extraction and reverse transcription were performed as previously reported (13). Briefly, total RNA was isolated using TRIzol reagent (Invitrogen Inc.). After being treated with RNase‐free DNase I (Roche Applied Science, Penzberg, Germany), first‐strand cDNA was synthesized with Moloney Murine Leukemia Virus (M‐MLV) reverse transcriptase and Oligo‐dTs (Promega Corp., Madison, WI, USA). Real‐time quantitative PCR was conducted with ABI Prism 7500 Sequence Detection System according to the instruction of the manufacturer (Applied Biosystems, Foster City, CA, USA). PCR primers used in this study are as follows: mouse MCP‐1 (mMCP‐1) forward, 5′‐TCTCTCTTCCTCCACCACCATG‐3′; mMCP‐1 reverse, 5′‐GCGTTAACTGCATCTGGCTGA‐3′; human MCP‐1 (hMCP‐1) forward, 5′‐TCTCGCCTCCAGCATGAAAGT‐3′; hMCP‐1 reverse, 5′‐GCATTGATTGCATCTGGCTGA‐3′; actin forward, 5′‐GATCATTGCTCCTCCTGAGC‐3′; actin reverse, 5′‐ACTCCTGCTTGCTGATCCAC‐3′; mouse vascular endothelial growth factor (mVEGF) forward, 5′‐ACCGATTAACCATGTCACCACC‐3′; mVEGF reverse, 5′‐CCAAAGTGCTCCTCGAAGAGTC‐3′; mouse erythropoietin (mEPO) forward, 5′‐CACCAGAGACCCTTCAGCTTCA‐3′; mEPO reverse, 5′‐GCGACATCAATTCCTTCTGAGC‐3′; mouse TNF‐α (mTNF‐α) forward, 5′‐AGCCGATGGGTTGTACCTTGTCTA‐3′; mTNF‐α reverse, 5′‐TGAGATAGCAAATCGGCTGACGGT‐3′; mouse interleukin‐1β (mIL‐1β) forward, 5′‐ACAGAATATCAACCAACAAGTGATATTCTC‐3′; and mIL‐1β reverse, 5′‐GATTCTTTCCTTTGAGGCCCA‐3′.
For relative comparison of each gene, we analyzed the Ct value of real‐time PCR data with the ▵▵Ct method normalized by an endogenous control (β‐actin) (13).
Immunoblotting analysis
The procedure for immunoblotting analysis has been previously described 69, 70, 75. Aliquots of proteins (40–80 g) were loaded into the lanes of a SDS polyacrylamide gel. The proteins were separated by electrophoresis and transferred to nitrocellulose membranes. The membranes were blocked with 5% nonfat dry milk in 0.01 M PBS (pH 7.4) and 0.05% Tween‐20 (Sigma Chemical Co., St. Louis, MO, USA) (TPBS) at room temperature for 1 h. Subsequently, the membrane was incubated with primary antibodies directed against target proteins overnight at 4°C. The final dilutions for primary antibodies were: MCP‐1, 1:1000; GAPDH, 1:10 000. After two quick washes in TPBS, the membranes were incubated with secondary antibodies conjugated to horseradish peroxidase (Amersham, Arlington Heights, IL, USA) diluted at 1:5000 in TPBS for 1 h. The immunocomplexes were detected by the enhanced chemiluminescence method (Amersham). The density of immunoblotting was quantified with the software of Quantity One (Bio‐Rad Laboratories, Hercules, CA, USA). The expression of MCP‐1 was normalized to the level of GAPDH.
Immunohistochemical and immunofluorescent staining
Every fifth section was used for IBA1 and NeuN staining. Briefly, sections were incubated in 0.3% H2O2 in methanol for 30 minutes at room temperature and then treated with 0.1% Triton X‐100 (Sigma‐Aldrich) for 10 minutes in 0.05 M potassium phosphate buffered saline (KPBS). The sections were washed with 0.05 M KPBS three times, blocked with 0.05 M KPBS, pH 7.2 containing 1% bovine serum albumin (BSA) for 30 minutes, and then incubated overnight with rabbit anti‐IBA1 polyclonal antibody (1:1000) or mouse anti‐NeuN monoclonal antibody (1:1000) at 4°C. After rinsing in KPBS, sections were treated with biotinylated secondary antibody (1:200) for 2 h. Sections were then incubated with avidin–biotin–peroxidase complex for 1 h (1:1000), rinsed in KPBS and developed in 0.05% DAB with 0.003% H2O2 in KPBS.
Double immunofluorescence staining on the brain sections was performed as previously reported 10, 31. Briefly, sections were pretreated with 0.05 M KPBS, pH 7.2 containing 1% BSA for 30 minutes, and then incubated overnight with rabbit anti‐MCP‐1 polyclonal antibody (1:200) at 4°C. After rinsing in KPBS, sections were incubated with Alexa488‐conjugated goat anti‐rabbit immunoglobulin G (IgG) (1:1000) for 1 h, rinsed in KPBS and incubated with mouse anti‐NeuN monoclonal antibody (1:1000), mouse anti‐GFAP monoclonal antibody (1:1000), rat anti‐CD68 antibody (1:500) or rat anti‐PECAM1 antibody (1:100) at 4°C overnight. After rinsing in KPBS, sections were treated with Alexa555‐conjugated goat anti‐mouse or rat (1:1000) for 1 h.
Immunocytofluorescence staining for MCP‐1 in primary cortical neurons was performed as previously described 69, 70. Briefly, neurons were plated on poly‐lysine‐coated coverslips and exposed to amprolium (0, 1 mol/mL) for 7 days, and then fixed with 4% paraformaldehyde in 0.1 M PB (pH 7.2). The coverslips were pretreated with 0.05 M KPBS, pH 7.2 containing 1% BSA for 30 minutes, followed by an overnight incubation with rabbit anti‐MCP‐1 polyclonal antibody (1:500) at 4°C. After rinsing in KPBS, sections were incubated for 1 h in Alexa488‐conjugated goat anti‐rabbit IgG or (1:1000) 1 µg/mL 4′,6‐diamidino‐2‐phenylindole (DAPI). Immunofluorescence images were recorded using a Zeiss LSM 510 Meta confocal microscope (Carl Zeiss MicroImaging Inc., Thornwood, NY, USA).
Quantification of active microglia
The morphology of microglia was analyzed by phase contrast microscopy. Resting microglia display multiple branching processes and an elongated cell body, while active microglia usually have less than two branching processes and a round cell body (32). Microglia were plated into culture wells of 24‐well plates at a density of 5 × 10⁵ cells/well and allowed for adhesion for 24 h. When cultured in serum‐free DMEM for 24 h, the majority of microglia displayed a resting morphology (>80%). For quantifications of resting microglia and activated microglia, five to six randomly selected fields were photographed in each culture well, and more than 100 cells were scored.
Annexin‐V and PI staining
Apoptotic cell death was determined using an annexin V FITC and PI apoptosis detection kit as previously described 69, 75. Briefly, 2.0 × 10⁵ cells were resuspended in 0.5 mL binding buffer and incubated with annexin V FITC and PI for 5 minutes in the dark at room temperature. Annexin V signal and PI signals were detected and quantified using a FACScan cytometer (BD Biosciences, San Jose, CA, USA) equipped with a FITC signal detector FL1 (excitation 488 nm, green) and a phycoerythrin emission signal detector FL2 (excitation 585 nm, red). The relative amount of apoptotic cells was determined from 2 × 10⁴ using the Cellquest program (BD Biosciences).
Measurement of ROS accumulation
ROS levels were monitored by the fluorescent CM‐H2DCFDA as previously described 13, 75. Oxidation of H2DCFDA by peroxides yielded the fluorescent derivative dichlorofluorescein (DCF). Briefly, cells were incubated with 10 µM H2DCFDA in PBS for 30 minutes at 37°C. Cells were collected by centrifugation and washed three times. Intracellular ROS levels (DCF signals) were measured with a flow cytometer (FACSAriaTM, BD Biosciences) at λex of 488 nm and λem of 520 nm. Data acquisition and processing were performed using the Cellquest program (BD Biosciences).
Quantitative analysis of microglia and neurons in the SmTN
Stereological analysis was performed with an Olympus BX61 microscope with a monitored x–y–z stage linked to the stereoInvestigator software (version 8, MicroBrightField, San Diego, CA, USA). The SmTN was defined as our previous study of TD 35, 74, 75, and five sections across the entire SmTN were used for cell counting. The SmTN was outlined using a 4× objective on each section. The IBA1‐positive microglia or NeuN‐positive neurons were counted using a 40× objective with a counting frame. The thickness of sections was determined before counting; the average thickness of the sections was approximately 14.8 µm. Optical dissector counting rules were used to count the IBA1‐positive microglia or NeuN‐positive neurons in each dissector volume, and the total numbers were calculated by the following formula:
 |
Where ∑Q ‐ is the total number of NeuN‐positive neurons or IBA1‐positive microglia counted, t is the mean section thickness, h is the height of the optical dissector, asf is the area sampling fraction and ssf is the section sampling fraction. The coefficient of error for all individual optical fractionators was less than 0.1.
Statistical analysis
Statistical analysis was assessed by one‐way ANOVA, followed by Student–Newman–Keuls analyses. An unpaired t‐test was used for the analysis of quantitative data of cell counting in the brain. Data were presented as means ± standard deviation. Difference in which P < 0.05 was considered statistically significant.
RESULTS
TD induces the expression of MCP‐1 in the thalamus
Because TD causes the recruitment of activated microglia in the SmTN, we hypothesized that the chemoattractants that regulate microglial migration may be induced during TD. We therefore examined four well‐defined chemoattractants in the thalamus and the cerebral cortex during TD; these include MCP‐1 (also known as CCL2), macrophage inflammatory protein‐1α (MIP‐1α, also known as CCL3), MIP‐1β (also known as CCL4) and regulated on activation normal T expressed and secreted (RANTES, also known as CCL5). The expression of MCP‐1 mRNA increased in the thalamus after 8 days of TD, and the maximal increase (up by 200 times) was observed after 10 days of TD (Figure 1A). Immunoblotting analysis showed that the protein levels of MCP‐1 increased in the thalamus after 8 days of TD; the maximal increase (up by six times) was observed after 10 days of TD in the thalamus (Figure 1B). There was little change of MCP‐1 mRNA and protein levels in the cerebral cortex during TD (Figure 1A and data not shown). TD did not generally affect the mRNA level of MIP‐1α, MIP‐1β and RANTES in the thalamus and the cerebral cortex (Figure 1C). However, a small but statistically significant increase in MIP‐1β mRNA was observed in the thalamus after 9 days of TD. In primary cultures of cortical neurons, only MCP‐1 is induced by TD, and the mRNA levels for MIP‐1α, MIP‐1β and RANTES were not changed (data not shown). We also examined several cytokines that play an important role in the inflammatory processes, such TNF‐α and IL‐1β; these cytokines were significantly induced in the thalamus on day 9 of TD (Figure 1).
Figure 1.

The induction of MCP‐1 in the thalamus by thiamine deficiency (TD). A. TD was induced in C57BL/6J mice as described under the Materials and Methods. The expression of MCP‐1 mRNA in the thalamus and the cerebral cortex was measured by quantitative RT‐PCR analysis after the indicated days of TD. B. The expression of MCP‐1 protein was measured by immunoblotting analysis (left panel). The relative amount of MCP‐1 was quantified and normalized to the expression of GAPDH (right panel). C. Expression of other chemokines in the thalamus and the cerebral cortex was determined by quantitative RT‐PCR analysis. Data were presented as means ± SD (n = 5 for each group); *P < 0.05 (compared with the control group, Ct). Abbreviations: mRNA = messenger RNA; MCP‐1 = monocyte chemoattractant protein‐1; GAPDH = glyceraldehyde‐3‐phosphate dehydrogenase; CCL = chemkine C‐C motif ligand; TNF‐α = tumor necrosis factor α; IL = interleukin; RT‐PCR = real time–polymerase chain reaction; SD = standard deviation.
TD‐induced MCP‐1 expression is neuronal specific
Immunohistochemical studies revealed that the expression of constitutive MCP‐1 was weak in the thalamus of mice brains (data not shown), which is consistent with a previous report (4). The expression of MCP‐1 was drastically increased in the SmTN of the thalamus after 8 days of TD, which was 1 day earlier than the recruitment of microglia (data not shown). MCP‐1 was mainly localized in neurons (NeuN‐positive cells), but not in astrocytes (GFAP positive), endothelial cells (PECAM1‐positive cells) or microglia (CD68 positive) (Figure 2). To confirm that TD‐induced MCP‐1 expression is neuron specific, we examined the effect of TD on MCP‐1 expression in primary cortical neurons, neuroblastoma cells (SH‐SY5Y), microglia, astrocytes and a brain endothelial cell line (b.End3). Both mRNA and protein levels of MCP‐1 increased in primary cultured neurons after TD (Figure 3A,3B,3E). TD‐induced expression of MCP‐1 was primarily localized in the cytoplasm of primary cortical neurons (Figure 3C). TD also significantly increased the levels of MCP‐1 mRNA in SH‐SY5Y cells (Figure 3D); however, TD did not affect the expression of MCP‐1 in microglia, astrocytes and b.End3 cell line (Figure 3E), as well as protein level (data not shown).
Figure 2.

Neuronal expression of MCP‐1 in the thalamus. After 8 days of TD, the expression and localization of MCP‐1 in the thalamus were examined with immunofluorescent staining. The microphotographs show MCP‐1‐positive cells in the submedial thalamus nucleus (SmTN) of the thalamus. The cells in the SmTN were double stained with markers for neurons (NeuN), astrocytes (GFAP), microglia (CD68) and endothelial cells (PECAM1). MCP‐1 was expressed in NeuN‐positive cells in the SmTN. Scale bar = 10 µm. Abbreviations: MCP‐1 = monocyte chemoattractant protein‐1; NeuN = neuronal specific nuclear protein; GFAP = glial fibrillary acidic protein; CD68 = cluster of differentiation 68; PECAM1 = platelet/endothelial cell adhesion molecule‐1.
Figure 3.
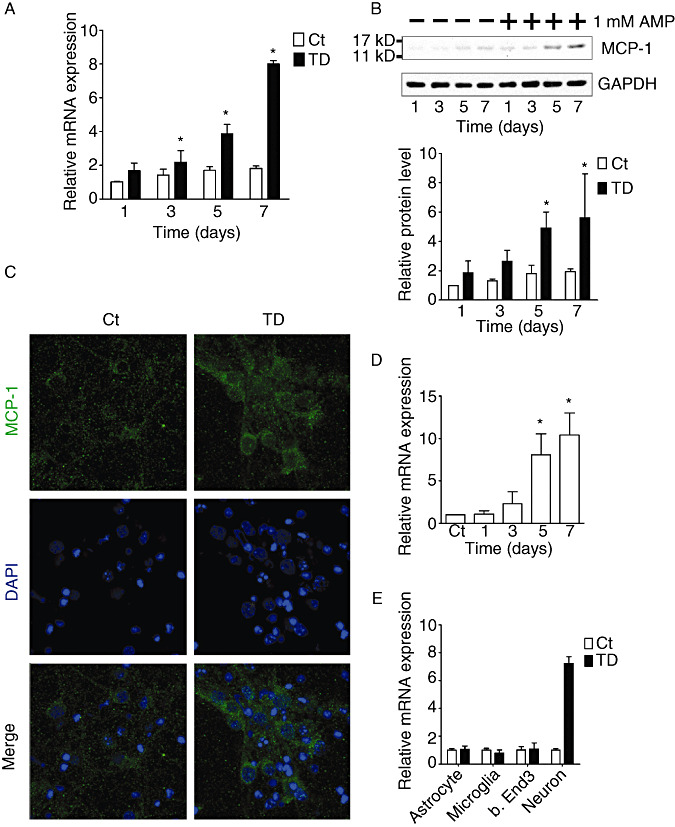
In vitro induction of MCP‐1 in neuronal cells by TD. A. TD was induced in primary cortical neurons as described under the Materials and Methods. The expression of MCP‐1 mRNA was measured by quantitative RT‐PCR analysis. B. The expression of MCP‐1 protein was measured by immunoblotting analysis (top panel), and quantified and normalized to the expression of GAPDH (bottom panel). C. Immunofluorescent images show MCP‐1 staining in primary cortical neurons after 7 days of TD. The nuclei of neurons were stained with DAPI. Scale bar = 10 µm. D. TD was induced in SH‐SY5Y neuroblastoma cells as described under the Materials and Methods. The expression of MCP‐1 mRNA was measured by quantitative RT‐PCR analysis. E. After 7 days of TD, the expression of MCP‐1 mRNA in astrocytes, microglia, b.End3 cells and cortical neurons was measured by quantitative RT‐PCR analysis. Data were presented as means ± SD (n = 3); *P < 0.05 (compared with the control group, Ct). RT‐PCR = real time ‐ polymerase chain reaction; mRNA = messenger RNA; TD = thiamine deficiency; AMP = amprolium; MCP‐1 = monocyte chemoattractant protein‐1; GAPDH = glyceraldehyde‐3‐phosphate dehydrogenase; DAPI = 4′,6‐diamidino‐2‐phenylindole; SH‐SY5Y = a human neuroblastoma cell line; SD = standard deviation.
Microglia promote TD‐induced neuronal death
The recruitment of microglia and neurodegeneration are observed during TD‐induced brain damage 9, 35. However, the relationship between these events is unclear. We hypothesized that the activation of microglia may cause neurodegeneration. To test this hypothesis, we used a neuron/microglia co‐culture system to study the interaction. With this system, neurons and microglia were able to communicate without direct contact. As shown in Figure 4A, neurons were much more sensitive to TD in the presence of microglia compared with the neuronal cultures without microglia. TD‐induced neuronal death was much greater in cultures with microglia than those without microglia (Figure 4B,4C). Thus, microglia exacerbated cell death induced by TD.
Figure 4.

TD‐induced neuronal death in the co‐cultures of neurons and microglia. Primary neurons (1 × 10⁶) were co‐cultured with or without microglia (1 × 10⁶) as described under the Materials and Methods. TD was induced by the treatment with amprolium (AMP; 1 mmol/L) as described under the Materials and Methods. A. Microphotographs show images of neuronal cultures in neuron/microglia co‐cultures after 7 days of TD. TD in the presence of microglia (TD + M) induced the greatest loss of neurons. Scale bar = 50 µm. B. Apoptosis after 7 days of TD was measured by annexin V/PI staining as described under the Materials and Methods. C. The percentage of apoptotic cells determined by annexin V/PI staining was calculated. The results were means ± SD (n = 3); *P < 0.05 (compared with the control group, Ct). Abbreviations: TD = thiamine deficiency; PI = propidium iodide; SD = standard deviation.
MCP‐1 neurotoxicity depends on microglia
MCP‐1 was induced in neurons during TD (2, 3). We postulated that the accumulation of MCP‐1 may cause neuronal death. We therefore examined the effect of MCP‐1 on primary cortical neurons. The endotoxin, lipopolysaccharides (LPS), served as a positive control. To our surprise, neither MCP‐1 nor LPS caused neuronal death in vitro (Figure 5A,5B). Because activated microglia may contribute to TD‐induced neuronal death and MCP‐1 receptor is expressed in microglia (65), we hypothesized that MCP‐1's neurotoxicity may require the presence of microglia. Indeed, in the presence of microglia, MCP‐1 exhibited potent neurotoxicity and caused neuronal death (Figure 5A,5B). IL‐1β and TNF‐α are secreted by activated microglia and are major inflammatory mediators that may contribute to neurodegeneration 14, 57, 72. We then determined whether MCP‐1 regulated the expression of IL‐1β and TNF‐α in microglia. As shown in Figure 5C, MCP‐1 increased the levels of IL‐1β and TNF‐α mRNA in microglia.
Figure 5.

The effect of MCP‐1 on the survival of neurons co‐cultured with microglia. Neuron/microglia co‐cultures were treated with MCP‐1 (1 or 10 ng/mL) or lipopolysaccharide (LPS; 50 ng/mL) for 2 days. A. Apoptotic cell death was measured by annexin V/PI staining. B. The percentage of apoptotic cells determined by annexin V/PI staining was calculated. C. The expression of IL‐1β and TNF‐α mRNA in microglia was measured by quantitative RT‐PCR analysis. The results were means ± SD (n = 3); *P < 0.05 (compared with the control group, Ct). Abbreviations: MCP‐1 = monocyte chemoattractant protein‐1; PI = propidium iodide; IL = interleukin; TNF‐α = tumor necrosis factor α; RT‐PCR = real time ‐ polymerase chain reaction; SD = standard deviation.
We used a MCP‐1 neutralizing antibody to determine the role of MCP‐1 in TD‐induced neuronal death. This antibody has been previously shown to effectively block the action of MCP‐1 (30). This neutralizing antibody significantly decreased TD‐induced neuronal death in neuron/microglia co‐cultures; it also attenuated TD‐induced increase in IL‐1β and TNF‐α mRNA expression in microglia (Figure 6A,6C). Furthermore, this antibody partially protected primary cortical neurons against MCP‐1‐induced neuronal death in neuron/microglia co‐cultures and inhibited a MCP‐1‐induced increase in IL‐1β and TNF‐α mRNA expression in microglia (Figure 6B,6D). Together, these results indicated that MCP‐1's neurotoxicity was mediated by microglia, and blockage of MCP‐1 action offers effective neuroprotection.
Figure 6.

The effect of a MCP‐1 neutralizing antibody on TD‐ and MCP‐1‐induced neuronal death. A. TD was induced in neuron/microglia co‐cultures in the presence of a MCP‐1 neutralizing antibody (αMCP‐1, 0 or 10 µg/mL) for 7 days. Apoptotic cell death was measured by annexin V/PI staining (left panel). The percentage of apoptotic cells determined by annexin V/PI staining is presented on the right panel. The results were means ± SD (n = 3); *P < 0.05 (compared with the TD group without αMCP‐1). B. Neuron/microglia co‐cultures were treated with MCP‐1 in the presence of αMCP‐1 (0 or 10 µg/mL) for 2 days. Apoptotic cell death was measured by annexin V/PI staining (left panel). The percentage of apoptotic cells determined by annexin V/PI staining is presented on the right panel. The results were means ± SD (n = 3); *P < 0.05 (compared with the MCP‐1‐treated group without αMCP‐1). C. and D. The effect of αMCP‐1 on TD‐ and MCP‐1‐induced expression of IL‐1β and TNF‐α mRNA in microglia was measured by quantitative RT‐PCR analysis. The results were means ± SD (n = 3); *P < 0.05 (compared with the control group, Ct); #P < 0.05 (compared with TD‐ or MCP‐1‐treated groups without αMCP‐1). Abbreviations: TD = thiamine deficiency; MCP‐1 = monocyte chemoattractant protein‐1; AMP = amprolium; IL = interleukin; TNF‐α = tumor necrosis factor α; mRNA = messenger RNA; PI = propidium iodide; RT‐PCR = real time ‐ polymerase chain reaction; SD = standard deviation.
MCP‐1 activates microglia
We sought to determine whether MCP‐1 can activate microglia. When cultured in serum‐free DMEM, most microglia displayed multiple branched processes and an elongated cell body characteristic of the resting morphology as previously reported (32). Exposure to MCP‐1 caused the retraction of the processes and rounding of the cell body, which is characteristic of activated microglia; LPS also induced similar morphological changes (Figure 7A,7B). MCP‐1 caused a modest increase of TNF‐α mRNA in microglia (Figure 7C). Furthermore, exposure to the conditioned medium collected from TD‐treated neurons also resulted in an active morphology of microglia; the MCP‐1 neutralizing antibody partially reversed microglia activation (Figure 7D,7E). In addition, this antibody significantly blocked the upregulation of IL‐1β and TNF‐α in microglia caused by the conditioned medium collected from TD neurons (Figure 7F). These results suggested that MCP‐1 can activate microglia, and neuron‐secreted MCP‐1 may cause microglia activation.
Figure 7.

MCP‐1‐induced microglia activation. A. Microglia were treated with MCP‐1 (0, 1 or 10 ng/mL) or lipopolysaccharide (LPS; 0 or 50 ng/mL) for 3 h. The images show the morphology of microglia before and after the treatment of MCP‐1 or LPS. MCP‐1 and LPS induced the morphology of activated microglia with a large round cell body, compared with the resting microglia with an elongated cell body and branched processes. Scale bar = 20 µm. B. The percentage of active microglia was scored as described under the Materials and Methods. The results were means ± SD (n = 3); *P < 0.05 (compared with the untreated group). C. Microglia were treated with MCP‐1 (0 or 10 ng/mL) or LPS (0 or 50 ng/mL) for 24 h. The expression of IL‐1β and TNF‐α mRNA was measured by quantitative RT‐PCR analysis. The results were means ± SD (n = 3); *P < 0.05 (compared with the untreated group). D. Microglia were incubated with fresh medium; the conditioned medium was collected from control neuronal cultures or the conditioned medium was collected from TD neuronal cultures in the presence of a MCP‐1 neutralizing antibody (αMCP‐1, 0 or 10 µg/mL) for 4 h. The microphotographs show the morphology of the microglia after the treatment. NT: Microglia were not exposed to the conditioned medium. Scale bar = 20 µm. E. The percentage of active microglia was scored. The results were means ± SD (n = 3); *P < 0.05 (compared with the untreated group); #P < 0.05 (compared with the TD group without αMCP‐1). F. Microglia were treated with the conditioned medium collected from TD neuronal cultures in the presence of αMCP‐1 (0 or 10 µg/mL) for 24 h. The expression of IL‐1β and TNF‐α mRNA was measured by quantitative RT‐PCR analysis. The results were means ± SD (n = 3); *P < 0.05 (compared with the untreated group). #P < 0.05 (compared with the TD group without αMCP‐1). Abbreviations: MCP‐1 = monocyte chemoattractant protein‐1; IL = interleukin; TNF‐α = tumor necrosis factor α; RT‐PCR = real time‐polymerase chain reaction; SD = standard deviation.
ROS mediate TD‐induced MCP‐1 expression and neuronal death
ROS has been implicated in TD‐induced neurodegeneration 36, 69, 75. We sought to determine whether ROS plays a role in TD‐induced MCP‐1 upregulation. As shown in Figure 8A–8C, TD increased ROS production in both primary cortical neurons and SH‐SY5Y neuroblastoma cells, but not in microglia, astrocytes and a brain endothelial cell line (b.End3 cells). Trolox, an antioxidant, significantly attenuated TD‐induced ROS production and MCP‐1 upregulation in both primary cortical neurons (Figure 8D,8E) and SH‐SY5Y cells (Figure 8F,8G). Trolox also ameliorated TD‐induced neuronal death (Figure 9A,9B) and the upregulation of IL‐1β and TNF‐α mRNA in microglia (Figure 9C). Our in vivo study demonstrated that Trolox also provided protection against TD‐induced neuronal death in the thalamus (data not shown). These results suggested that ROS played a critical role in TD‐induced MCP‐1 expression and subsequent neuronal death.
Figure 8.

The role of ROS in TD‐mediated MCP‐1 expression in neuronal cells. TD was induced in cultured cortical neurons and SH‐SY5Y neuroblastoma cells as described under the Materials and Methods. A. and B. Intracellular ROS production in cortical neurons and SH‐SY5Y cells was determined by DC‐FDA readings at the indicated time points after TD. C. Intracellular ROS production in primary cortical neurons, astrocytes, microglia and b.End3 cells was determined by DCF‐DA readings after 7 days of TD. The results were means ± SD (n = 3). *P < 0.05 (compared with the control groups). D. and E. TD was induced in cortical neurons and SH‐SY5Y cells in the presence of Trolox (TR, 200 µmol/L) or phosphate buffer (PB). Intracellular ROS production in cortical neurons and SH‐SY5Y cells was determined by DCF‐DA readings after 7 days of TD. F. and G. The relative expression of MCP‐1 mRNA in cortical neurons and SH‐SY5Y neuroblastoma cells was determined after 7 days of TD. The results were means ± SD (n = 3); *P < 0.05 (compared with the untreated group); #P < 0.05 (compared with the TD group without TR). Abbreviations: ROS = reactive oxygen species; SH‐SY5Y = a human neuroblastoma cell line; DC‐FDA = 5‐(and‐6)‐chloromethyl‐2′, 7′‐dichlorodihydrofluorescein diacetate acetyl ester; Ct = control group; TD = thiamine deficiency; mRNA = messenger RNA; SD = standard deviation.
Figure 9.
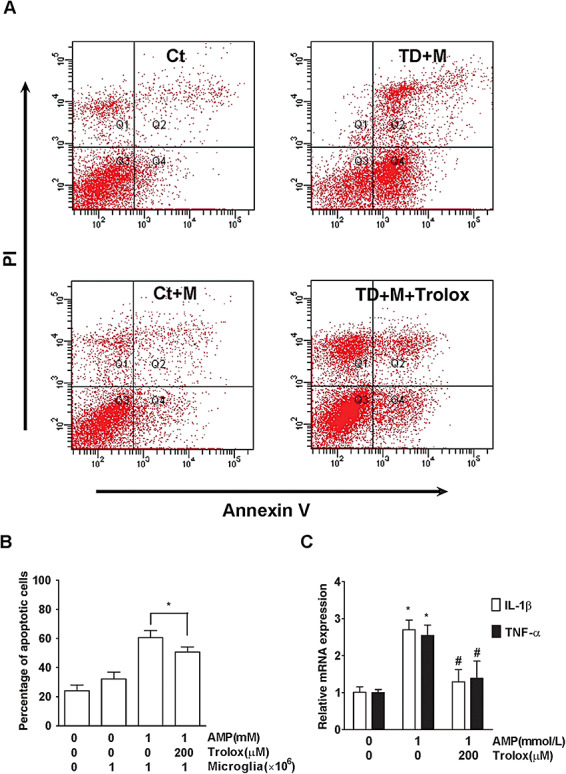
The role of ROS and microglia in TD‐induced neuronal death. TD was induced in neuron/microglia co‐cultures in the presence of Trolox (0 or 200 µmol/L) for 7 days. A. Apoptotic cell death in neurons was measured by annexin V/PI staining as described under the Materials and Methods. M: The presence of microglia. B. The percentage of apoptotic neurons was calculated. C. The expression of IL‐1β and TNF‐α mRNA in microglia was measured by quantitative RT‐PCR analysis. The results were means ± SD (n = 3); *P < 0.05 (compared with the control groups); #P < 0.05 (compared with the TD groups without Trolox). Abbreviations: ROS = reactive oxygen species; RT‐PCR = real time–polymerase chain reaction; SD = standard deviation; PI = propidium iodide; Ct = control group; TD = thiamine deficiency; AMP = amprolium; mRNA = messenger RNA; IL = interleukin; TNF‐α = tumor necrosis factor α.
Blocking MCP‐1 ameliorates TD‐induced microglia activation and neuronal death in the thalamus
To further establish the role of MCP‐1 in TD‐induced microglia activation and neurodegeneration in vivo, we injected a MCP‐1 neutralizing antibody to the left SmTN of the thalamus on day 7 of TD, and the control mice were injected with PBS. We then determined the number of neurons (NeuN positive) and microglia (IBA1 positive) on day 9 of TD. As shown in Figure 10, the number of microglia in the left SmTN of mice that were injected with the MCP‐1 neutralizing antibody was 25% less than that of the control group. In contrast, the number of neurons in the left SmTN of mice that were injected with the MCP‐1 neutralizing antibody was 32% more than that of control group. The number of microglia and neurons in the right SmTN of mice shows no difference in the two groups, respectively. Furthermore, we compared TD‐induced microglia activation and neuronal loss between MCP‐1 knockout mice and wild‐type mice. As shown in Figure 11, MCP‐1 knockout mice were less affected by TD. The results indicated that MCP‐1 played a role in TD‐induced microglia recruitment and neurodegeneration.
Figure 10.

The effect of a MCP‐1 neutralizing antibody on TD‐induced microglia recruitment and neuronal death, and in the thalamus. TD was induced in mice as described under the Materials and Methods. On day 7 of TD, PBS or α‐MCP‐1 antibody (4 µg in PBS) was injected to the left SmTN of the thalamus. PBS‐injected mice served as a control. A. and B. On day 9 of TD, mice were sacrificed, and the thalamus was removed for the analysis of IBA1 and NeuN immunohistochemistry. Scale bar = 100 µm. C. and D. Changes of IBA1‐positive microglia and NeuN‐positive neurons in SmTN were quantified by stereological analysis as described under the Materials and Methods. The cell number in the left and right SmTN of mice was presented, separately. Results were presented as means ± SD (n = 7); *P < 0.05 (compared with the groups injected with PBS only). Abbreviations: TD = thiamine deficiency; SmTN = submedial thalamus nucleus; SD = standard deviation; IBA1 = ionized calcium‐binding adaptor molecule‐1; NeuN = neuronal specific nuclear protein; PBS = phosphate buffer saline; mt = mammillothalamic tract; MCP‐1 = monocyte chemoattractant protein‐1.
Figure 11.

TD‐induced microglia recruitment and neuronal death in MCP‐1 knockout mice and wild‐type mice. TD was induced in MCP‐1 knockout mice (CCL2−/−) and wild‐type mice (CCL2+/+) as described under the Materials and Methods. A. and B. On day 9 of TD, mice were sacrificed, and the thalamus was removed for the analysis of IBA1 and NeuN immunohistochemistry as described above. Scale bar = 100 µm. C. and D. Changes of IBA1‐positive microglia and NeuN‐positive neurons in SmTN were quantified by stereological analysis as described as above. Results were presented as means ± SD (n = 5); *P < 0.05 (between CCL2−/− and CCL2+/+ mice). Abbreviations: TD = thiamine deficiency; MCP‐1 = monocyte chemoattractant protein‐1; SmTN = submedial thalamus nucleus; SD = standard deviation; IBA1 = ionized calcium‐binding adaptor molecule‐1; NeuN = neuronal specific nuclear protein; CCL = chemokine C‐C motif ligand; mt = mammillothalamic tract.
DISCUSSION
The animal model of mild impairment of oxidative metabolism (TD) has been used to study the mechanisms of neurodegeneration because the temporal sequence of oxidative stress, microglia recruitment and neurodegeneration is well delineated in this model system 9, 11, 35, 62. With this model system, we identify that neuronal MCP‐1 is a critical mediator that regulates neuron/microglia interaction and plays an important role in neurodegeneration.
Induction of MCP‐1
MCP‐1 is a chemokine constitutively expressed by microglia, astrocytes and neurons at relatively low levels in the brain 4, 56. It has been shown that in response to insults, neurons can secrete chemokines, such as interferon‐inducible protein (IP‐10), fractalkine and MIP‐1α; these chemokines may be responsible for the recruitment of microglia 15, 54, 67. We demonstrate here that TD is able to induce chemokines, and the induction has some specificity. Among chemokines we examined, MCP‐1 is the only one induced by TD. TD‐mediated increase in mRNA and protein of MCP‐1 is observed in the thalamus, but not in the cerebral cortex (Figure 1). The thalamus is more sensitive than the cerebral cortex to TD‐induced damage (9). It was reported that the activity of thiamine‐dependent enzymes in the thalamus but not the cerebral cortex was inhibited by TD 24, 58. It is unclear whether the differential sensitivity of the thalamus and cortex to TD is related to the differential response to MCP‐1 induction. TD induces MCP‐1 in primary cultures of cortical neurons but not in the cerebral cortex (Figure 3). This may be because of the microenvironments, such as the antioxidant system and redox status, being different between in vivo and in vitro settings. It is also likely that cultured cortical neurons were directly exposed to amprolium for TD induction, which may be more traumatic. The induction of MCP‐1 occurred on day 8 following TD, 1 day before the recruitment of microglia and massive neurodegeneration, which usually occurred on day 9 after TD. It is interesting to note that MCP‐1 is only induced in neurons following TD in vitro and in vivo (2, 3). The time sequence for TD's effect appears different between in vitro and in vivo models. MCP‐1 was upregulated in thalamus after 8 days of TD (Figure 1), while it was increased in cultured neurons after 3 days of TD (Figure 3). Therefore, the response of primary neurons to TD is much sooner than thalamus neurons in vivo. This neuron‐specific induction possibly results from TD‐induced free radicals because TD causes ROS accumulation only in neurons, but not in microglia and astrocytes (Figure 8). MCP‐1 is previously shown to be induced in microglia and astrocytes in response to various insults 17, 23, 47, 60. Specific induction of MCP‐1 in neurons by TD offers a good model system to study the function of neuronal MCP‐1.
Role of neuronal MCP‐1
The recruitment of microglia is an important feature of TD, and the co‐localization of microglia and degenerating neurons implies that the microglia may contribute to neurodegeneration 9, 35. TD is able to cause neurodegeneration in neuronal cultures, and both oxidative stress and endoplasmic reticulum stress are potential mechanisms 69, 70. Nevertheless, the presence of microglia drastically exacerbates TD‐induced neuronal death in cultures (Figure 4), supporting the notion that microglia participate in TD‐induced neurodegeneration. The mechanisms regarding how microglia are recruited to affected sites following TD are unknown. It has been reported that MCP‐1 may function as a chemoattractant for microglia and also regulate macrophage/microglia activation 23, 48, 61, 73. In the current study, we provide evidence that neuronal MCP‐1 regulates microglia recruitment and activation. Injection of a MCP‐1 neutralizing antibody to TD animals decreases the amount of microglia in SmTN (Figure 10). In addition, MCP‐1 knockout mice are resistant to TD‐induced microglia activation and neuronal loss (Figure 11). Furthermore, MCP‐1‐treated microglia display the morphology of activated microglia and secrete cytokines IL‐1β and TNF‐α (Figure 7); these cytokines are major players in microglia‐mediated inflammatory processes in TD mice (31). Again, the neutralizing antibody blocks MCP‐1‐mediated changes in microglia. Together, these results indicate that MCP‐1 is a key mediator for microglial recruitment/activation under TD conditions.
Although MCP‐1 is produced from neurons under TD, it seems that it does not injure neurons directly because MCP‐1 by itself does not affect neuronal viability (Figure 5). However, MCP‐1 exhibits neurotoxicity in neuron/microglia co‐cultures (Figure 5), suggesting that MCP‐1's neurotoxic effect has to be mediated by microglia. MCP‐1 activates microglia, which secrete IL‐1β and TNF‐α. IL‐1β and TNF‐α secreted by microglia are reported to cause neurodegeneration 16, 76 and are proposed to contribute to neuronal death in SmTN of TD mice 9, 31. MCP‐1 secreted by neurons under TD is sufficient to activate microglia because the conditioned medium collected from TD neurons activates microglia and induces the production of IL‐1β and TNF‐α from microglia; a neutralizing MCP‐1 antibody partially blocks the effect of neuronal‐conditioned medium (Figure 7). MCP‐1‐induced increase in IL‐1β and TNF‐α is much less than that mediated by LPS, suggesting that MCP‐1 activates microglia to a lesser extent compared with LPS. It is noted that MCP‐1 neutralizing antibody only provides partial protection against TD‐induced neuronal loss. It is likely that other mechanisms are also operating. For example, it is suggested that CD40L and CD40 also play a role in TD‐induced neuronal death 33, 34.
Oxidative stress and MCP‐1
Previous studies implicate that ROS may be involved in chemokine induction during neuronal injury 19, 48, 67. TD‐induced accumulation of ROS and cell death specifically occur in neurons and not in other neural cells such as microglia, astrocytes and brain endothelial cells (Figure 8). This is consistent with previous findings 9, 51, 69. Coincidentally, TD‐induced MCP‐1 is only observed in neurons but not in microglia, astrocytes and endothelial cells. Antioxidants significantly inhibited TD‐induced production of neuronal MCP‐1 (Figure 8) as well as TD‐induced apoptotic neuronal death in neuron/microglia co‐cultures (Figure 9). Antioxidants also effectively reduce TD‐induced secretion of microglial cytokines (IL‐1β and TNF‐α) in neuron/microglia co‐cultures (Figure 9). Furthermore, the administration of antioxidants to TD animals impairs microglia recruitment and ameliorates neurodegeneration (data not shown).
TD induces a neuron‐specific upregulation of MCP‐1 and oxidative stress. A drastic increase of MCP‐1 is observed in reactive astrocytes but not other cell types in MS and experimental allergic encephalomyelitis 53, 63, which is accompanied by an accumulation of ROS in reactive astrocytes 3, 66. We speculate that oxidative stress may mediate neuronal‐specific response to TD. Taken together, our study delineates the following sequence of pathogenesis of TD‐induced neurodegeneration: Neurons are the primary target, and TD initiates oxidative stress in neurons. Oxidative stress is detrimental to neurons and promotes the production and secretion of neuronal MCP‐1, which recruits and activates microglia. Activated microglia further exacerbate neuronal injury. Therefore, neuronal MCP‐1 may be a key mediator of neuron/microglia interaction during neurodegeneration associated with oxidative stress.
ACKNOWLEDGMENTS
We would like to thank Kimberly A. Bower for reading this manuscript. This research was supported by grants from the Ministry of Science and Technology of China (2010CB912000; 2007CB947100), the National Natural Science Foundation of China (30870812 and 30570580), the Knowledge Innovation Program of the Chinese Academy of Sciences (KSCX2‐YW‐R‐115), the Chief Scientist Program of the Shanghai Institutes for Biological Sciences, Chinese Academy of Sciences (SIBS2008006), and the Science and Technology Commission of Shanghai Municipality (grant no. 07DJ14005). Dr Z.J. Ke was also supported by the One Hundred Talents Program of the Chinese Academy of Sciences and Shanghai Pujiang Program. Dr J. Luo was supported by a grant from NIH/NIAAA (AA015407).
REFERENCES
- 1. Akiyama H, Barger S, Barnum S, Bradt B, Bauer J, Cole GM et al (2000) Inflammation and Alzheimer's disease. Neurobiol Aging 21:383–421. [DOI] [PMC free article] [PubMed] [Google Scholar]
- 2. Allan SM, Rothwell NJ (2001) Cytokines and acute neurodegeneration. Nat Rev Neurosci 2:734–744. [DOI] [PubMed] [Google Scholar]
- 3. Antony JM, van Marle G, Opii W, Butterfield DA, Mallet F, Yong VW et al (2004) Human endogenous retrovirus glycoprotein—mediated induction of redox reactants causes oligodendrocyte death and demyelination. Nat Neurosci 7:1088–1095. [DOI] [PubMed] [Google Scholar]
- 4. Banisadr G, Gosselin RD, Mechighel P, Kitabgi P, Rostene W, Parsadaniantz SM (2005) Highly regionalized neuronal expression of monocyte chemoattractant protein‐1 (MCP‐1/CCL2) in rat brain: evidence for its colocalization with neurotransmitters and neuropeptides. J Comp Neurol 489:275–292. [DOI] [PubMed] [Google Scholar]
- 5. Benveniste EN, Nguyen VT, O'Keefe GM (2001) Immunological aspects of microglia: relevance to Alzheimer's disease. Neurochem Int 39:381–391. [DOI] [PubMed] [Google Scholar]
- 6. Biber K, Neumann H, Inoue K, Boddeke HW (2007) Neuronal “on” and “off” signals control microglia. Trends Neurosci 30:596–602. [DOI] [PubMed] [Google Scholar]
- 7. Bubber P, Ke ZJ, Gibson GE (2004) Tricarboxylic acid cycle enzymes following thiamine deficiency. Neurochem Int 45:1021–1028. [DOI] [PubMed] [Google Scholar]
- 8. Butterworth RF (2009) Thiamine deficiency‐related brain dysfunction in chronic liver failure. Metab Brain Dis 24:189–196. [DOI] [PubMed] [Google Scholar]
- 9. Calingasan NY, Chun WJ, Park LC, Uchida K, Gibson GE (1999) Oxidative stress is associated with region‐specific neuronal death during thiamine deficiency. J Neuropathol Exp Neurol 58:946–958. [DOI] [PubMed] [Google Scholar]
- 10. Calingasan NY, Huang PL, Chun HS, Fabian A, Gibson GE (2000) Vascular factors are critical in selective neuronal loss in an animal model of impaired oxidative metabolism. J Neuropathol Exp Neurol 59:207–217. [DOI] [PubMed] [Google Scholar]
- 11. Calingasan NY, Park LC, Calo LL, Trifiletti RR, Gandy SE, Gibson GE (1998) Induction of nitric oxide synthase and microglial responses precede selective cell death induced by chronic impairment of oxidative metabolism. Am J Pathol 153:599–610. [DOI] [PMC free article] [PubMed] [Google Scholar]
- 12. Cameron B, Landreth GE (2010) Inflammation, microglia, and Alzheimer's disease. Neurobiol Dis 37:503–509. [DOI] [PMC free article] [PubMed] [Google Scholar]
- 13. Chen YY, Chen G, Fan Z, Luo J, Ke ZJ (2008) GSK3beta and endoplasmic reticulum stress mediate rotenone‐induced death of SK‐N‐MC neuroblastoma cells. Biochem Pharmacol 76:128–138. [DOI] [PubMed] [Google Scholar]
- 14. D'Mello C, Le T, Swain MG (2009) Cerebral microglia recruit monocytes into the brain in response to tumor necrosis factoralpha signaling during peripheral organ inflammation. J Neurosci 29:2089–2102. [DOI] [PMC free article] [PubMed] [Google Scholar]
- 15. de Jong EK, Dijkstra IM, Hensens M, Brouwer N, van Amerongen M, Liem RS et al (2005) Vesicle‐mediated transport and release of CCL21 in endangered neurons: a possible explanation for microglia activation remote from a primary lesion. J Neurosci 25:7548–7557. [DOI] [PMC free article] [PubMed] [Google Scholar]
- 16. De Lella Ezcurra AL, Chertoff M, Ferrari C, Graciarena M, Pitossi F (2010) Chronic expression of low levels of tumor necrosis factor‐alpha in the substantia nigra elicits progressive neurodegeneration, delayed motor symptoms and microglia/macrophage activation. Neurobiol Dis 37:630–640. [DOI] [PubMed] [Google Scholar]
- 17. Deng YY, Lu J, Ling EA, Kaur C (2009) Monocyte chemoattractant protein‐1 (MCP‐1) produced via NF‐kappaB signaling pathway mediates migration of amoeboid microglia in the periventricular white matter in hypoxic neonatal rats. Glia 57:604–621. [DOI] [PubMed] [Google Scholar]
- 18. Fenoglio C, Galimberti D, Lovati C, Guidi I, Gatti A, Fogliarino S et al (2004) MCP‐1 in Alzheimer's disease patients: A‐2518G polymorphism and serum levels. Neurobiol Aging 25:1169–1173. [DOI] [PubMed] [Google Scholar]
- 19. Flugel A, Hager G, Horvat A, Spitzer C, Singer GM, Graeber MB et al (2001) Neuronal MCP‐1 expression in response to remote nerve injury. J Cereb Blood Flow Metab 21:69–76. [DOI] [PubMed] [Google Scholar]
- 20. Frank‐Cannon TC, Alto LT, McAlpine FE, Tansey MG (2009) Does neuroinflammation fan the flame in neurodegenerative diseases? Mol Neurodegener 4:47. [DOI] [PMC free article] [PubMed] [Google Scholar]
- 21. Frankin KBJ, Paxinos G (2001) The Mouse Brain in Stereotaxic Coordinates, 2nd edn. Academic Press: San Diego, CA. [Google Scholar]
- 22. Fukui H, Moraes CT (2008) The mitochondrial impairment, oxidative stress and neurodegeneration connection: reality or just an attractive hypothesis? Trends Neurosci 31:251–256. [DOI] [PMC free article] [PubMed] [Google Scholar]
- 23. Gao YJ, Zhang L, Samad OA, Suter MR, Yasuhiko K, Xu ZZ et al (2009) JNK‐induced MCP‐1 production in spinal cord astrocytes contributes to central sensitization and neuropathic pain. J Neurosci 29:4096–4108. [DOI] [PMC free article] [PubMed] [Google Scholar]
- 24. Gibson GE, Blass JP (2007) Thiamine‐dependent processes and treatment strategies in neurodegeneration. Antioxid Redox Signal 9:1605–1619. [DOI] [PubMed] [Google Scholar]
- 25. Gibson GE, Huang HM (2004) Mitochondrial enzymes and endoplasmic reticulum calcium stores as targets of oxidative stress in neurodegenerative diseases. J Bioenerg Biomembr 36:335–340. [DOI] [PubMed] [Google Scholar]
- 26. Hazell AS, Butterworth RF (2009) Update of cell damage mechanisms in thiamine deficiency: focus on oxidative stress, excitotoxicity and inflammation. Alcohol Alcohol 44:141–147. [DOI] [PubMed] [Google Scholar]
- 27. Hickman SE, Allison EK, El Khoury J (2008) Microglial dysfunction and defective beta‐amyloid clearance pathways in aging Alzheimer's disease mice. J Neurosci 28:8354–8360. [DOI] [PMC free article] [PubMed] [Google Scholar]
- 28. Jiang W, Desjardins P, Butterworth RF (2009) Cerebral inflammation contributes to encephalopathy and brain edema in acute liver failure: protective effect of minocycline. J Neurochem 109:485–493. [DOI] [PubMed] [Google Scholar]
- 29. Jiang W, Desjardins P, Butterworth RF (2009) Direct evidence for central proinflammatory mechanisms in rats with experimental acute liver failure: protective effect of hypothermia. J Cereb Blood Flow Metab 29:944–952. [DOI] [PubMed] [Google Scholar]
- 30. Jung H, Toth PT, White FA, Miller RJ (2008) Monocyte chemoattractant protein‐1 functions as a neuromodulator in dorsal root ganglia neurons. J Neurochem 104:254–263. [DOI] [PMC free article] [PubMed] [Google Scholar]
- 31. Karuppagounder SS, Shi Q, Xu H, Gibson GE (2007) Changes in inflammatory processes associated with selective vulnerability following mild impairment of oxidative metabolism. Neurobiol Dis 26:353–362. [DOI] [PMC free article] [PubMed] [Google Scholar]
- 32. Kauppinen TM, Higashi Y, Suh SW, Escartin C, Nagasawa K, Swanson RA (2008) Zinc triggers microglial activation. J Neurosci 28:5827–5835. [DOI] [PMC free article] [PubMed] [Google Scholar]
- 33. Ke ZJ, Calingasan NY, DeGiorgio LA, Volpe BT, Gibson GE (2005) CD40‐CD40L interactions promote neuronal death in a model of neurodegeneration due to mild impairment of oxidative metabolism. Neurochem Int 47:204–215. [DOI] [PubMed] [Google Scholar]
- 34. Ke ZJ, Calingasan NY, Karuppagounder SS, DeGiorgio LA, Volpe BT, Gibson GE (2005) CD40L deletion delays neuronal death in a model of neurodegeneration due to mild impairment of oxidative metabolism. J Neuroimmunol 164:85–92. [DOI] [PubMed] [Google Scholar]
- 35. Ke ZJ, DeGiorgio LA, Volpe BT, Gibson GE (2003) Reversal of thiamine deficiency‐induced neurodegeneration. J Neuropathol Exp Neurol 62:195–207. [DOI] [PubMed] [Google Scholar]
- 36. Ke ZJ, Gibson GE (2004) Selective response of various brain cell types during neurodegeneration induced by mild impairment of oxidative metabolism. Neurochem Int 45:361–369. [DOI] [PubMed] [Google Scholar]
- 37. Khoury JE, Luster AD (2008) Mechanisms of microglia accumulation in Alzheimer's disease: therapeutic implications. Trends Pharmacol Sci 29:626–632. [DOI] [PubMed] [Google Scholar]
- 38. Koistinaho M, Koistinaho J (2005) Interactions between Alzheimer's disease and cerebral ischemia—focus on inflammation. Brain Res 48:240–250. [DOI] [PubMed] [Google Scholar]
- 39. Landreth GE (2009) Microglia in central nervous system diseases. J Neuroimmune Pharmacol 4:369–370. [DOI] [PMC free article] [PubMed] [Google Scholar]
- 40. Lee JK, Tran T, Tansey MG (2009) Neuroinflammation in Parkinson's disease. J Neuroimmune Pharmacol 4:419–429. [DOI] [PMC free article] [PubMed] [Google Scholar]
- 41. Lu B, Rutledge BJ, Gu L, Fiorillo J, Lukacs NW, Kunkel SL et al (1998) Abnormalities in monocyte recruitment and cytokine expression in monocyte chemoattractant protein 1‐deficient mice. J Exp Med 187:601–608. [DOI] [PMC free article] [PubMed] [Google Scholar]
- 42. Ludwig J, Binder A, Steinmann J, Wasner G, Baron R (2008) Cytokine expression in serum and cerebrospinal fluid in non‐inflammatory polyneuropathies. J Neurol Neurosurg Psychiatry 79:1268–1273. [DOI] [PubMed] [Google Scholar]
- 43. Luo J, Lindstrom CL, Donahue A, Miller MW (2001) Differential effects of ethanol on the expression of cyclo‐oxygenase in cultured cortical astrocytes and neurons. J Neurochem 76:1354–1363. [DOI] [PubMed] [Google Scholar]
- 44. Mahad DJ, Ransohoff RM (2003) The role of MCP‐1 (CCL2) and CCR2 in multiple sclerosis and experimental autoimmune encephalomyelitis (EAE). Semin Immunol 15:23–32. [DOI] [PubMed] [Google Scholar]
- 45. McGeer PL, McGeer E (2004) Immunotherapy for Alzheimer's disease. Sci Aging Knowledge Environ 2004:pe29. [DOI] [PubMed] [Google Scholar]
- 46. Mhatre M, Floyd RA, Hensley K (2004) Oxidative stress and neuroinflammation in Alzheimer's disease and amyotrophic lateral sclerosis: common links and potential therapeutic targets. J Alzheimers Dis 6:147–157. [DOI] [PubMed] [Google Scholar]
- 47. Muessel MJ, Berman NE, Klein RM (2000) Early and specific expression of monocyte chemoattractant protein‐1 in the thalamus induced by cortical injury. Brain Res 870:211–221. [DOI] [PubMed] [Google Scholar]
- 48. Nakazawa T, Hisatomi T, Nakazawa C, Noda K, Maruyama K, She H et al (2007) Monocyte chemoattractant protein 1 mediates retinal detachment‐induced photoreceptor apoptosis. Proc National Acad Sci U S A 104:2425–2430. [DOI] [PMC free article] [PubMed] [Google Scholar]
- 49. Nishimura M, Kuno S, Mizuta I, Ohta M, Maruyama H, Kaji R, Kawakami H (2003) Influence of monocyte chemoattractant protein 1 gene polymorphism on age at onset of sporadic Parkinson's disease. Mov Disord 18:953–955. [DOI] [PubMed] [Google Scholar]
- 50. Orr CF, Rowe DB, Halliday GM (2002) An inflammatory review of Parkinson's disease. Prog Neurobiol 68:325–340. [DOI] [PubMed] [Google Scholar]
- 51. Park LC, Zhang H, Gibson GE (2001) Co‐culture with astrocytes or microglia protects metabolically impaired neurons. Mech Ageing Dev 123:21–27. [DOI] [PubMed] [Google Scholar]
- 52. Puntambekar S, Doose J, Carson M (2008) Central nervous system diseases and inflammation. In: Microglia: A CNS‐Specific Tissue Macrophage, Chapter 1. Lane, Th.E. , Carson, M. , Bergmann, C. , Wyss‐Coray, T (ed.), pp. 1–12. Springer: New York. [Google Scholar]
- 53. Ransohoff RM, Hamilton TA, Tani M, Stoler MH, Shick HE, Major JA et al (1993) Astrocyte expression of mRNA encoding cytokines IP‐10 and JE/MCP‐1 in experimental autoimmune encephalomyelitis. FASEB J 7:592–600. [DOI] [PubMed] [Google Scholar]
- 54. Rappert A, Bechmann I, Pivneva T, Mahlo J, Biber K, Nolte C et al (2004) CXCR3‐dependent microglial recruitment is essential for dendrite loss after brain lesion. J Neurosci 24:8500–8509. [DOI] [PMC free article] [PubMed] [Google Scholar]
- 55. Rojo AI, Innamorato NG, Martin‐Moreno AM, De Ceballos ML, Yamamoto M, Cuadrado A (2010) Nrf2 regulates microglial dynamics and neuroinflammation in experimental Parkinson's disease. Glia 58:588–598. [DOI] [PubMed] [Google Scholar]
- 56. Rostene W, Kitabgi P, Parsadaniantz SM (2007) Chemokines: a new class of neuromodulator? Nat Rev 8:895–903. [DOI] [PubMed] [Google Scholar]
- 57. Shaftel SS, Carlson TJ, Olschowka JA, Kyrkanides S, Matousek SB, O'Banion MK (2007) Chronic interleukin‐1beta expression in mouse brain leads to leukocyte infiltration and neutrophil‐independent blood brain barrier permeability without overt neurodegeneration. J Neurosci 27:9301–9309. [DOI] [PMC free article] [PubMed] [Google Scholar]
- 58. Shi Q, Karuppagounder SS, Xu H, Pechman D, Chen H, Gibson GE (2007) Responses of the mitochondrial alpha‐ketoglutarate dehydrogenase complex to thiamine deficiency may contribute to regional selective vulnerability. Neurochem Int 50:921–931. [DOI] [PMC free article] [PubMed] [Google Scholar]
- 59. Tansey MG, Wyss‐Coray T (2008) Cytokines in CNS Inflammation and Disease. In: Central nervous system diseases and inflammation. Lane, Th.E. , Carson, M. , Bergmann, C. , Wyss‐Coray, T (ed.), pp. 59–106. Springer: New York. [Google Scholar]
- 60. Tanuma N, Sakuma H, Sasaki A, Matsumoto Y (2006) Chemokine expression by astrocytes plays a role in microglia/macrophage activation and subsequent neurodegeneration in secondary progressive multiple sclerosis. Acta Neuropathol 112:195–204. [DOI] [PubMed] [Google Scholar]
- 61. Thacker MA, Clark AK, Bishop T, Grist J, Yip PK, Moon LD et al (2009) CCL2 is a key mediator of microglia activation in neuropathic pain states. Eur J Pain 13:263–272. [DOI] [PubMed] [Google Scholar]
- 62. Todd KG, Butterworth RF (1999) Early microglial response in experimental thiamine deficiency: an immunohistochemical analysis. Glia 25:190–198. [DOI] [PubMed] [Google Scholar]
- 63. Van Der Voorn P, Tekstra J, Beelen RH, Tensen CP, Van Der Valk P, De Groot CJ (1999) Expression of MCP‐1 by reactive astrocytes in demyelinating multiple sclerosis lesions. Am J Pathol 154:45–51. [DOI] [PMC free article] [PubMed] [Google Scholar]
- 64. Vargas DL, Nascimbene C, Krishnan C, Zimmerman AW, Pardo CA (2005) Neuroglial activation and neuroinflammation in the brain of patients with autism. Ann Neurol 57:67–81. [DOI] [PubMed] [Google Scholar]
- 65. Viola A, Luster AD (2008) Chemokines and their receptors: drug targets in immunity and inflammation. Ann Rev Pharmacol Toxicol 48:171–197. [DOI] [PubMed] [Google Scholar]
- 66. Voskuhl RR, Peterson RS, Song B, Ao Y, Morales LB, Tiwari‐Woodruff S, Sofroniew MV (2009) Reactive astrocytes form scar‐like perivascular barriers to leukocytes during adaptive immune inflammation of the CNS. J Neurosci 29:11511–11522. [DOI] [PMC free article] [PubMed] [Google Scholar]
- 67. Wang HK, Park UJ, Kim SY, Lee JH, Kim SU, Gwag BJ, Lee YB (2008) Free radical production in CA1 neurons induces MIP‐1alpha expression, microglia recruitment, and delayed neuronal death after transient forebrain ischemia. J Neurosci 28:1721–1727. [DOI] [PMC free article] [PubMed] [Google Scholar]
- 68. Wang JY, Wen LL, Huang YN, Chen YT, Ku MC (2006) Dual effects of antioxidants in neurodegeneration: direct neuroprotection against oxidative stress and indirect protection via suppression of glia‐mediated inflammation. Curr Pharm Des 12:3521–3533. [DOI] [PubMed] [Google Scholar]
- 69. Wang X, Fan Z, Wang B, Luo J, Ke ZJ (2007) Activation of double‐stranded RNA‐activated protein kinase by mild impairment of oxidative metabolism in neurons. J Neurochem 103:2380–2390. [DOI] [PubMed] [Google Scholar]
- 70. Wang X, Wang B, Fan Z, Shi X, Ke ZJ, Luo J (2007) Thiamine deficiency induces endoplasmic reticulum stress in neurons. Neuroscience 144:1045–1056. [DOI] [PMC free article] [PubMed] [Google Scholar]
- 71. Xia Z, Dudek H, Miranti CK, Greenberg ME (1996) Calcium influx via the NMDA receptor induces immediate early gene transcription by a MAP kinase/ERK‐dependent mechanism. J Neurosci 16:5425–5436. [DOI] [PMC free article] [PubMed] [Google Scholar]
- 72. Yamashita N, Hoshida S, Otsu K, Taniguchi N, Kuzuya T, Hori M (2000) The involvement of cytokines in the second window of ischaemic preconditioning. Br J Pharmacol 131:415–422. [DOI] [PMC free article] [PubMed] [Google Scholar]
- 73. Zhang J, Shi XQ, Echeverry S, Mogil JS, De Koninck Y, Rivest S (2007) Expression of CCR2 in both resident and bone marrow‐derived microglia plays a critical role in neuropathic pain. J Neurosci 27:12396–12406. [DOI] [PMC free article] [PubMed] [Google Scholar]
- 74. Zhang Q, Ding H, Li W, Fan Z, Sun A, Luo J, Ke ZJ (2009) Senescence accelerated mouse strain is sensitive to neurodegeneration induced by mild impairment of oxidative metabolism. Brain Res 1264:111–118. [DOI] [PubMed] [Google Scholar]
- 75. Zhang Q, Yang G, Li W, Fan Z, Sun A, Luo J, Ke ZJ (2009) Thiamine deficiency increases beta‐secretase activity and accumulation of beta‐amyloid peptides. Neurobiol Aging; doi:10.1016/j.neurobiolaging.2009.01.005 [Epub ahead of print]. [DOI] [PubMed]
- 76. Zhao F, Cai T, Liu M, Zheng G, Luo W, Chen J (2009) Manganese induces dopaminergic neurodegeneration via microglial activation in a rat model of manganism. Toxicol Sci 107:156–164. [DOI] [PubMed] [Google Scholar]