Abstract
The incidence of myelodysplastic syndromes increases with age and a high prevalence of co-morbid conditions has been reported in these patients. So far, risk assessment in myelodysplastic syndromes has been mainly based on disease status. We studied the prognostic impact of comorbidity on the natural history of myelodysplastic syndrome with the aim of developing novel tools for risk assessment. The study population included a learning cohort of 840 patients diagnosed with myelodysplastic syndrome in Pavia, Italy, and a validation cohort of 504 patients followed in Duesseldorf, Germany. Information on comorbidity was extracted from detailed review of the patients’ medical charts and laboratory values at diagnosis and during the course of the disease. Univariable and multivariable survival analyses with both fixed and time-dependent covariates were performed using Cox’s proportional hazards regression models. Comorbidity was present in 54% of patients in the learning cohort. Cardiac disease was the most frequent comorbidity and the main cause of non-leukemic death. In multivariable analysis, comorbidity had a significant impact on both non-leukemic death (P=0.01) and overall survival (P=0.02). Cardiac, liver, renal, pulmonary disease and solid tumors were found to independently affect the risk of non-leukemic death. A time-dependent myelodysplastic syndrome-specific comorbidity index (MDS-CI) was developed for predicting the effect of comorbidity on outcome. This identified three groups of patients which showed significantly different probabilities of non-leukemic death (P<0.001) and survival (P=0.005) also in the validation cohort. Landmark survival analyses at fixed time points from diagnosis showed that the MDS-CI can better define the life expectancy of patients with myelodysplastic syndrome stratified according to the WHO-classification based Prognostic Scoring System (WPSS).Comorbidities have a significant impact on the outcome of patients with myelodysplastic syndrome. Accounting for both disease status by means of the WPSS and comorbidity through the MDS-CI considerably improves risk stratification in myelodysplastic syndromes.
Keywords: risk stratification, comorbidity, myelodysplastic syndrome
Introduction
Myelodysplastic syndromes (MDS) represent one of the most common hematologic malignancies in Western countries.1 Their annual incidence increases dramatically with age, from 0.4 cases per 100,000 under the age of 30 to about 40 cases per 100,000 population over the age of 65.2–4 These figures might nevertheless underestimate the real incidence of myelodysplastic syndromes, as a recent study conducted within US Medicare beneficiaries aged 65 years or more calculated an incidence of 162 per 100,000 for 2003,5 yielding a total of 45,000 new cases per year in the US.
Myelodysplastic syndromes are heterogeneous disorders ranging from indolent conditions with a near-normal life expectancy to forms approaching acute myeloid leukemia (AML).1 The World Health Organization (WHO) classification of myeloid neoplasms6 represents a very useful tool for defining the different subtypes, and also provides prognostic information.7 In fact, unilineage dysplasia is associated with a better prognosis compared with multilineage dysplasia, while the presence of excess blasts involves a worse prognosis.7 Additional disease-related factors of considerable prognostic relevance include cytogenetic abnormalities,8 degree of bone marrow failure, i.e. number and severity of peripheral cytopenias, and bone marrow fibrosis.9
In 1997, Greenberg et al.10 developed the International Prognostic Scoring System (IPSS) for myelodysplastic syndromes, based on percentage of bone marrow blasts, cytogenetic abnormalities, and number of cytopenias. The IPSS has been used widely in clinical decision-making and clinical trials, and also by the US Food and Drug Administration (FDA) and the European Medicines Agency (EMA) in their approval of novel drugs for myelodysplastic syndromes. However, the IPSS does not consider the severity of anemia and transfusion requirement, which are definitely associated with reduced survival in myelodysplastic syndromes.1,5,7,11–13 To overcome this limitation, we developed a prognostic model that accounts for the WHO categories, cytogenetics and transfusion dependency.11 This WHO classification-based prognostic scoring system (WPSS) is able to classify patients into five risk groups with different survival and probability of leukemic evolution. More importantly, it predicts survival and leukemia progression at any time during follow up and can, therefore, be used for implementing risk-adapted treatment strategies.
Older age per se has a negative impact on survival of MDS patients, in particular of those with low disease-related risk.7,10,11 However, age indirectly affects also the survival of high-risk patients by limiting their eligibility to intensive treatments.14,15 In addition, aging is associated with an increasingly high risk of developing comorbidity,16 and a high prevalence of co-morbid diseases has indeed been reported in MDS patients.5,17–19 Clearly, there is a need of properly assessing co-morbid conditions in MDS patients, in both clinical practice and clinical trials.
In 1987, Charlson et al. developed and validated a method for classifying comorbid conditions for use in longitudinal studies, defining the Charlson comorbidity index (CCI).20 More recently, Sorror et al.21 analyzed those chronic medical conditions that predict the risks of non-relapse mortality after allogeneic stem cell transplantation, and developed a hematopoietic cell transplantation (HCT)-specific comorbidity index (HCT-CI) that was shown to be a valuable predictor of transplantation outcomes in patients with acute myeloid leukemia or myelodysplastic syndromes.22,23 The HCT-CI has been found to have prognostic relevance also in myelodysplastic syndrome patients receiving best supportive care17,19 in whom it can capture more comorbidities than the CCI. Nonetheless, both tools have been developed in different clinical settings, and this may considerably limit their usefulness in the general MDS population. As highlighted by Geraci et al.24 the currently available scoring models reflect the common observation that the overall survival of patient populations decreases as the burden of comorbid illness increases, but generally fail to provide information on the underlying mechanisms, e.g. on how a given comorbidity leads to reduced survival.
In this work, we studied the prevalence of comorbidity in myelodysplastic syndrome patients and its relationship with demographic and disease-related factors. We later developed a disease-specific comorbidity index and integrated it with an improved MDS-based prognostic assessment.
Design and Methods
Patients’ characteristics and clinical procedures
These investigations were approved by the local Ethics Committees (Pavia, Italy, and Duesseldorf, Germany), and the procedures followed were in accordance with the Helsinki Declaration of 1975, as revised in 2000.
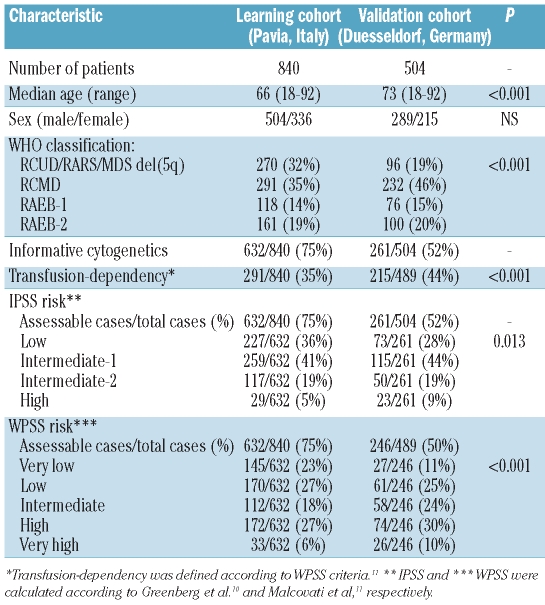
The patient population comprised a “learning cohort” the analysis of which was aimed at defining the set of variables to be included in the prognostic model and their weighted scores, and a “validation cohort”, in which the prognostic value of the scoring system was to be confirmed. The “learning cohort” included 840 consecutive patients diagnosed with myelodysplastic syndromes at the Fondazione IRCCS Policlinico San Matteo, Pavia, Italy, between 1992 and 2007, while the “validation cohort” consisted of 504 patients seen at the Heinrich-Heine-University Hospital, Dusseldorf, Germany, between 1982 and 2006 (Table 1).
Table 1.
Clinical and hematologic characteristics of the Italian and German cohorts of MDS patients classified according to the 2008 WHO criteria.
Until 2001, diagnosis of myelodysplastic syndrome was made according to the FAB criteria;25 in 2002 all cases were reclassified according to the 2001 WHO classification criteria.26 More recently, the 2008 updated WHO classification criteria6,27,28 were applied. The WPSS11 was employed for risk assessment.
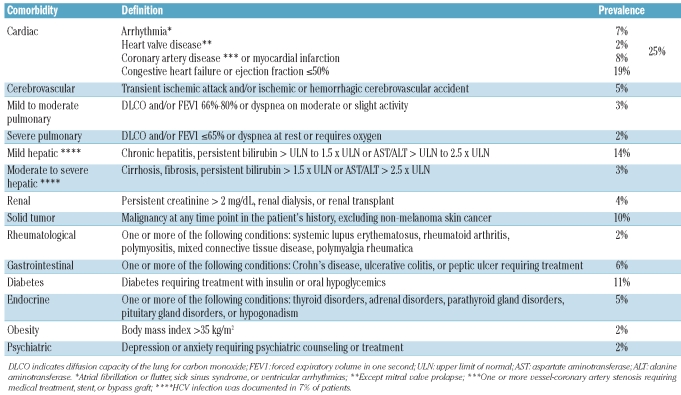
Information on comorbidity was extracted from detailed review of the patients’ medical charts and laboratory values at diagnosis and during the course of the disease. The clinical definition of comorbidities introduced by Sorror et al.21 was adopted (Table 2). The CCI20 and the HCT-CI21 were calculated according to the original reports.17 In the learning cohort, data were available for all 840 patients at the time of diagnosis, while information on comorbidity changes with time was available on 725 patients. In the testing cohort, data were available for all 504 patients at the time of diagnosis, while information on comorbidity changes with time was available on 192 patients.
Table 2.
Definition of comorbidities according to Sorror et al.,21 and their prevalence in the Pavia learning cohort of MDS patients.
Statistical analysis
Numerical variables are summarized by median and range; categorical variables are described with count and relative frequency (%) of subjects in each category. Comparison of numerical variables between groups was carried out using a non-parametric approach (Mann-Whitney test or Kruskall Wallis ANOVA). Comparison of the distribution of categorical variables in different groups was performed with either Fisher’s exact test (2x2 tables) or the χ2 test (larger tables).
Survival analyses were performed with the Kaplan-Meier method. Overall survival (OS) was defined as the time (in months) between the date of diagnosis and the date of death (for cases) or last follow up (for censored patients). Leukemia-free survival (LFS) was defined as the time (in months) between the date of diagnosis and the date of leukemic transformation (for cases) or last follow up (for censored patients). When estimating the occurrence of non-leukemic death (NLD), only deaths for all causes except leukemic evolution were considered as events. Patients who underwent allogeneic transplantation or acute myeloid leukemia (AML)-like chemotherapy were censored at the time of the therapeutic procedure. Where available, clinical variables were analyzed as time-dependent risk factors.
Univariable and multivariable survival analyses with both fixed and time-dependent covariates were performed by means of Cox’s proportional hazards regression models. To decide which parameters of the covariates (categoric, with indicator variables, vs. continuous, with a single parameter) was preferable, we carried out likelihood ratio (LR) tests, none of which were significant. Therefore, we decided to treat all covariates as continuous variables to simplify presentation of the results. Cumulative hazard was estimated with the Aalen-Nelson method. In order to compare different statistical models, we used the LR test and the Akaike information criterion (AIC),29 which allows the evaluation of a model by combining goodness of fit and complexity, a lower AIC indicating a better trade-off between fit and complexity.
Landmark analyses were carried out to illustrate the effect of time-dependent prognostic factors.30 A landmark analysis consists in carrying out a survival analysis in which follow up is set to start some time (namely, the landmark time) after the initial time of entry in the study. This implies that only patients who have survived up to the landmark time point are included in the analysis. The time-dependent risk factors are evaluated at the landmark time point and analyzed as fixed covariates.
Analyses were performed using Statistica 7.0 (Statsoft Inc, Tulsa, OK, USA) and Stata 9 (StataCorp LP, College Station, TX, USA) software. More detailed information about statistical methods is available at http://www.statsoft.com/textbook/ and http://www.stata.com/support/faqs/stat/.
Results
Prevalence of comorbidity in MDS patients and its relationship with demographic and disease-related factors
One or more comorbidities were present at diagnosis in 455 out of 840 (54%) patients in the learning cohort (Table 2). Cardiac disease, found in 25% of patients, was the most frequently observed comorbidity. A significant association was found between age and comorbidity, whose prevalence ranged from 29% in patients under the age of 50 to 71% in those over the age of 75 (P<0.001).
By applying univariable Cox’s regression analysis, the presence of comorbidity at diagnosis significantly affected overall survival (HR 1.51, P=0.001) and probability of non-leukemic death (HR 2.05, P<0.001), while no effect was noticed on leukemia-free survival (HR 0.87, P=0.38). The main causes of non-leukemic death included cardiac failure (63%), infection (23%), hemorrhage (7%) and hepatic failure (4%). There was a significant difference in prevalence of non-leukemic death among WHO subgroups, ranging from 85% of total deaths in RA/RARS to 25% in RAEB-2 (P<0.001), and increased with age, from 43% in patients under the age of 50 to 76% in those over the age of 75 (P=0.002). The negative effect of comorbidity on the probability of non-leukemic death was noticed in all WHO categories (HR 1.94–2.25, P values 0.023-<0.001), while the effect on overall survival was mainly noticeable in sub-groups without blast excess (HR=1.8, P<0.001).
We then evaluated the prognostic effect of comorbidity by a multivariable Cox’s analysis including age, sex, WHO category, cytogenetics and transfusion-dependency, all assessed at the time of diagnosis. Comorbidity showed a significant effect on both overall survival (HR 1.42, P=0.024) and probability of non-leukemic death (HR 1.55, P=0.01). When stratifying by WPSS category, the impact of comorbidity on overall survival and risk of non-leukemic death was significant in the very-low, low, and intermediate WPSS risk groups (OS: HR 3.56–1.95, P values 0.02–0.031; NLD: HR 3.89–2.45, P values 0.01–0.026).
Two-hundred and three patients (24%) developed comorbidity during follow up, the occurrence of cardiac disease representing the most frequent event (39%). In multivariable analysis with time-dependent covariates, the onset of comorbidity at any time during the clinical course had a significant effect on overall survival (HR=1.51, P=0.01) and risk of non-leukemic death (HR=2.29, P<0.001).
Prognostic effect of currently available comorbidity indices and development of an MDS-specific comorbidity index (MDS-CI)
We calculated the HCT-CI and CCI in the learning cohort at the time of diagnosis. In multivariable analysis including age, sex, WHO category, cytogenetics and transfusion-dependency, the CCI did not show any significant effect on the risk of non-leukemic death and overall survival (P=0.13 and P=0.11, respectively), while the HCT-CI showed a borderline effect on the risk of non-leukemic death (HR 1.32, P=0.064) and no effect on overall survival (HR 1.18, P=0.10).
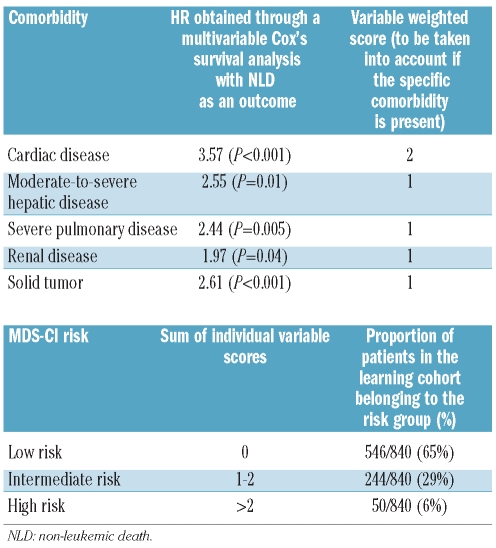
In order to define the MDS-CI, we performed multivariable Cox’s survival analyses with fixed and time-dependent covariates in the learning cohort, including all the comorbidities that were found to have a significant effect on non-leukemic death in univariable analysis (cardiac disease, diabetes, cerebrovascular disease, moderate-to-severe hepatic disease, severe pulmonary disease, renal disease and solid tumor; HR 2.49–4.82, P values ranging between 0.018 and <0.001). Cardiac disease (HR 3.57, P<0.001), moderate to severe liver disease (HR 2.55, P=0.01), severe pulmonary disease (HR 2.44, P=0.005), renal disease (HR 1.97, P=0.04) and solid tumors (HR 2.61, P<0.001) were found to independently affect the risk of non-leukemic death, while diabetes and cerebrovascular disease did not retain their prognostic value. As shown in Table 3, each comorbidity was assigned a score proportional to the regression coefficient of the multivariable Cox’s proportional hazards model. The MDS-CI score was calculated as the sum of these weighted scores, and then categorized into three risk groups: low (score equal to 0), intermediate (score equal to 1 or 2), and high risk (score equal to 3 or higher).
Table 3.
Calculation of the MDS-specific comorbidity index (MDS-CI). The five comorbidities listed were found to be independently associated with the risk of NLD in multivariable analysis, and each of them was assigned a score proportional to the regression coefficient of the multivariable Cox’s proportional hazards model. This score is taken into account if the specific comorbidity is present, and the MDS-CI is obtained as the sum of individual variable scores.
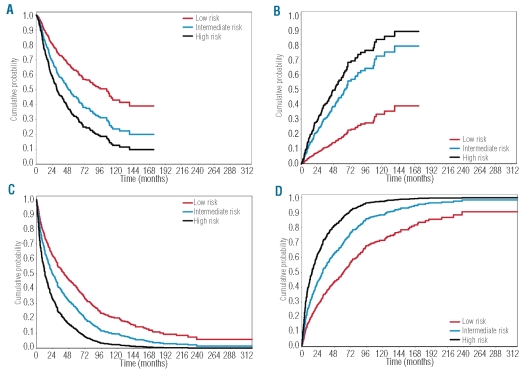
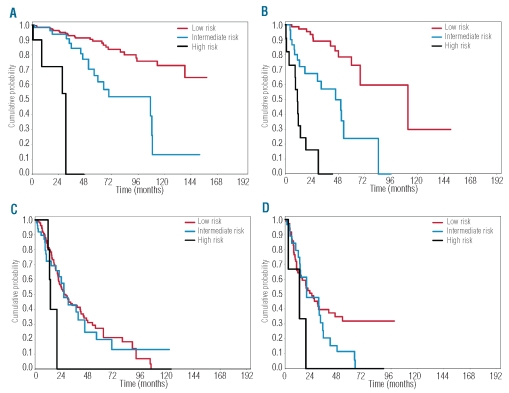
In the learning cohort, 546 (65%) patients were classified as low, 244 (29%) as intermediate, and 50 (6%) as high risk at diagnosis. The MDS-CI risk groups showed significantly different probabilities of overall survival (P<0.001) and non-leukemic death (P<0.001) (Figure 1A). In multivariable analysis considering age, sex, WHO categories, cytogenetics and transfusion-dependency, the MDS-CI maintained a significant effect on both non-leukemic death (HR 1.89, P<0.001) and overall survival (HR 1.67, P<0.001). We carried out the same multivariable analysis without censoring follow up at the time of therapeutic intervention (14% of patients in the learning cohort received erythropoiesis stimulating agents, 1% received immunosuppressive therapy, 4 patients received lenalidomide, 8% received low-dose chemotherapy, 5% underwent AML-like chemotherapy at the time of leukemic evolution, 4% underwent allo-stem cell transplantation, while no patient received treatment with hypomethylating agents). In this model, the MDS-CI retained a significant effect on both non-leukemic death (HR 1.81, P<0.001) and overall survival (HR 1.62, P<0.001).
Figure 1.
Relationship between MDS-CI category, risk of non-leukemic death and overall survival in the learning and validation cohorts of MDS patients. (A–B) Italian learning cohort; (A) Probability of overall survival according to time-dependent MDS-CI risk. (B) Probability of non-leukemic death according to time-dependent MDS-CI risk. (C–D); German validation cohort. (C) Probability of overall survival according to time-dependent MDS-CI risk. (D) Probability of non-leukemic death according to time-dependent MDS-CI risk.
We then evaluated the effect of changes over time of the MDS-CI by time-dependent Cox’s survival analyses. Longitudinal data on comorbidity were available for 725 patients. To exclude potential selection bias, we compared the repeated-measures cohort and patients evaluated at diagnosis only, and found no statistically significant difference in characteristics at diagnosis and overall survival. In univariable analysis, the MDS-CI significantly affected the risk of non-leukemic death (HR 2.80, P<0.001) and overall survival (HR 1.92, P<0.001) (Figure 1A and B). These results were confirmed in multivariable analysis, including age, sex, WHO categories, cytogenetics and transfusion-dependency as time-dependent covariates (NLD: HR 2.89, P<0.001; overall survival: HR 2.41, P<0.001).
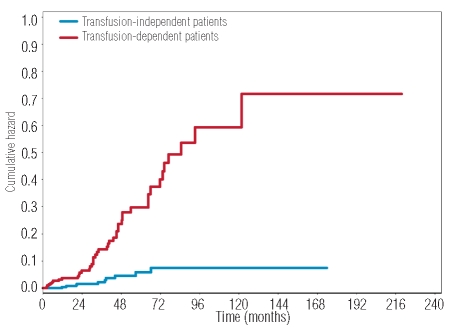
Finally, we calculated the risk of progression to a higher MDS-CI category during the course of the disease. The cumulative hazard of MDS-CI progression was 0.32 for the whole MDS population. A significantly higher risk of MDS-CI progression was found in transfusion-dependent compared with transfusion-independent patients (cumulative hazard: 0.71 vs. 0.09, P<0.001) (Figure 2).
Figure 2.
Risk of progression to a higher MDS-CI category during the course of the disease. Cumulative hazard of MDS-CI progression in the Italian cohort according to the presence or absence of transfusion dependency.
Validation of MDS-CI
The prognostic value of MDS-CI was tested in an independent cohort of 504 patients diagnosed at the Heinrich-Heine-University Hospital, Dusseldorf, Germany. A significant difference between the learning and validation cohorts was found in age (median age 73 years in the German vs. 66 years in the Italian cohorts, P<0.001) as well as in WPSS subgroups, with a higher proportion of higher risk patients in the validation cohort (P<0.001). These differences resulted in Italian patients having a better survival (P=0.001). A significantly higher prevalence of cardiac (39% vs. 25%, P<0.001) and severe pulmonary disease (9% vs. 2%, P<0.001) was found in the validation as compared to the learning cohort.
At diagnosis, 245 out of 504 (49%) patients of the validation cohort were classified as low-risk, 194 (38%) as intermediate-risk and 65 (13%) as high-risk according to the MDS-CI, with a significantly higher proportion of high-risk patients compared to the learning cohort (P<0.001). The MDS-CI risk groups showed significantly different probabilities of overall survival (P=0.005) and non-leukemic death (P<0.001). In multivariable analysis, MDS-CI showed an independent negative effect on both non-leukemic death (HR 1.44, P<0.001) and overall survival (HR 1.30, P<0.001).
We next evaluated the effect of changes over time of the MDS-CI through time-dependent Cox’s survival analyses. Longitudinal data on comorbidity were available for 192 patients. No significant differences in the clinical characteristics at diagnosis and in overall survival were found between the repeated-measures cohort and patients evaluated at diagnosis only. In univariable analysis, the MDS-CI significantly affected the risk of overall survival (HR 2.09, P<0.001) and non-leukemic death (HR 2.46, P<0.001) (Figure 1C and D). These effects were maintained in multivariable analysis (NLD: HR 1.49, P<0.001; OS: HR 1.31, P<0.001).
A comparison of hazard ratios obtained for overall survival and non-leukemic death in the learning and in the validation cohort showed no relevant differences. This was confirmed by a multivariable analysis on the pooled dataset in which there was no significant difference in the effect of the MDS-CI on patient outcome between the two cohorts.
Risk stratification of MDS patients based on both disease status and extra-hematologic comorbidities
In order to verify whether the comorbidity assessment provided by the MDS-CI could improve the WPSS prognostic stratification of myelodysplastic syndrome patients, we fitted two separate multivariable Cox’s time-dependent analyses including age, sex and WPSS category as covariates with and without MDS-CI, respectively, and compared them by the likelihood ratios test. The model comparison resulted in a significant P value (P<0.001), thus confirming the importance of accounting for MDS-CI in the prognostic model. The same result was obtained by using the Akaike information criterion (AIC for the model with vs. without MDS-CI 2,480 vs. 2,585, respectively).
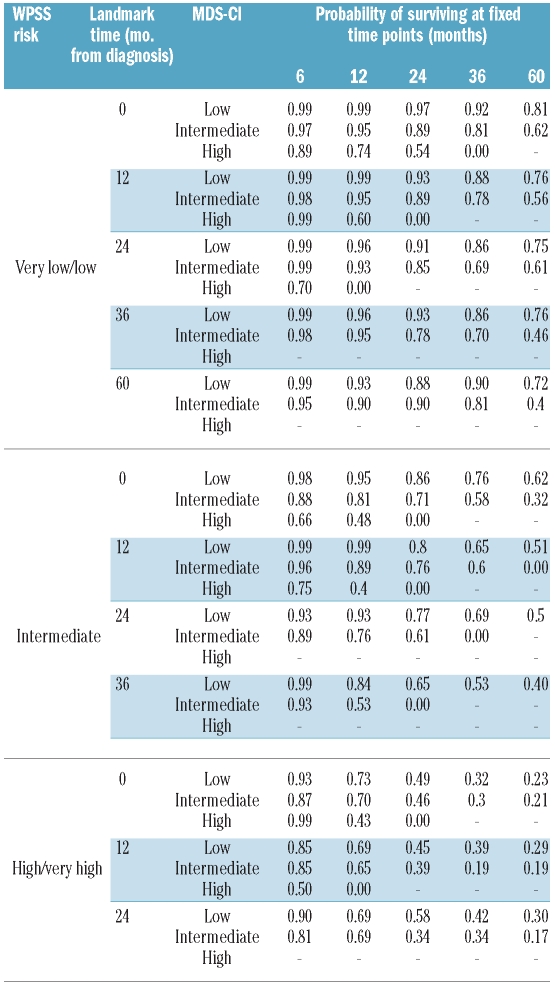
Based on the above observations, we analyzed the interaction between WPSS and MDS-CI in order to establish whether the effect of MDS-CI varied in the WPSS subgroups. The likelihood ratios test resulted statistically significant (P<0.001), thus confirming a different effect of MDS-CI in the WPSS subgroups. We, therefore, carried out stratified time-dependent Kaplan Meyer survival analyses of overall survival in order to assess the prognostic effect of MDS-CI in the five WPSS categories. Patients with very low and low risk were pooled together in a single group because of the small number of patients with high MDS-CI in the WPSS very low risk group. The MDS-CI had a significant effect on overall survival in the very low/low and in the intermediate WPSS risk subgroups (P<0.001 in both analyses) (Figure 3A and B, respectively). In the high and very high WPSS risk categories, no significant difference was found among the three MDS-CI risk groups (Figure 3C and D). However, a significant effect was observed when the low and intermediate MDS-CI risk were pooled in a single group and compared to the high risk group (P=0.04 and P=0.03 in high and very high WPSS group, respectively). The landmark analysis at fixed time points from the diagnosis (6, 12, 24, 36 and 60 months) reported in Table 4 describes probability of survival of patients who have survived up to these time points according to their current WPSS risk and MDS-CI.
Figure 3.
Impact of the MDS-CI category with the WPSS risk groups. (A–D) Probability of overall survival of MDS patients stratified into time-dependent WPSS categories according to time-dependent MDS-CI. (A) Very low and low WPSS risk patients were plotted together in a single group. (B) Intermediate WPSS risk group. (C) High WPSS risk group. (D) Very high WPSS risk group.
Table 4.
Landmark analysis at fixed time points from diagnosis (6, 12, 24, 36 60 months) showing the probability of survival of patients who have survived up to these time points, according to their current WPSS risk and MDS-CI.
Discussion
The findings of this study clearly indicate that comorbidity is very common in myelodysplastic syndrome patients and has a significant impact on their clinical outcome. By combining the effect of five comorbidity factors, we developed a dynamic MDS-CI that proved to be capable of identifying three groups of MDS patients with different probabilities of non-leukemic death and survival, both in the learning and the validation cohort. In addition, the MDS-CI significantly stratified the prognosis of patients classified into WPSS risk groups. Although the retrospective nature of the analysis implies that comorbidity was not uniformly and systematically assessed, possibly leading to an underestimate of its prevalence and changes in time,24 the very fact that the prognostic value of comorbidity was confirmed in a different patient cohort supports the reliability of our findings.
In order to define the prognostic impact of comorbidity in myelodysplastic syndromes, we initially used two available indices, i.e. the CCI20 and the HCT-CI,21 and found that neither of these two scores adequately stratified untreated MDS patients. In fact, the CCI has been developed in a different clinical setting, most of the comorbid conditions included in the CCI are rarely observed in myelodysplastic syndromes and the weights assigned to each comorbidity in this score do not account for possible interactions with disease-specific clinical features. The HCT-CI was originally developed to predict the outcome of patients receiving allogeneic transplantation and is, therefore, unlikely to be equally effective in a more heterogeneous population of patients.18,24 We adopted the same clinical definition of comorbidities as in the HCT-CI, but generated a dynamic MDS-CI aimed at predicting survival and probability of non-leukemic death in MDS patients who did not receive disease-modifying treatments. We selected the comorbidities to be included in the score on the basis of a multivariable regression in order to account for a possible association between different clinical conditions. The obtained score is a linear combination of five clinical conditions, and identifies three risk groups with significantly different probabilities of overall survival and non-leukemic death.
The prognostic value of the MDS-CI was validated in a large independent group of patients. Patients included in this German cohort were found to have a worse outcome with respect to Italian patients, mainly due to older age and higher disease risk. Significant differences in comorbidity prevalence were also noticed, but despite these discrepancies, the three MDS-CI risk groups showed significantly different probabilities of non-leukemic death and overall survival in the validation cohort as they did in the learning cohort. In multivariable analysis, hazard ratios between MDS-CI groups were comparable in size between the two cohorts, suggesting that the prognostic value of the score is reproducible in different patient populations.
The findings of this study indicate that the MDS-CI improves the prognostic stratification of patients classified according to the WPSS, and provide a rational basis for integrating WPSS and MDS-CI in clinical decision making in myelodysplastic syndromes. The MDS-CI significantly affected overall survival and probability of non-leukemic death in patients with very low, low and intermediate WPSS risk,11 while it did not retain a significant effect in high-risk patients. Using a competitive risk approach, we previously showed that non-leukemic death represents the leading cause of death in low-risk subgroups, while the risk of leukemic death significantly exceeds that of non-leukemic death in high-risk patients.18 Taken together, these observations suggest that comorbidity has a different clinical significance in MDS subgroups. In low-risk patients, comorbidity affects the natural history of myelodysplastic syndromes by directly increasing the risk of death. In high-risk patients, the clinical relevance of mild or moderate comorbidity is overcome by the severity of the myelodysplastic syndrome. In these patients, however, comorbidity influences the outcome by limiting both eligibility to treatments and treatment tolerance.21,22 As a consequence, the implementation of comorbidity assessment into clinical practice requires the combined use of different scores. MDS-CI and HCT-CI are based on the same classification of comorbidities and may be used in a complementary manner to estimate the impact of comorbidity on the natural course of the disease and on the outcome after allogeneic transplantation,31–33 respectively, thus providing the information for a proper evidence-based evaluation of the risk-benefit related to the transplantation choice.
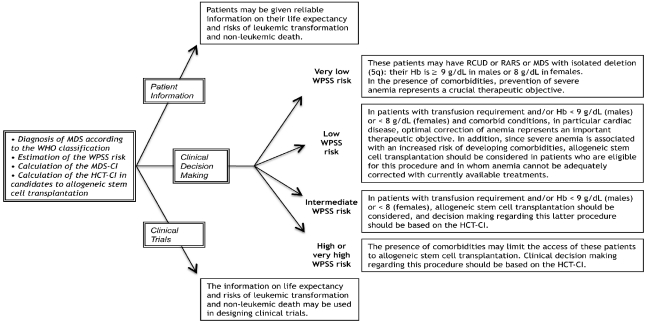
The prognostic relevance of comorbidity may have important implications in the management of myelodysplastic syndromes, as schematically illustrated in Figure 4. In patients with very low and low WPSS risk, who are not candidates for disease-modifying therapies, assessment of comorbidity is essential for defining individual follow-up schedules as well as optimizing supportive care. Among these patients, life expectancy of subjects with isolated erythroid lineage dysplasia aged 70 years or older is not significantly shorter than that of the general population.7 We and others recently reported that treatment of anemia in myelodysplastic syndromes with erythropoietin in selected patients has a positive impact on outcome,35,36 suggesting that preventing or adequately treating symptomatic anemia in myelodysplastic syndromes may result in a survival benefit. Once symptomatic anemia occurs, in patients with clinically relevant comorbidity and in particular cardiac disease, an optimal management is mandatory in order to limit the negative interaction between anemia and cardiac disease.
Figure 4.
Schematic representation of the potential of combined use of WPSS, a disease-related prognostic scoring system, and MDS-CI in clinical decision making in MDS. It should be noted that we have recently shown that in MDS patients hemoglobin levels lower than 9 g/dL in males and 8 g/dL in females are independently related to reduced overall survival.34 Thus, severe anemia in MDS can be defined as a hemoglobin level below these thresholds.
The additional risk of comorbidity should be carefully considered when planning delayed treatment strategies in patients belonging in the low WPSS risk groups.22,37 In fact, patients developing a regular transfusion requirement had a significantly higher risk of developing comorbidity, whose occurrence might affect their eligibility to allogeneic transplantation.15 These observations reinforce the notion that transfusion-dependency should be considered a major parameter to define the timing of intervention in low-risk MDS patients.35
Finally, the integration of WPSS and MDS-CI could be useful in designing clinical trials in myelodysplastic syndromes, in particular when patients classified into higher WPSS risk groups are tested for potential disease-modifying treatments.38 So far, clinical trials have provided little information on comorbidity, as only 20–40% of all phase II and III clinical trials enroll patients aged 65 years or older.39,40 As a consequence, clinicians are provided with a weak base of evidence when applying the results of clinical trials to patients with comorbidity, as elderly MDS patients usually are.
In conclusion, MDS-CI is a dynamic index that adds valuable information to help us predict the outcome of MDS patients. In combination with the WPSS as described in this paper, it may allow clinicians to improve patient information and clinical decision-making, and clinical investigators to design better clinical trials in myelodysplastic syndromes.
Footnotes
Funding: this study was supported by grants from the Associazione Italiana per la Ricerca sul Cancro (AIRC), Fondazione Cariplo, and Regione Lombardia, Milan, Italy to MC.
Authorship and Disclosures
The information provided by the authors about contributions from persons listed as authors and in acknowledgments is available with the full text of this paper at www.haematologica.org.
Financial and other disclosures provided by the authors using the ICMJE (www.icmje.org) Uniform Format for Disclosure of Competing Interests are also available at www.haematologica.org.
References
- 1.Cazzola M, Malcovati L. Myelodysplastic syndromes--coping with ineffective hematopoiesis. N Engl J Med. 2005;352(6):536–8. doi: 10.1056/NEJMp048266. [DOI] [PubMed] [Google Scholar]
- 2.Germing U, Strupp C, Kundgen A, Bowen D, Aul C, Haas R, et al. No increase in age-specific incidence of myelodysplastic syndromes. Haematologica. 2004;89(8):905–10. [PubMed] [Google Scholar]
- 3.Rollison DE, Howlader N, Smith MT, Strom SS, Merritt WD, Ries LA, et al. Epidemiology of myelodysplastic syndromes and chronic myeloproliferative disorders in the United States, 2001–2004, using data from the NAACCR and SEER programs. Blood. 2008;112(1):45–52. doi: 10.1182/blood-2008-01-134858. [DOI] [PubMed] [Google Scholar]
- 4.Tefferi A, Vardiman JW. Myelodysplastic syndromes. N Engl J Med. 2009;361(19):1872–85. doi: 10.1056/NEJMra0902908. [DOI] [PubMed] [Google Scholar]
- 5.Goldberg SL, Chen E, Corral M, Guo A, Mody-Patel N, Pecora AL, et al. Incidence and clinical complications of myelodysplastic syndromes among United States medicare beneficiaries. J Clin Oncol. 2010 Apr 26;2010 doi: 10.1200/JCO.2009.25.2395. [Epub ahead of print] [DOI] [PubMed] [Google Scholar]
- 6.Swerdlow SH, Campo E, Harris NL, Jaffe ES, Pileri SA, Stein H, et al. WHO classification of tumours of haematopoietic and lymphoid tissues. Lyon: IARC; 2008. [Google Scholar]
- 7.Malcovati L, Della Porta M, Pascutto C, Invernizzi R, Boni M, Travaglino E, et al. Prognostic factors and life expectancy in myelodysplastic syndromes classified according to WHO criteria. A basis for clinical decision-making. J Clin Oncol. 2005;23:7594–603. doi: 10.1200/JCO.2005.01.7038. [DOI] [PubMed] [Google Scholar]
- 8.Haase D, Germing U, Schanz J, Pfeilstocker M, Nosslinger T, Hildebrandt B, et al. New insights into the prognostic impact of the karyotype in MDS and correlation with subtypes: evidence from a core dataset of 2124 patients. Blood. 2007;110(13):4385–95. doi: 10.1182/blood-2007-03-082404. [DOI] [PubMed] [Google Scholar]
- 9.Della Porta MG, Malcovati L, Boveri E, Travaglino E, Pietra D, Pascutto C, et al. Clinical relevance of bone marrow fibrosis and CD34-positive cell clusters in primary myelodysplastic syndromes. J Clin Oncol. 2009;27(5):754–62. doi: 10.1200/JCO.2008.18.2246. [DOI] [PubMed] [Google Scholar]
- 10.Greenberg P, Cox C, LeBeau MM, Fenaux P, Morel P, Sanz G, et al. International scoring system for evaluating prognosis in myelodysplastic syndromes. Blood. 1997;89(6):2079–88. [PubMed] [Google Scholar]
- 11.Malcovati L, Germing U, Kuendgen A, Della Porta MG, Pascutto C, Invernizzi R, et al. Time-dependent prognostic scoring system for predicting survival and leukemic evolution in myelodysplastic syndromes. J Clin Oncol. 2007;25(23):3503–10. doi: 10.1200/JCO.2006.08.5696. [DOI] [PubMed] [Google Scholar]
- 12.Kao JM, McMillan A, Greenberg PL. International MDS risk analysis workshop (IMRAW)/IPSS reanalyzed: impact of cytopenias on clinical outcomes in myelodysplastic syndromes. Am J Hematol. 2008;83(10):765–70. doi: 10.1002/ajh.21249. [DOI] [PubMed] [Google Scholar]
- 13.Cazzola M, Malcovati L. Prognostic classification and risk assessment in myelodysplastic syndromes. Hematol Oncol Clin North Am. 2010;24(2):459–68. doi: 10.1016/j.hoc.2010.02.005. [DOI] [PubMed] [Google Scholar]
- 14.Kuendgen A, Strupp C, Aivado M, Hildebrandt B, Haas R, Gattermann N, et al. Myelodysplastic syndromes in patients younger than age 50. J Clin Oncol. 2006;24(34):5358–65. doi: 10.1200/JCO.2006.07.5598. [DOI] [PubMed] [Google Scholar]
- 15.Alessandrino EP, Della Porta MG, Bacigalupo A, Van Lint MT, Falda M, Onida F, et al. WHO classification and WPSS predict posttransplantation outcome in patients with myelodysplastic syndrome: a study from the Gruppo Italiano Trapianto di Midollo Osseo (GITMO) Blood. 2008;112(3):895–902. doi: 10.1182/blood-2008-03-143735. [DOI] [PubMed] [Google Scholar]
- 16.Repetto L, Fratino L, Audisio RA, Venturino A, Gianni W, Vercelli M, et al. Comprehensive geriatric assessment adds information to Eastern Cooperative Oncology Group performance status in elderly cancer patients: an Italian Group for Geriatric Oncology Study. J Clin Oncol. 2002;20(2):494–502. doi: 10.1200/JCO.2002.20.2.494. [DOI] [PubMed] [Google Scholar]
- 17.Zipperer E, Pelz D, Nachtkamp K, Kuendgen A, Strupp C, Gattermann N, et al. The hematopoietic stem cell transplantation comorbidity index is of prognostic relevance for patients with myelodysplastic syndrome. Haematologica. 2009;94(5):729–32. doi: 10.3324/haematol.2008.002063. [DOI] [PMC free article] [PubMed] [Google Scholar]
- 18.Della Porta MG, Malcovati L. Clinical relevance of extra-hematologic comorbidity in the management of patients with myelodysplastic syndrome. Haematologica. 2009;94(5):602–6. doi: 10.3324/haematol.2009.005702. [DOI] [PMC free article] [PubMed] [Google Scholar]
- 19.Sperr WR, Wimazal F, Kundi M, Baumgartner C, Nosslinger T, Makrai A, et al. Comorbidity as prognostic variable in MDS: comparative evaluation of the HCT-CI and CCI in a core dataset of 419 patients of the Austrian MDS Study Group. Ann Oncol. 2010;21(1):114–9. doi: 10.1093/annonc/mdp258. [DOI] [PubMed] [Google Scholar]
- 20.Charlson ME, Pompei P, Ales KL, MacKenzie CR. A new method of classifying prognostic comorbidity in longitudinal studies: development and validation. J Chronic Dis. 1987;40(5):373–83. doi: 10.1016/0021-9681(87)90171-8. [DOI] [PubMed] [Google Scholar]
- 21.Sorror ML, Maris MB, Storb R, Baron F, Sandmaier BM, Maloney DG, et al. Hematopoietic cell transplantation (HCT)-specific comorbidity index: a new tool for risk assessment before allogeneic HCT. Blood. 2005;106(8):2912–9. doi: 10.1182/blood-2005-05-2004. [DOI] [PMC free article] [PubMed] [Google Scholar]
- 22.Sorror ML, Giralt S, Sandmaier BM, De Lima M, Shahjahan M, Maloney DG, et al. Hematopoietic cell transplantation specific comorbidity index as an outcome predictor for patients with acute myeloid leukemia in first remission: combined FHCRC and MDACC experiences. Blood. 2007;110(13):4606–13. doi: 10.1182/blood-2007-06-096966. [DOI] [PMC free article] [PubMed] [Google Scholar]
- 23.Sorror ML, Sandmaier BM, Storer BE, Maris MB, Baron F, Maloney DG, et al. Comorbidity and disease status based risk stratification of outcomes among patients with acute myeloid leukemia or myelodysplasia receiving allogeneic hematopoietic cell transplantation. J Clin Oncol. 2007;25 (27):4246–54. doi: 10.1200/JCO.2006.09.7865. [DOI] [PubMed] [Google Scholar]
- 24.Geraci JM, Escalante CP, Freeman JL, Goodwin JS. Comorbid disease and cancer: the need for more relevant conceptual models in health services research. J Clin Oncol. 2005;23(30):7399–404. doi: 10.1200/JCO.2004.00.9753. [DOI] [PMC free article] [PubMed] [Google Scholar]
- 25.Bennett JM, Catovsky D, Daniel MT, Flandrin G, Galton DA, Gralnick HR, et al. Proposals for the classification of the myelodysplastic syndromes. Br J Haematol. 1982;51(2):189–99. [PubMed] [Google Scholar]
- 26.Vardiman JW, Harris NL, Brunning RD. The World Health Organization (WHO) classification of the myeloid neoplasms. Blood. 2002;100(7):2292–302. doi: 10.1182/blood-2002-04-1199. [DOI] [PubMed] [Google Scholar]
- 27.Brunning RD, Orazi A, Germing U, Le Beau MM, Porwit A, Bauman I, et al. Myelodysplastic syndromes/Neoplasms, overview. In: Swerdlow SH, Campo E, Harris NL, Jaffe ES, Pileri SA, Stein H, et al., editors. WHO classification of tumours of hamatopoietic and lymphoid tissues. Lyon: IARC; 2008. pp. 88–93. [Google Scholar]
- 28.Vardiman JW, Brunning RD, Arber DA, Le Beau MM, Porwit A, Tefferi A, et al. Introduction and overview of the classification of the myeloid neoplasms. In: Swerdlow SH, Campo E, Harris NL, Jaffe ES, Pileri SA, Stein H, et al., editors. WHO classification of tumours of haematopoietic and lymphoid tissues. Lyon: IARC; 2008. pp. 18–30. [Google Scholar]
- 29.Akaike H. A new look at the statistical model identification. IEEE Transactions on Automatic Control. 1974;19(6):716–23. [Google Scholar]
- 30.Anderson JR, Cain KC, Gelber RD. Analysis of survival by tumor response and other comparisons of time-to-event by outcome variables. J Clin Oncol. 2008;26 (24):3913–5. doi: 10.1200/JCO.2008.16.1000. [DOI] [PubMed] [Google Scholar]
- 31.Alessandrino EP, Della Porta MG, Bacigalupo A, Malcovati L, Angelucci E, Van Lint MT, et al. Prognostic impact of pre-transplantation transfusion history and secondary iron overload in patients with myelodysplastic syndrome undergoing allogeneic stem cell transplantation: a GITMO study. Haematologica. 2010;95 (3):476–84. doi: 10.3324/haematol.2009.011429. [DOI] [PMC free article] [PubMed] [Google Scholar]
- 32.de Witte T, Hagemeijer A, Suciu S, Belhabri A, Delforge M, Kobbe G, et al. Value of allogeneic stem cell transplantation versus autologous stem cell transplantation and chemotherapy in patients with myelodysplastic syndromes and secondary acute myeloid leukemia: a prospective randomized European intergroup trial. Haematologica. 2010;95(10):1754–61. doi: 10.3324/haematol.2009.019182. [DOI] [PMC free article] [PubMed] [Google Scholar]
- 33.Kroger N, Zabelina T, van Biezen A, Brand R, Niederwieser D, Martino R, et al. Allogeneic stem cell transplantation for myelodysplastic syndromes with bone marrow fibrosis. 2011;96(2):291–7. doi: 10.3324/haematol.2010.031229. [DOI] [PMC free article] [PubMed] [Google Scholar]
- 34.Ambaglio I, Travaglino E, Della Porta MG, Pascutto C, Ubezio M, Invernizzi R, et al. The impact of the degree of anemia on survival of patients with myelodysplastic syndrome. A basis for prognostic assessment and clinical decision making [abstract] Haematologica. 2010;95(6 Suppl 2):124–5. [Google Scholar]
- 35.Jadersten M, Malcovati L, Dybedal I, Della Porta MG, Invernizzi R, Montgomery SM, et al. Erythropoietin and granulocyte-colony stimulating factor treatment associated with improved survival in myelodysplastic syndrome. J Clin Oncol. 2008;26(21):3607–13. doi: 10.1200/JCO.2007.15.4906. [DOI] [PubMed] [Google Scholar]
- 36.Park S, Grabar S, Kelaidi C, Beyne-Rauzy O, Picard F, Bardet V, et al. Predictive factors of response and survival in myelodysplastic syndrome treated with erythropoietin and G-CSF: the GFM experience. Blood. 2008;111(2):574–82. doi: 10.1182/blood-2007-06-096370. [DOI] [PubMed] [Google Scholar]
- 37.Cutler CS, Lee SJ, Greenberg P, Deeg HJ, Perez WS, Anasetti C, et al. A decision analysis of allogeneic bone marrow transplantation for the myelodysplastic syndromes: delayed transplantation for low-risk myelodysplasia is associated with improved outcome. Blood. 2004;104(2):579–85. doi: 10.1182/blood-2004-01-0338. [DOI] [PubMed] [Google Scholar]
- 38.Deschler B, de Witte T, Mertelsmann R, Lubbert M. Treatment decision-making for older patients with high-risk myelodysplastic syndrome or acute myeloid leukemia: problems and approaches. Haematologica. 2006;91(11):1513–22. [PubMed] [Google Scholar]
- 39.Hutchins LF, Unger JM, Crowley JJ, Coltman CA, Jr, Albain KS. Underrepresentation of patients 65 years of age or older in cancer-treatment trials. N Engl J Med. 1999;341(27):2061–7. doi: 10.1056/NEJM199912303412706. [DOI] [PubMed] [Google Scholar]
- 40.Murthy VH, Krumholz HM, Gross CP. Participation in cancer clinical trials: race-, sex-, and age-based disparities. Jama. 2004;291(22):2720–6. doi: 10.1001/jama.291.22.2720. [DOI] [PubMed] [Google Scholar]


