Abstract
Aims
The density of vasa vasorum within atherosclerotic plaque correlates with histologic features of plaque vulnerability in post-mortem studies. Imaging methods to non-invasively detect vasa vasorum are limited. We hypothesized that contrast ultrasound (CUS) can quantify vasa vasorum during atherosclerosis progression.
Methods and results
New Zealand white rabbits received a high-fat diet for 3 weeks, and bilateral femoral artery stenosis was induced by balloon injury. Contrast ultrasound femoral imaging was performed at baseline and 2, 4, and 6 weeks post injury to quantify adventitial videointensity. At each imaging time point 10 vessels were sectioned and stained with haematoxylin and eosin and von-Willebrand factor. Adventitial vasa vasorum density was quantified by counting the number of stained microvessels and their total cross-sectional area. Plaque size (per cent lumen area) progressed over time (P < 0.001), as did adventitial vasa vasorum density (P < 0.001). Plateau peak videointensity also progressed, demonstrating a strong linear correlation with histologic vasa vasorum density (P < 0.001). Receiver operating characteristic analysis indicated that a three-fold increase in median adventitial videointensity had a sensitivity of 100% and specificity of 88% for predicting abnormal neovascularization.
Conclusion
We have histologically validated that CUS quantifies the development of adventitial vasa vasorum associated with atherosclerosis progression. This imaging technique has the potential for characterizing prognostically significant plaque features.
Keywords: Atherosclerosis, Plaque, Ultrasonics, Contrast media, Angiogenesis
Introduction
Acute coronary syndromes (ACS) are a major cause of morbidity and mortality, accounting for up to 70% of deaths in patients with coronary artery disease.1,2 The causes of progression from an asymptomatic fibroatheromatous plaque to a lesion at high risk for rupture and thrombosis, also known as ‘vulnerable plaque’, are not fully understood.3,4 Moreover, in over 60% of cases the culprit lesions responsible for an ACS are not flow-limiting on coronary angiography,5 underscoring the poor ability of current imaging technologies to prospectively identify lesions that ultimately become unstable.
Changes in the vessel walls that typically accompany rupture-prone atherosclerotic lesions, such as plaque neovascularization, are potential targets for imaging.6–11 During atherogenesis, there is abnormal adventitial vasa vasorum proliferation and intraplaque neovascularization7,10–12 that are associated with plaque rupture and other features of vulnerable plaque, such as a thin fibrous cap, a large necrotic core, and intraplaque hemorrhage.4,6,11,13–15 Because vasa vasorum and plaque neovascularization may be both markers of, as well as etiologic factors in, the development of rupture-prone atherosclerotic plaque,6,13,16 its detection could be of both diagnostic and prognostic importance.
Whereas the histologic features of plaques that rupture are well characterized, methods for imaging them in vivo are limited. Recently, contrast ultrasound (CUS) has emerged as a method for imaging vasa vasorum.17–22 Observational CUS studies of patients with carotid disease have shown acoustic activity within and around plaques and a semiquantitative correlation with endarterectomy specimens.17,18,20 The ability of CUS, however, to be quantitative and to serially follow vasa vasorum density over the time course of plaque evolution, has not been established. Indeed, further validation of this method for quantifying vasa vasorum is a pre-requisite to its clinical application.
Accordingly, in the present study, we tested the hypothesis that CUS can quantify vasa vasorum during atherosclerosis progression. Serial femoral artery CUS imaging was performed in a rabbit model of atherosclerosis, with post-mortem histologic analysis as the reference standard.
Methods
Animal model of accelerated atherosclerosis
A rabbit model of accelerated atherosclerosis was used.23 Twenty New Zealand white rabbits (3.5–4 kg) were fed a high-fat, high-cholesterol diet (peanut oil 2.5%, cholesterol 1%, fat 10%) for 3 weeks. One week after commencing this diet, rabbits were anaesthetized with ketamine (150 mg IM) and xylazine (8 mg IM) and 2.5% inhaled isofluorane. An ear vein was cannulated for ultrasound contrast administration. A 2F Fogarty balloon catheter was introduced to the superficial femoral artery, advanced into the common femoral artery, inflated at 2 atm and advanced and withdrawn three times to induce injury. This procedure was repeated in the contralateral femoral artery, the catheter was removed, and the rabbits recovered.
Contrast ultrasound imaging
Contrast ultrasound of the femoral artery was performed using Definity (diameter 1–4 µm, Lantheus Medical Imaging) as the contrast agent. Rabbits were intravenously administered a 0.2 mL contrast bolus over 10 s during non-linear (10 MHz Contrast Pulse Sequence) imaging of the femoral artery in the longitudinal plane (Sequoia, Siemens). Contrast pulse sequencing is a multi-pulse imaging method utilizing phase and amplitude modulation of the transmit ultrasound combined with cancellation algorithms to detect microbubble-specific signals. After a high power burst frame (mechanical index (MI) of 1.9) to destroy microbubbles, real-time ultrasound imaging (MI 0.3) was performed to capture microbubble reflow into the femoral artery lumen and vasa vasorum. The resolution of our ultrasound imaging system is 0.15 mm, with a dynamic range of 75 dB.
Digitally acquired ultrasound images were analysed off-line using customized CUS software by an observer blinded to experimental condition. Videointensity in each frame was measured in a region of interest drawn in the adventitia of the injured vessel segment. Videointensity data, which relate to the concentration of microbubbles in tissue, were plotted against time elapsed from the destruction pulse and fit to a previously described monoexponential function: Y = A(1 − e−βt), where Y = videointensity, t = time, β = rate of microbubble replenishment (red blood cell velocity), and A = peak plateau intensity (microvascular cross-sectional area).24 Adventitial peak videointensity was normalized to the peak videointensity measured in a luminal region of interest drawn proximal to the area of balloon injury.
Histological analysis
On the final day of the experiment, both femoral arteries were perfusion-fixed using paraformaldehyde infused into the abdominal aorta, excised and paraffin-embedded, and cross-sections were stained for light microscopy (IX81, Olympus) with haematoxylin and eosin (H&E) and von-Willebrand factor (vWF) for endothelium. Additional sections were frozen and stained for macrophages (RAM11) and KDR receptors for vascular endothelial growth factor (VEGF) (CVPath Institute, Inc.; Gaithersburg, MD). Vasa vasorum on digitized images were quantified by counting the total number of vWF-positive microvessels per femoral artery cross-section, as well as their total cross-sectional area (CSA), which was measured by planimetry (Image J software, NIH). Plaque burden (per cent luminal stenosis) was obtained by manual planimetry of vessel cross-sections and defined as [(EEM area − lumen area)/EEM area] × 100, where EEM area is the area inside the external elastic membrane.25 To account for potential variability in vasa vasorum density measurements with vessel size, we also normalized histological vasa vasorum density measurements to EEM area.26
Experimental protocol
Contrast ultrasound was performed just before balloon injury (time 0, control group), and at 2, 4, and 6 weeks after balloon injury. At each time point, five rabbits (10 femorals) were euthanized for histologic correlation.
Statistical analysis
Because the data were not normally distributed, non-parametric statistical methods were used. Results are expressed as medians and interquartile ranges (IQR). Uncorrelated variables were analysed with Kruskal–Wallis rank-test to assess differences across the different time points, and post-hoc individual comparisons were performed with Mann–Whitney test, using Bonferroni's correction for multiple comparisons. Correlated variables were analysed with Friedman two-way ANOVA, with post-hoc individual comparisons using Wilcoxon matched-pairs test, with Bonferroni's correction. Correlation between peak videointensity and vasa vasorum density was performed with Spearman's rho correlation. Non-parametric receiver operating characteristic (ROC) curves were derived to determine sensitivity, specificity, and positive and negative likelihood ratios to characterize the predictive value of CUS to diagnose abnormal vasa vasorum proliferation. To assess interobserver variability for several of the histologic and CUS parameters, two investigators (DM and XL) made measurements on 15% of all data, and Spearman's rho correlation for continuous variables and the Kappa statistic for categorical variables, were derived. As there was no significant association of either CUS or histologic data related to vessels obtained from the same rabbit, a clustering analysis was not performed, and each vessel was treated as an independent sample. Statistical significance was defined as P < 0.05 (two-sided). Statistical analyses were performed with Stata 10.0 (StataCorp, College Station, TX).
Results
Atherosclerosis progression: histologic data (n = 40 vessels)
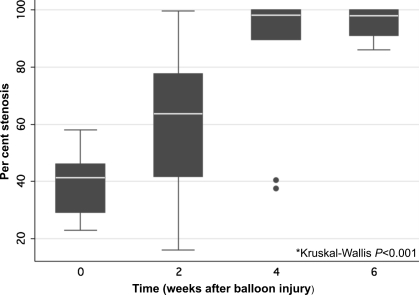
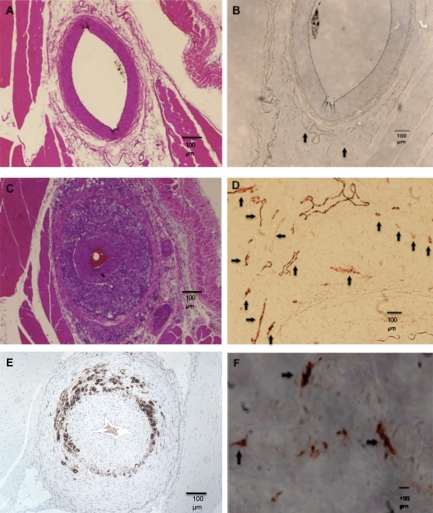
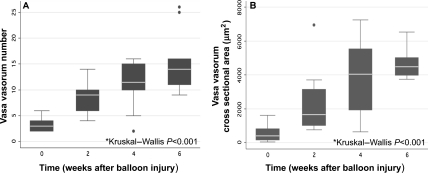
Per cent luminal stenosis increased during the 6 week period: 0 weeks 42% (29–46%) (median and IQR); 2 weeks: 64% (42–78%); 4 weeks: 98% (89–100%); and 6 weeks: 98% (91–100%) (Kruskal–Wallis P < 0.001) (Figure 1). There was a significant difference in per cent luminal stenosis between 0 and 4 weeks (P = 0.018), between 6 and 0 weeks (P < 0.001), and between 6 and 2 weeks (P < 0.01) time points. Femoral artery sections from rabbits euthanized at time 0 and 6 weeks after balloon injury are shown in Figure 2. The atherosclerotic lesions in this model were characterized by progressive neointimal proliferation and macrophage infiltration, with immunostaining demonstrating upregulation of angiogenic receptors (VEGF) (Figure 2F) and abundant macrophages (Figure 2E). Vasa vasorum were visualized in the adventitia (Figure 2B, D) and increased in number (P < 0.001) (Figure 2D, 3A), and total CSA (P < 0.001) (Figure 3B) over time. There was a significant difference in vasa vasorum density by both total vasa vasorum number and vasa vasorum CSA between 0 weeks and any of the other time points (P < 0.01), and between 2 and 6 weeks (P = 0.015).
Figure 1.
Per cent luminal stenosis (medians and interquartile ranges) from histologic sections of rabbit femoral artery.
Figure 2.
Rabbit femoral artery sections taken before (upper panels) and 6 weeks after (middle and lower panels) balloon injury. (A) Haematoxylin and eosin staining showing normal vessel wall before balloon injury. (B) von-Willebrand factor endothelial stains of the same vessel in Panel A, showing scant vasa vasorum (arrows). (C) Six weeks after balloon injury, haematoxylin and eosin stained vessel showing advanced plaque and stenosis. (D) von-Willebrand factor stain of the same vessel in Panel C showing numerous adventitial vasa vasorum (arrows). (E) Immunostaining showing macrophage infiltration (brown) of an advanced lesion. (F) Vascular endothelial growth factor receptor KDR stain (brown) in the adventitia of an advanced lesion, confirming neovascularization.
Figure 3.
Histologic vasa vasorum number (A) and cross-sectional area (B) in femoral artery specimens vs. weeks after balloon injury in all 20 rabbits (n = 10 vessels per time point).
Vasa vasorum number normalized to EEM area increased over time: 19 mm−2 (14–24) (median and IQR) at baseline and 67 (58–73) at 6 weeks (P < 0.001). Vasa vasorum CSA/EEM area also increased over time: 2011 × 10−6 (640–5504 × 10−6) (median and IQR) at baseline vs. 2074 × 10−5 (1684–2157 × 10−5) at 6 weeks (P < 0.001).
Contrast ultrasound imaging
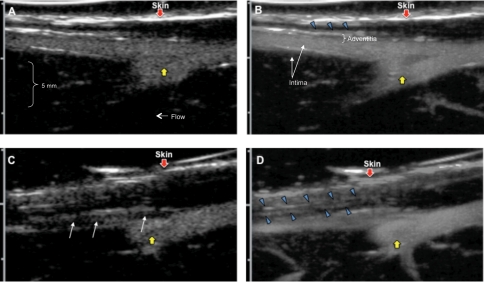
Figure 4 shows serial femoral CUS images obtained in one rabbit at baseline (Figure 4A, B) and 6 weeks (Figure 4C, D) after balloon injury. The images are displayed as maximum intensity projections (MIP), in which the maximum intensity pixels for each frame are retained in each subsequent frame, allowing for single-frame display of the spatial distribution of contrast over time. Two MIP frames are displayed for each time point, with the images on the left (Figure 4A, C) obtained immediately (<1 s) after the destructive imaging pulse, and the images on the right (Figure 4B, D) accumulated over 7 s post-destruction after contrast replenishment. In the baseline images, the vessel lumen fills early and completely (Figure 4A), there is sparse adventitial contrast enhancement, limited to a late-filling linear echodensity consistent with an adventitial vessel (Figure 4B, blue arrowheads). At 6 weeks, the early post-destruction MIP images demonstrate the stenosis as a filling defect in the vessel lumen (white arrows, Figure 4C). The full replenishment MIP images of the same vessel (Figure 4D) depict more adventitial contrast (blue arrowheads). There is more prominent adventitial contrast at 6 weeks (Figure 4D) than 0 weeks (Figure 4B). These findings are shown with greater resolution in Supplementary material online, Movie files.
Figure 4.
Contrast ultrasound of the same femoral arteries in Figure 2, displayed as maximum intensity projection images, before (A, B) and 6 weeks after (C, D) balloon injury. Early post-destruction images are on the left, and late post-destruction (replenishment) images are on the right. Before balloon injury, there is rapid refill of the femoral artery immediately after microbubble destruction (A), and adventitial contrast enhancement can be seen in the delayed maximum intensity projection images (B, blue arrowheads). Six weeks after injury, the early post-destruction image (C) shows a filling defect in the vessel (white arrows), and the delayed maximum intensity projection image (D) shows greater accumulation of adventitial contrast (blue arrowheads), compared with that seen at 0 weeks (B). Yellow arrows point to a branch vessel moving out of the imaging plane. The red arrowhead indicates the skin. The images shown in Figure 4 are also available in two movies (Supplementary material online, Movies).
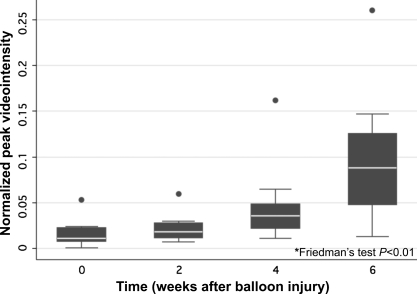
In the five rabbits with serial images during the entire 6 weeks, normalized peak videointensity increased over time: 0 weeks 0.027 (0.020–0.056, median and IQR); 2 weeks: 0.037 (0.033–0.085); 4 weeks: 0.066 (0.051–0.073); 6 weeks 0.192 (0.144–0.249) (P < 0.01) (Figure 5). There was a significant difference between peak videointensity at 0 and 4 weeks (P = 0.03), and between 6 weeks and any of the other time points (P = 0.03).
Figure 5.
Peak videointensity in femoral artery adventitial increased over time in the five rabbits that were serially imaged before (time 0) and 2, 4 and 6 weeks after balloon injury. Data are from two femoral arteries per rabbit, imaged at each of the four time points (n = 40 images).
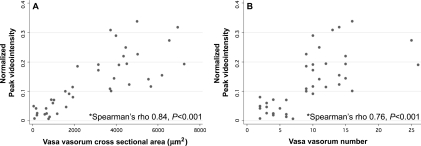
Figure 6 plots the histology vs. concurrent CUS data obtained at the four time points in all 20 rabbits (five rabbits euthanized per time point). There were significant linear correlations between CUS peak videointensity and histologic vasa vasorum CSA (Spearman's rho 0.84, P < 0.001) (Figure 6A) and vasa vasorum number (Spearman's rho 0.76, P < 0.001) (Figure 6B). Similarly, there were significant correlations between peak CUS videointensity and vasa vasorum CSA/EEM area (Spearman's rho 0.81, P < 0.001) and vasa vasorum number/EEM area (Spearman's rho 0.64, P < 0.001). Red blood cell velocity (β) did not predict histologic vasa vasorum density.
Figure 6.
Correlation between contrast ultrasound normalized peak videointensity and histological vasa vasorum cross-sectional area (A) and number (B) in all 20 rabbits (10 vessels per time point).
Diagnostic utility of contrast ultrasound for predicting abnormal neovascularization
We defined abnormal neovascularization as vasa vasorum CSA associated with severe stenosis (>70%). By ROC analysis, a five-fold increase in median vasa vasorum CSA from baseline yielded a 100% sensitivity and 94% specificity for detecting greater than 70% stenosis. Based on a five-fold increase in median vasa vasorum CSA as the cut-off for abnormal neovascularization, additional ROC analyses demonstrated that a three-fold increase in median peak videointensity from baseline had the best diagnostic accuracy for detecting abnormal neovascularization, and was used to define a ‘positive’ CUS. A positive CUS predicted abnormal neovascularization with a sensitivity of 100%, specificity of 88%, and positive and negative likelihood ratios of 8.5 and 0, respectively (P < 0.001). Whereas the pre-test probability of histologic abnormal neovascularization was 58%, the post-test probability was 92% after a positive CUS, and 0% after a negative CUS.
Interobserver variability assessment
There was excellent interobserver agreement on measurements of normalized peak videointensity (Spearman's rho 0.94, P < 0.001), per cent luminal stenosis (Spearman's rho 0.99, P < 0.001), total vasa vasorum number (Spearman's rho 0.94, P < 0.001), and total vasa vasorum CSA (Spearman's rho 0.87, P < 0.001) by histology. When normalized peak videointensity was evaluated as a categorical variable, there was perfect agreement between the raters (κ = 1) regarding identification of elevated peak videointensity (defined as three-fold median increase). Similarly, when total vasa vasorum CSA was assessed as a categorical variable, there was perfect agreement (κ = 1) between the raters regarding identification of abnormal neovascularization (defined as five-fold median increase).
Discussion
The main finding of this study is that quantitative CUS predicts the histologic extent of vasa vasorum proliferation. This is the first study to implement objective, quantitative measures of contrast enhancement to measure vasa vasorum density. Furthermore, this is the first study demonstrating in vivo, serial progression of vasa vasorum proliferation within the same vascular segment as atherosclerosis advances. As such, our data demonstrates the utility of a quantitative approach to CUS of vasa vasorum along a continuum of vasa vasorum densities, which allows serial tracking of vasa vasorum proliferation as a function of time.
Pathophysiologic significance of vasa vasorum
In the absence of atherosclerosis, vasa vasorum are limited to the adventitia and outer media.13,27 Evidence linking abnormal plaque neovascularization to plaque instability comes from pathology studies, as there have heretofore been no in vivo methods for identifying vasa vasorum. In histologic studies of advanced human aortic plaques, the presence of adventitial vasa vasorum correlated with plaque rupture.11 In human plaques obtained after sudden coronary death, increased vasa vasorum density was also strongly associated with plaque rupture.6,7 Vasa vasorum density is dynamic, increasing with hypercholesterolaemia,28 and decreasing with statins28 and other strategies of cholesterol lowering.29 Thus, the study of vasa vasorum is of interest because of its possible etiologic role in plaque progression, as well its potential utility as a marker of plaque vulnerability.
Methods for imaging high-risk features of plaque
Methods for identifying rupture-prone plaques are limited. Coronary angiography provides a ‘lumenogram’, but underestimates true atherosclerotic burden within the vessel wall. An intravascular ultrasound (IVUS) approach to identify the tissue composition of plaque components has been developed based on pattern analysis of raw radiofrequency signals from the ultrasound backscatter.30 Other intravascular techniques are under development for characterizing plaque composition,31 such as optical coherence tomography31 and intracoronary magnetic resonance.31 Unique infrared or laser energy absorption properties of lipid-rich plaques are the basis for plaque detection using near infrared spectroscopy and Raman spectroscopy,31 while intravascular elastography measures plaque mechanical properties.31 These investigational methods have limitations, including low far-field resolution, low molecular sensitivity, interference by blood, lack of structural definition, and motion and flow artefacts.
Because atherosclerosis is a diffuse disease, a patient-specific, rather than plaque-specific approach to coronary stratification utilizing assessment of systemic plaque characteristics has also been suggested.10,32 These strategies have employed whole-body MRI33 or PET imaging34 to quantify total plaque burden or inflammatory activity within plaque, respectively. Like intravascular methods, such approaches require new technology development and complex instrumentation, and spatial resolution remains a challenge.
Contrast ultrasound to image plaque neovascularization
Our data suggest that CUS offers a strategy for either plaque-specific or patient-specific risk stratification of atherosclerotic activity. Because microbubble contrast agents act as red blood cells tracers, the blood-pool within the microcirculation comprising plaque neovascularization can be ultrasonically visualized. Post-mortem histologic data indicate that in patients dying from ACS, vasa vasorum density is abnormally increased even at peripheral arterial sites remote from the culprit coronary lesion,10 suggesting that measurement of carotid vasa vasorum density may provide a ‘window’ to the patient's overall cardiac risk.
Contrast ultrasound evaluation of coronary neovascularization would require an invasive approach using IVUS sensitive for microbubble detection. Recent reports of a harmonic IVUS system suggest that it may be possible to interrogate individual coronary plaques for their neovascular content.35
In the present study, we posited that a pre-requisite to the application of CUS to plaque characterization would be the validation of its ability to quantify neovessel proliferation against a histologic gold standard. We conducted studies in which a spectrum of atherosclerotic severity was represented, and where atherosclerotic progression could be modelled. Contrast ultrasound was serially performed up to 6 weeks after endothelial injury, and at pre-defined time points, a subset of rabbits was euthanized to obtain histologic correlation. We found that peak videointensity, a marker of microvascular volume21 linearly correlated with the histologic indices of vasa vasorum density. The parameter β did not predict neovascularization, suggesting that any increases in flow to the injured vessel wall would be mediated by an increase in vasa vasorum volume.
A unique feature of our study was that a subset of rabbits was survived up to 6 weeks post-balloon injury, permitting within-group evaluation of vasa vasorum evolution. Our serial images suggest there was progressive increase in vasa vasorum density with time. Thus, our study initially validated CUS to quantify vasa vasorum against histologic data, and then used CUS to serially follow vasa vasorum progression.
Another unique feature of our study was that we identified the sensitivity and specificity of CUS for predicting abnormal neovascularization using ROC analysis to identify optimal cut-off points. Because both stenosis severity and vasa vasorum density both increased over time, we defined ‘abnormal neovascularization’ as the vasa vasorum CSA associated with a greater than 70% luminal stenosis. Receiver operating characteristic analysis determined that a five-fold increase in vasa vasorum CSA predicted a >70% stenosis with 100% sensitivity and 94% specificity. Using a five-fold increase in vasa vasorum CSA as the definition of ‘abnormal neovascularization’, a second ROC analysis determined that a three-fold increase in CUS (‘positive CUS’) significantly increased the probability of histologically confirmed abnormal neovascularization, whereas a negative CUS ruled this out.
Study limitations
The rabbit model is one of neointimal proliferation, and while plaques demonstrate adventitial vasa vasorum proliferation and macrophage infiltration, they do not manifest other features that typify advanced human atherosclerotic plaque. Small animal models that fully replicate human vulnerable plaque do not exist.36 The rabbit model used here is a well-characterized surrogate and serves the purpose for proof of concept and validation against histologic specimens.
We did not comprehensively characterize the vascular biology of our rabbit model nor include a non-atherosclerotic control group. Our primary intention was to validate CUS findings against a histologic gold standard, rather than to explore the biology of atherogenesis per se in this animal model, as the latter has been previously extensively characterized by others.36–39 The pre-balloon injury time point permitted data collection before the development of atherosclerosis (such that each rabbit served as its own control) and, in conjunction with data collection up to 6 weeks after balloon injury, enabled as to capture a wide spectrum of neovascularization for CUS and histologic comparison. Finally, our image acquisition relied on 2D long-axis imaging of vessels, which does not fully capture the spatially heterogeneous and asymmetric process of atherogenesis, and could explain the imperfect correlations between imaging and histology data.
Conclusions
Our study histologically confirms that the progression of atherosclerotic plaque is paralleled by proliferation of adventitial vasa vasorum, and that CUS peak videointensity predicts the extent of neovascularization. Our findings provide proof of concept that quantification of vasa vasorum is feasible using CUS. This may have two clinically useful implications: First, this method can be non-invasively applied to imaging carotid plaque neovascularization, which may provide a means to stratify coronary risk on a patient-level. Second, the concepts shown here could form a basis for devising strategies for detecting coronary vasa vasorum using IVUS—i.e. an approach that may lead to plaque-specific strategies to prospectively enhance plaque stability. By identifying the presence of high-risk vascular biology, both of these approaches will also help to guide systemic treatments of atherosclerotic disease using drugs, and CUS can be used to follow the effects of such treatments.
Supplementary material
Supplementary material is available at European Heart Journal online.
Funding
This work was supported by the American Society of Echocardiography [D.M., Career Development Award], and by the National Institutes of Health[F.S.V., RO1HL077534].
Conflict of interest: none declared.
References
- 1.Fowkes FG, Housley E, Cawood EH, Macintyre CC, Ruckley CV, Prescott RJ. Edinburgh Artery Study: prevalence of asymptomatic and symptomatic peripheral arterial disease in the general population. Int J Epidemiol. 1991;20:384–392. doi: 10.1093/ije/20.2.384. doi:10.1093/ije/20.2.384. [DOI] [PubMed] [Google Scholar]
- 2.Fuster V, Fayad ZA, Moreno PR, Poon M, Corti R, Badimon JJ. Atherothrombosis and high-risk plaque: part II: approaches by noninvasive computed tomographic/magnetic resonance imaging. J Am Coll Cardiol. 2005;46:1209–1218. doi: 10.1016/j.jacc.2005.03.075. doi:10.1016/j.jacc.2005.03.075. [DOI] [PubMed] [Google Scholar]
- 3.Schaar JA, De Korte CL, Mastik F, Strijder C, Pasterkamp G, Boersma E, Serruys PW, Van Der Steen AF. Characterizing vulnerable plaque features with intravascular elastography. Circulation. 2003;108:2636–2641. doi: 10.1161/01.CIR.0000097067.96619.1F. doi:10.1161/01.CIR.0000097067.96619.1F. [DOI] [PubMed] [Google Scholar]
- 4.Schaar JA, Muller JE, Falk E, Virmani R, Fuster V, Serruys PW, Colombo A, Stefanadis C, Ward Casscells S, Moreno PR, Maseri A, van der Steen AF. Terminology for high-risk and vulnerable coronary artery plaques. Report of a meeting on the vulnerable plaque, June 17 and 18, 2003, Santorini, Greece. Eur Heart J. 2004;25:1077–1082. doi: 10.1016/j.ehj.2004.01.002. doi:10.1016/j.ehj.2004.01.002. [DOI] [PubMed] [Google Scholar]
- 5.Little WC, Constantinescu M, Applegate RJ, Kutcher MA, Burrows MT, Kahl FR, Santamore WP. Can coronary angiography predict the site of a subsequent myocardial infarction in patients with mild-to-moderate coronary artery disease? Circulation. 1988;78:1157–1166. doi: 10.1161/01.cir.78.5.1157. [DOI] [PubMed] [Google Scholar]
- 6.Virmani R, Kolodgie FD, Burke AP, Finn AV, Gold HK, Tulenko TN, Wrenn SP, Narula J. Atherosclerotic plaque progression and vulnerability to rupture: angiogenesis as a source of intraplaque hemorrhage. Arterioscler Thromb Vasc Biol. 2005;25:2054–2061. doi: 10.1161/01.ATV.0000178991.71605.18. doi:10.1161/01.ATV.0000178991.71605.18. [DOI] [PubMed] [Google Scholar]
- 7.Kolodgie FD, Gold HK, Burke AP, Fowler DR, Kruth HS, Weber DK, Farb A, Guerrero LJ, Hayase M, Kutys R, Narula J, Finn AV, Virmani R. Intraplaque hemorrhage and progression of coronary atheroma. N Engl J Med. 2003;349:2316–2325. doi: 10.1056/NEJMoa035655. doi:10.1056/NEJMoa035655. [DOI] [PubMed] [Google Scholar]
- 8.Khurana R, Zhuang Z, Bhardwaj S, Murakami M, De Muinck E, Yla-Herttuala S, Ferrara N, Martin JF, Zachary I, Simons M. Angiogenesis-dependent and independent phases of intimal hyperplasia. Circulation. 2004;110:2436–2443. doi: 10.1161/01.CIR.0000145138.25577.F1. doi:10.1161/01.CIR.0000145138.25577.F1. [DOI] [PubMed] [Google Scholar]
- 9.Levy AP, Moreno PR. Intraplaque hemorrhage. Curr Mol Med. 2006;6:479–488. doi: 10.2174/156652406778018626. doi:10.2174/156652406778018626. [DOI] [PubMed] [Google Scholar]
- 10.Fleiner M, Kummer M, Mirlacher M, Sauter G, Cathomas G, Krapf R, Biedermann BC. Arterial neovascularization and inflammation in vulnerable patients: early and late signs of symptomatic atherosclerosis. Circulation. 2004;110:2843–2850. doi: 10.1161/01.CIR.0000146787.16297.E8. doi:10.1161/01.CIR.0000146787.16297.E8. [DOI] [PubMed] [Google Scholar]
- 11.Moreno PR, Purushothaman KR, Fuster V, Echeverri D, Truszczynska H, Sharma SK, Badimon JJ, O'Connor WN. Plaque neovascularization is increased in ruptured atherosclerotic lesions of human aorta: implications for plaque vulnerability. Circulation. 2004;110:2032–2038. doi: 10.1161/01.CIR.0000143233.87854.23. doi:10.1161/01.CIR.0000143233.87854.23. [DOI] [PubMed] [Google Scholar]
- 12.Virmani R, Ladich ER, Burke AP, Kolodgie FD. Histopathology of carotid atherosclerotic disease. Neurosurgery. 2006;59:S219–S227. doi: 10.1227/01.NEU.0000239895.00373.E4. Discussion S213–213. [DOI] [PubMed] [Google Scholar]
- 13.Moreno PR, Purushothaman KR, Sirol M, Levy AP, Fuster V. Neovascularization in human atherosclerosis. Circulation. 2006;113:2245–2252. doi: 10.1161/CIRCULATIONAHA.105.578955. doi:10.1161/CIRCULATIONAHA.105.578955. [DOI] [PubMed] [Google Scholar]
- 14.Sluimer JC, Daemen MJ. Novel concepts in atherogenesis: angiogenesis and hypoxia in atherosclerosis. J Pathol. 2009;218:7–29. doi: 10.1002/path.2518. doi:10.1002/path.2518. [DOI] [PubMed] [Google Scholar]
- 15.Sluimer JC, Kolodgie FD, Bijnens AP, Maxfield K, Pacheco E, Kutys B, Duimel H, Frederik PM, van Hinsbergh VW, Virmani R, Daemen MJ. Thin-walled microvessels in human coronary atherosclerotic plaques show incomplete endothelial junctions relevance of compromised structural integrity for intraplaque microvascular leakage. J Am Coll Cardiol. 2009;53:1517–1527. doi: 10.1016/j.jacc.2008.12.056. doi:10.1016/j.jacc.2008.12.056. [DOI] [PMC free article] [PubMed] [Google Scholar]
- 16.Diaz-Flores L, Jr, Madrid JF, Gutierrez R, Varela H, Valladares F, Diaz-Flores L. Cell contribution of vasa-vasorum to early arterial intimal thickening formation. Histol Histopathol. 2007;22:1379–1386. doi: 10.14670/HH-22.1379. [DOI] [PubMed] [Google Scholar]
- 17.Shah F, Balan P, Weinberg M, Reddy V, Neems R, Feinstein M, Dainauskas J, Meyer P, Goldin M, Feinstein SB. Contrast-enhanced ultrasound imaging of atherosclerotic carotid plaque neovascularization: a new surrogate marker of atherosclerosis? Vasc Med. 2007;12:291–297. doi: 10.1177/1358863X07083363. doi:10.1177/1358863X07083363. [DOI] [PubMed] [Google Scholar]
- 18.Giannoni MF, Vicenzini E, Citone M, Ricciardi MC, Irace L, Laurito A, Scucchi LF, Di Piero V, Gossetti B, Mauriello A, Spagnoli LG, Lenzi GL, Valentini FB. Contrast carotid ultrasound for the detection of unstable plaques with neoangiogenesis: a pilot study. Eur J Vasc Endovasc Surg. 2009;37:722–727. doi: 10.1016/j.ejvs.2008.12.028. [DOI] [PubMed] [Google Scholar]
- 19.Magnoni M, Coli S, Marrocco-Trischitta MM, Melisurgo G, De Dominicis D, Cianflone D, Chiesa R, Feinstein SB, Maseri A. Contrast-enhanced ultrasound imaging of periadventitial vasa vasorum in human carotid arteries. Eur J Echocardiogr. 2009;10:260–264. doi: 10.1093/ejechocard/jen221. doi:10.1093/ejechocard/jen221. [DOI] [PubMed] [Google Scholar]
- 20.Coli S, Magnoni M, Sangiorgi G, Marrocco-Trischitta MM, Melisurgo G, Mauriello A, Spagnoli L, Chiesa R, Cianflone D, Maseri A. Contrast-enhanced ultrasound imaging of intraplaque neovascularization in carotid arteries: correlation with histology and plaque echogenicity. J Am Coll Cardiol. 2008;52:223–230. doi: 10.1016/j.jacc.2008.02.082. doi:10.1016/j.jacc.2008.02.082. [DOI] [PubMed] [Google Scholar]
- 21.Feinstein SB. Contrast ultrasound imaging of the carotid artery vasa vasorum and atherosclerotic plaque neovascularization. J Am Coll Cardiol. 2006;48:236–243. doi: 10.1016/j.jacc.2006.02.068. doi:10.1016/j.jacc.2006.02.068. [DOI] [PubMed] [Google Scholar]
- 22.Vicenzini E, Giannoni MF, Puccinelli F, Ricciardi MC, Altieri M, Di Piero V, Gossetti B, Valentini FB, Lenzi GL. Detection of carotid adventitial vasa vasorum and plaque vascularization with ultrasound cadence contrast pulse sequencing technique and echo-contrast agent. Stroke. 2007;38:2841–2843. doi: 10.1161/STROKEAHA.107.487918. doi:10.1161/STROKEAHA.107.487918. [DOI] [PubMed] [Google Scholar]
- 23.Rekhter MD, Hicks GW, Brammer DW, Work CW, Kim JS, Gordon D, Keiser JA, Ryan MJ. Animal model that mimics atherosclerotic plaque rupture. Circ Res. 1998;83:705–713. doi: 10.1161/01.res.83.7.705. [DOI] [PubMed] [Google Scholar]
- 24.Wei K, Jayaweera AR, Firoozan S, Linka A, Skyba DM, Kaul S. Quantification of myocardial blood flow with ultrasound-induced destruction of microbubbles administered as a constant venous infusion. Circulation. 1998;97:473–483. doi: 10.1161/01.cir.97.5.473. [DOI] [PubMed] [Google Scholar]
- 25.Rodriguez-Granillo GA, Garcia-Garcia HM, Valgimigli M, Schaar JA, Pawar R, van der Giessen WJ, Regar E, van der Steen AF, de Feyter PJ, Serruys PW. In vivo relationship between compositional and mechanical imaging of coronary arteries. Insights from intravascular ultrasound radiofrequency data analysis. Am Heart J. 2006;151:1025 e1021–1026. doi: 10.1016/j.ahj.2005.12.018. [DOI] [PubMed] [Google Scholar]
- 26.Kwon HM, Sangiorgi G, Ritman EL, McKenna C, Holmes DR, Jr, Schwartz RS, Lerman A. Enhanced coronary vasa vasorum neovascularization in experimental hypercholesterolemia. J Clin Invest. 1998;101:1551–1556. doi: 10.1172/JCI1568. doi:10.1172/JCI1568. [DOI] [PMC free article] [PubMed] [Google Scholar]
- 27.Werber AH, Heistad DD. Diffusional support of arteries. Am J Physiol. 1985;248:H901–H906. doi: 10.1152/ajpheart.1985.248.6.H901. [DOI] [PubMed] [Google Scholar]
- 28.Wilson SH, Herrmann J, Lerman LO, Holmes DR, Jr, Napoli C, Ritman EL, Lerman A. Simvastatin preserves the structure of coronary adventitial vasa vasorum in experimental hypercholesterolemia independent of lipid lowering. Circulation. 2002;105:415–418. doi: 10.1161/hc0402.104119. doi:10.1161/hc0402.104119. [DOI] [PubMed] [Google Scholar]
- 29.Badimon JJ, Badimon L, Fuster V. Regression of atherosclerotic lesions by high density lipoprotein plasma fraction in the cholesterol-fed rabbit. J Clin Invest. 1990;85:1234–1241. doi: 10.1172/JCI114558. doi:10.1172/JCI114558. [DOI] [PMC free article] [PubMed] [Google Scholar]
- 30.Kaneda H. Re: coronary plaque composition of culprit/target lesions according to the clinical presentation: a virtual histology intravascular ultrasound analysis. Eur Heart J. 2007;28:1784. doi: 10.1093/eurheartj/ehm146. doi:10.1093/eurheartj/ehm146. [DOI] [PubMed] [Google Scholar]
- 31.MacNeill BD, Lowe HC, Takano M, Fuster V, Jang IK. Intravascular modalities for detection of vulnerable plaque: current status. Arterioscler Thromb Vasc Biol. 2003;23:1333–1342. doi: 10.1161/01.ATV.0000080948.08888.BF. doi:10.1161/01.ATV.0000080948.08888.BF. [DOI] [PubMed] [Google Scholar]
- 32.Naghavi M, Falk E, Hecht HS, Jamieson MJ, Kaul S, Berman D, Fayad Z, Budoff MJ, Rumberger J, Naqvi TZ, Shaw LJ, Faergeman O, Cohn J, Bahr R, Koenig W, Demirovic J, Arking D, Herrera VL, Badimon J, Goldstein JA, Rudy Y, Airaksinen J, Schwartz RS, Riley WA, Mendes RA, Douglas P, Shah PK. From vulnerable plaque to vulnerable patient—part III: executive summary of the screening for heart attack prevention and education (SHAPE) task force report. Am J Cardiol. 2006;98:2H–15H. doi: 10.1016/j.amjcard.2006.03.002. [DOI] [PubMed] [Google Scholar]
- 33.Hansen T, Wikstrom J, Johansson LO, Lind L, Ahlstrom H. The prevalence and quantification of atherosclerosis in an elderly population assessed by whole-body magnetic resonance angiography. Arterioscler Thromb Vasc Biol. 2007;27:649–654. doi: 10.1161/01.ATV.0000255310.47940.3b. doi:10.1161/01.ATV.0000255310.47940.3b. [DOI] [PubMed] [Google Scholar]
- 34.Chen W, Bural GG, Torigian DA, Rader DJ, Alavi A. Emerging role of FDG-PET/CT in assessing atherosclerosis in large arteries. Eur J Nucl Med Mol Imaging. 2009;36:144–151. doi: 10.1007/s00259-008-0947-2. doi:10.1007/s00259-008-0947-2. [DOI] [PubMed] [Google Scholar]
- 35.Goertz DE, Frijlink ME, Tempel D, van Damme LC, Krams R, Schaar JA, Ten Cate FJ, Serruys PW, de Jong N, van der Steen AF. Contrast harmonic intravascular ultrasound: a feasibility study for vasa vasorum imaging. Invest Radiol. 2006;41:631–638. doi: 10.1097/01.rli.0000229773.11715.da. doi:10.1097/01.rli.0000229773.11715.da. [DOI] [PubMed] [Google Scholar]
- 36.Schapira K, Heeneman S, Daemen MJ. Animal models to study plaque vulnerability. Curr Pharm Des. 2007;13:1013–1020. doi: 10.2174/138161207780487575. doi:10.2174/138161207780487575. [DOI] [PubMed] [Google Scholar]
- 37.Kolodgie FD, Katocs AS, Largis EE, Wren SM, Cornhill JF, Herderick EE, Lee SJ, Virmani R. Hypercholesterolaemia in the rabbit induced by feeding graded amounts of low-level cholesterol. Methodological considerations regarding individual variability in response to dieatary cholesterol and development of lesion type. Arterioscler Thromb Vasc Biol. 1996;16:1454–1464. doi: 10.1161/01.atv.16.12.1454. [DOI] [PubMed] [Google Scholar]
- 38.Tsukada T, Rosenfeld M, Ross R, Gown AM. Immunocytochemical analysis of cellular components in atherosclerotic lesions. Use of monoclonal antibodies with the Watanabe and fat-fed rabbit. Arteriosclerosis. 1986;6:601–613. doi: 10.1161/01.atv.6.6.601. [DOI] [PubMed] [Google Scholar]
- 39.Bocan TM, Mueller SB, Uhlendorf PD, Ferguson E, Newton RS. Dietary and mechanically induced rabbit iliac-femoral atherosclerotic lesions: a chemical and morphologic evaluation. Exp Mol Pathol. 1991;54:201–277. doi: 10.1016/0014-4800(91)90031-r. doi:10.1016/0014-4800(91)90031-R. [DOI] [PubMed] [Google Scholar]
Associated Data
This section collects any data citations, data availability statements, or supplementary materials included in this article.


