

Abstract
Background
P wave indices are an intermediate phenotype modulated by atrial conduction and electrophysiology. Their clinical correlates and association with all-cause mortality have received limited scrutiny.
Objective
To determine the relationship between P wave indices and cardiovascular and all-cause mortality in the National Health and Nutrition Examination Survey (NHANES), a highly representative United States sample.
Methods
NHANES III (1988 –1994) quantified PR interval and P wave duration and amplitude. Mortality data through 2006 were obtained from National Death Index (NDI) records.
Results
Of 8,561 subjects with electrocardiograms (ECGs), 7,486 (mean age 60.0 ± 13.3 years., 51.9% women, 50.1% ethnic minorities) had ECGs in sinus rhythm, linked mortality data, and complete assessments. Over a median 8.6-year follow-up (range 0.1–12.2 years), there were 679 cardiovascular deaths and 1,559 all-cause mortality deaths. Older age, male sex, and higher body mass index were significantly associated with greater PR interval and P wave duration and with lower P wave amplitude. African Americans had higher mean values of all three P wave indices. In a multivariable model adjusting for cardiovascular risk factors, P wave duration was the only P wave index significantly associated with cardiovascular mortality (hazard ratio [HR] 1.13, per 1 standard deviation [SD], 95% confidence interval [CI] 1.04 –1.23; P = .004) and all-cause mortality (HR 1.06 per 1 SD; 95% CI 1.00 –1.13; P = .050).
Conclusions
In a highly representative U.S. sample, P wave duration was significantly associated with increased cardiovascular and all-cause mortality. P wave duration may reflect subclinical disease and merits elucidation as a marker of risk for adverse outcomes.
Keywords: Electrocardiography, Epidemiology, mortality, Risk factors, NHANES, P waves
Introduction
P wave indices are markers of atrial conduction derived from the electrocardiogram (ECG). P wave indices may reflect the accumulation of subclinical atrial pathology including atrial inflammation, fibrosis, and a quantifiable alteration in atrial conduction.1 Numerous P wave indices have been described, including the PR interval and P wave durations, amplitude, area, and terminal force (the product of the duration and negative phase of lead V1). P wave indices have been studied in a broad context of disease states with a major emphasis on their relation to atrial fibrillation (AF).2 A population-based longitudinal analysis identified multiple P wave indices that are associated with increased risk for adverse cardiovascular outcomes.3
The association of P wave indices with all-cause mortality has had limited investigation. In the Framingham Heart Study, PR interval prolongation was associated with increased risk of pacemaker implantation, AF, and mortality in approximately 40 years of follow-up.4 The Framingham analyses were restricted to individuals of European ancestry and only examined the PR interval as other P wave indices were unavailable.
We hypothesized that P wave indices are associated with mortality risk. P wave indices are an intermediate phenotype for AF are associated with stroke,3 prolong with aging,5 and are highly altered in subjects with ventricular cardiomyopathies and no history of AF.6 Hence we postulated that they reflect subclinical cardiovascular disease and may be altered by multiple disease processes that are associated with increased mortality risk. We analyzed the clinical correlates of P wave indices available in the third National Health and Nutrition Examination Survey (NHANES III), a study with a representative sample of the United States population. We then examined the associations between the available P wave indices and cardiovascular mortality and all-cause mortality. Our objectives were twofold. First, we sought to extend the epidemiologic investigation of P wave indices. Second, as the ECG is a highly accessible, routinely used instrument, we sought to examine the clinical relevance of P wave indices and their association with mortality outcomes.
Methods
NHANES is a periodic survey of the noninstitutionalized civilian population in the United States. Its principal aim is to determine estimates of disease prevalence and health status of children and adults. The survey is directed by the National Center for Health Statistics (NCHS). The survey employs a complex, multistage, clustered design to obtain a representative sample of the United States population, which accounts for differential probabilities in selection and participation. NHANES III was conducted from 1988 to 1994 and entailed screening 39,695 individuals. Of the screened sample of adults and children, 33,994 had a home interview and 30,818 underwent an examination incorporating standardized exams and physiological and laboratory testing. Of 10,157 adults ≥40 years of age participating in the exam, a total of 8,561 underwent an ECG. The present analysis was restricted to the 7,486 subjects with ECGs showing sinus rhythm, available mortality data, medical history, medication usage, and anthropometric measurements. The structure of the survey design, its components, and resulting data are available at http://www.cdc.gov/nchs/nhanes/nh3data.htm. NHANES is a cross-sectional survey and did not include follow-up or repeat ECGs; the outcomes used in the present analysis are derived from the linked mortality data as described below.
ECGs were recorded by trained technicians at the NHANES III mobile examination centers on a Marquette MAC 12 system (Marquette Medical Systems, Inc. Milwaukee, WI). ECG data were subsequently transferred to the NCHS (Hyattsville, MD) for computerized analysis using Minnesota and Novacode algorithms.7 Coding included rhythm analysis, determination of major and minor ECG abnormalities, and selective averaging to obtain representative durations and amplitudes of ECG components. ECG variables selected as the chief exposure for the current analysis included the PR interval (milliseconds), P wave duration in lead II (milliseconds), and P wave amplitude in lead II (microvolts). Heart rate was obtained from the ECG and recorded in beats per minute.
Race and ethnicity were ascertained by multiple sources of data obtained from screening and subject questionnaires. NHANES III separated race into four categories: non-Hispanic white, non-Hispanic black, Mexican American, and other. In the present analysis, alcohol exposure as moderate to heavy was ascertained by subjects' reporting having consumed five or more drinks per day in the prior 12 months. Subjects were classified either as never smoked or as present/former smokers based on having smoked cigarettes in the past five days or having smoked at least 100 cigarettes during their lifetime.
Anthropometric values were obtained from the standardized examination performed by board-eligible physicians. Body mass index (BMI) was calculated in NHANES III using weight and standing height. Blood pressure was obtained after a rest period for a minimum of 5 minutes using a mercury sphygmomanometer and employing a standardized technique.8 Subjects were deemed to have hypertension if they met the Seventh Joint National Committee (JNC-7) criteria defined by a systolic blood pressure ≥140 mmHg or diastolic blood pressure ≥90 mmHg9 or reported either being prescribed medications for hypertension or having been diagnosed with hypertension by a physician.
Laboratory procedures for specimen processing, calibration, standardization, and quality control are documented by the NCHS.10 Subjects were considered to have diabetes if they reported a diagnosis of diabetes, were taking medications for diabetes, or had a serum glucose ≥126 mg/dL after a minimum 8-hour fast.11 A standardized interview elicited self-reports of whether a physician had informed the participant of the following diagnoses: myocardial infarction, stroke, hypertension, and diabetes. Myocardial infarction and stroke were combined for a composite cardiovascular disease status similar to prior NHANES III analyses.12,13
Mortality data were obtained from the NHANES III linked mortality public-use file with follow-up through December 31, 2006.14 Mortality data were constructed by the NCHS using National Death Index records' public-use data set. The data set's construction and comparison to restricted-use mortality files have been described elsewhere.15 Cardiovascular mortality was obtained cause of death using coding from the International Classification of Diseases, Ninth Revision (ICD-9) and the Tenth Revision (ICD-10) as described by NCHS.16 We also used all-cause mortality as an endpoint because of its clinical relevance and lack of misclassification bias.17
The NHANES III survey was approved by the Institutional Review Board of the Centers for Disease Control and Prevention. Participants provided written, informed consent.
Statistical analyses
Descriptive statistics produced for the study sample included means and standard deviations for continuous variables and percentages for categorical variables. P wave duration, amplitude, and PR interval were treated as continuous variables unless stated otherwise. Correlations among P wave indices were evaluated using Pearson's correlation coefficients. The distribution of P wave indices by age and sex were examined graphically using linear regression with restricted cubic splines. All three P wave indices were then considered separately. Kaplan-Meier plots were constructed according to quartiles for each P wave index, and mortality differences were tested using the log-rank test. The associations between P wave indices, considered separately and simultaneously, and cardiovascular and all-cause mortality were examined using Cox proportional hazards regression analysis incorporating multivariable stepwise regression models. To construct Cox models, P wave indices were tested separately and then in a comprehensive model including all three indices. We confirmed the assumption of proportionality of hazards by testing the cumulative sum of Martingale residuals over time and inspecting the simulated residual patterns.18 The association between P wave indices and the mortality outcomes were considered initially by adjustment for age and sex and then adjustment for demographic (sex, age, race), anthropometric (BMI, heart rate), and clinical variables (hypertension, diabetes, ratio of total-to-high-density-lipoprotein cholesterol, and smoking) and prevalent cardiovascular disease. These variables, with the exception of race, were chosen to permit a comparison with the prior Framingham study describing the relation between the PR interval and survival.4
Two-way interactions between P wave indices and age, sex, and race were tested in a secondary analysis. Subjects with a history of cardiovascular disease (myocardial infarction and stroke) were excluded in a further secondary analysis. In further secondary analysis we determined two-way interactions between P wave indices and use of AV nodal agents. We then stratified by use of AV nodal agents to assess the association between the P wave indices and all-cause mortality. All analyses were done using SAS 9.1 (SAS Institute Inc., Cary, NC). Statistical significance was determined as a two-sided P<.05. All analyses incorporated the 6-year sampling weight and adhered to the analytic guidelines articulated by the NCHS.19
Results
The study cohort consists of 7,486 subjects with a mean age of 60.0 ± 13.3 years and range from 40 to 90 years (Table 1). There were 51.9% women. The cohort was nearly 50% white and included only a small number of subjects not categorized as non-Hispanic white, non-Hispanic black, or Mexican-American. The mean BMI was in the overweight range, 27.8 ± 5.5. Fifty-one percent of the sample was defined as having hypertension, consistent with estimates of hypertension prevalence on broader NHANES III samples.20 A minority of subjects reported a history of myocardial infarction or stroke, totaling 806 (10.8%). There were 679 cardiovascular deaths (9.1%) and 1,559 (20.3%) total deaths during a median 8.6 years of (range 0.1–12.2) follow-up.
Table 1.
Baseline characteristics of NHANES III study cohort (n = 7,486)
| Age | 60.0 ± 13.3 |
| Female sex (%) | 3,883 (51.9) |
| Race (%): | |
| White | 3,735 (49.9) |
| Black | 1,674 (22.4) |
| Mexican-American | 1,784 (23.8) |
| Other | 293 (3.9) |
| Moderate to heavy alcohol use (%) | 1,265 (16.9) |
| Smoker (%) | 1,720 (23.0) |
| Body mass index, kg/m2 | 27.8 ± 5.5 |
| Systolic blood pressure, mmHg | 134 ± 26 |
| Diastolic blood pressure, mmHg | 77 ± 23 |
| Ratio, total cholesterol/HDL | 4.7 ± 1.7 |
| AV nodal agents (beta blockers or calcium channel blockers) | 1,205 (16.1) |
| Myocardial infarction (%) | 510 (6.8) |
| Stroke (%) | 296 (4.0) |
| Hypertension (%) | 3,816 (51.0) |
| Diabetes (%) | 1,200 (16.0) |
| Median follow-up duration, years (range) | 8.6 (0.1–12.2) |
| Death during follow-up, cardiovascular (%) | 679 (9.1) |
| Death during follow up, all cause (%) | 1,521 (20.3) |
| Heart rate, bpm | 68 ± 11 |
| PR interval, ms | 165.2 ± 28.1 |
| P wave amplitude, lead II, μV | 134.1 ± 46.7 |
| P wave duration, lead II, ms | 113.0 ± 13.6 |
Note: Values are mean ± standard deviation unless stated otherwise. Variables are as defined in the text.
The distribution of the P wave indices stratified by age and sex are described in Figure 1 using restricted cubic splines. Men had longer mean PR intervals and P wave durations than women. There was further increase with progressively advancing age. In contrast, P wave amplitude demonstrated the reverse pattern; women had greater P wave amplitude than men and there was decreasing amplitude with advancing age. The Supplementary Table 1 describes P wave indices stratified by age and sex in 10-year intervals. Pearson correlation coefficients between the three P wave indices identified a moderate correlation between PR interval and P wave duration, 0.58 (P<.01). PR interval and P wave amplitude had no correlation (r = −0.06; P<.01), as did P wave duration and amplitude (r = 0.03; P<.01).
Figure 1.

Distribution of P-wave indices by age and sex with corresponding splines for PR interval (A), P-wave duration (B), and P-wave amplitude (C) in lead II.
Figure 2 depicts unadjusted cumulative incidence curves for survival by quartiles of P wave indices. The figure shows that subjects in the top quartile of the PR interval and P wave duration had increased mortality compared with the lower three quartiles (log-rank P<.001). Similarly, the lowest quartile of P wave amplitude had the greatest mortality (log-rank P<.001).
Figure 2.

Unadjusted cumulative incidence curves for all-cause mortality, for the P-wave indices of PR interval (A), P-wave duration (B), and P-wave amplitude (C) in lead II by quartile during median follow-up of 8.6 years (range 0.1–12.2 years).
In multiple linear regression analyses, older age, male sex, and higher BMI were significantly associated with greater PR interval and P wave duration and conversely associated with lower P wave amplitude (Table 2). African American race was significantly associated with greater values of all three P wave indices. Cardiovascular disease and hypertension and diabetes were associated with significantly longer mean PR interval and P wave duration. Of particular note, use of AV nodal blocking agents was associated with significantly greater mean PR interval and P wave duration.
Table 2.
Clinical correlates of P wave indices in the NHANES III Survey
| PR interval | P wave amplitude, lead II | P wave duration, lead II | ||||
|---|---|---|---|---|---|---|
| β (SE) | P | β (SE) | P | β (SE) | P | |
| Age | 0.47 (0.02) | <.01 | −0.15 (0.04) | <.01 | 0.25 (0.01) | <.01 |
| Female sex | −6.53 (0.62) | <.01 | 10.91 (1.06) | <.01 | −4.7 (0.30) | <.01 |
| White race | −1.42 (0.80) | .36 | −2.30 (1.36) | .09 | −1.11 (0.39) | <.01 |
| African-American | 6.24 (1.11) | <.01 | 9.47 (1.90) | <.01 | 4.34 (0.54) | <.01 |
| Mexican-American | −3.21 (1.66) | .40 | −8.86 (2.84) | <.01 | 0.68 (0.81) | .40 |
| BMI | 0.50 (0.06) | <.01 | −0.64 (0.10) | <.01 | 0.46 (0.03) | <.01 |
| Smoking, past or present history | −2.84 (0.73) | <.01 | 14.34 (1.24) | <.01 | −.24 (0.36) | .49 |
| Cardiovascular disease | 6.09 (1.16) | <.01 | −1.55 (1.99) | .44 | 3.83 (0.56) | <.01 |
| Hypertension | 3.67 (0.66) | <.01 | 3.19 (1.13) | <.01 | 3.54 (0.32) | <.01 |
| Diabetes | 2.50 (0.98) | .01 | 0.14 (1.69) | .93 | 0.89 (0.48) | .06 |
| Heart rate | −0.31 (0.03) | <.01 | 1.24 (0.05) | <.01 | −0.03 (0.01) | .04 |
| Use of AV nodal blocking agents | 10.09 (0.88) | <.01 | −6.78 (1.53) | <.01 | 4.92 (0.43) | <.01 |
Note: All values are sex- and age-adjusted. Beta estimates are per unit change for continuous variables.
Results of Cox proportional hazards regression analyses are presented in Tables 3 and 4. PR interval was not significantly associated with cardiovascular or all-cause mortality in age-and sex-adjusted analysis or in the multivariable model. P wave amplitude was not associated with cardiovascular mortality in any multivariable analysis; however, it was significantly associated with all-cause mortality in age- and sex-adjusted analyses but not after multivariable adjustment. P wave duration was significantly associated with mortality outcomes across models. In age- and sex-adjusted analyses, P wave duration was associated with cardiovascular mortality (hazard ration [HR] 1.18, 95% CI 1.09–1.29, P<.001) and all-cause mortality (HR 1.08, 95% CI 1.02–1.14, P = .011). In the full multivariable model, P wave duration remained significantly associated with cardiovascular mortality (HR 1.13, 95% CI 1.04–1.23, P = .004) and all-cause mortality (HR 1.06, 95% CI 1.00–1.12, P = .050). The most significant risk estimate for cardiovascular mortality was observed in a multivariable model excluding subjects with cardiovascular disease (HR 1.17, 95% CI 1.05–1.30, P = .005). In a separate multivariable step-wise selection (model entry P = .10) including all three P wave indices, only P wave duration was retained in the model and significantly (HR 1.06, 95% CI 1.00–1.12, P = .04) associated with all-cause mortality. In multivariable analysis excluding individuals with a history of cardiovascular disease, PR interval and P wave amplitude were not associated with mortality. P wave duration had a borderline insignificant association with mortality (HR 1.07, 95% CI 1.00–1.15, P =.056). P wave duration had a significant yet far weaker association with noncardiovascular mortality (HR 1.04, 95% CI 1.02–1.07, P = .01).
Table 3.
Association of P wave indices and cardiovascular mortality, hazard ratioa (HR) ± 95% confidence interval (CI) in the NHANES III survey, with and without adjustment for cardiovascular disease
| Age- and sex-adjusted | P | Multivariable-adjustedb | P | Multivariable-adjusted (excluding subjects with cardiovascular disease)c | P | |
|---|---|---|---|---|---|---|
| PR interval | 1.06 (0.98–1.14) | .15 | 1.05 (0.97–1.14) | .25 | 0.96 (0.87–1.07) | .49 |
| P wave amplitude, lead II | 1.06 (0.97–1.17) | .18 | 0.98 (0.89–1.08) | .64 | 1.03 (0.92–1.15) | .60 |
| P wave duration, lead II | 1.18 (1.09–1.29) | <.001 | 1.13 (1.04–1.23) | .004 | 1.17 (1.05–1.30) | .005 |
Hazard ratios represent 1-standard deviation increment. All P wave indices and outcomes examined in separate analyses.
Multivariable model adjusted for sex, age, race, heart rate, BMI, smoking, ratio of total to high-density lipoprotein cholesterol, hypertension, diabetes, and cardiovascular disease.
Multivariable adjusted for all variables initially included with the exclusion of subjects with cardiovascular disease.
Table 4.
Association of P wave indices and all-cause mortality, HRa ± 95% CI in the NHANES III survey, with and without exclusion of subjects with cardiovascular disease
| Age- and sex-adjusted | P | Multivariable-adjustedb | P | Multivariable-adjusted (excluding cardiovascular disease)c | P | |
|---|---|---|---|---|---|---|
| PR interval | 0.98 (0.93–1.04) | .59 | 1.00 (0.95–1.06) | .97 | 0.97 (0.91–1.04) | .42 |
| P wave amplitude, lead II | 1.09 (1.03–1.16) | .004 | 0.96 (0.91–1.03) | .25 | 1.01 (0.94–1.08) | .83 |
| P wave duration, lead II | 1.08 (1.02–1.14) | .011 | 1.06 (1.00–1.12) | .050 | 1.07 (1.00–1.15) | .056 |
Hazard ratios represent 1 standard deviation increment. All P wave indices and outcomes examined in separate analyses.
Multivariable model adjusted for sex, age, race, heart rate, BMI, smoking, ratio of total to high-density lipoprotein cholesterol, hypertension, diabetes, and cardiovascular disease.
Multivariable adjusted for all variables initially included with the exclusion of subjects with cardiovascular disease.
The clinical relevance of the P wave duration's associations with mortality is indicated by Figures 3A and 3B. The figures graphically demonstrate the increasing hazard per standard deviation prolongation of P wave duration in multivariable-adjusted analyses for all-cause and cardiovascular mortality. Figure 3A, for example, indicates that a P wave duration at the second or third standard deviation, 140 and 154 ms, respectively, conveys significant risk for all-cause mortality after comprehensive multivariable adjustment for clinical risk factors. The figure further indicates that the HR associated with P wave duration is most significant at the extremes beyond the second (HR 2.14) and third (HR 3.21) standard deviations from the mean.
Figure 3.
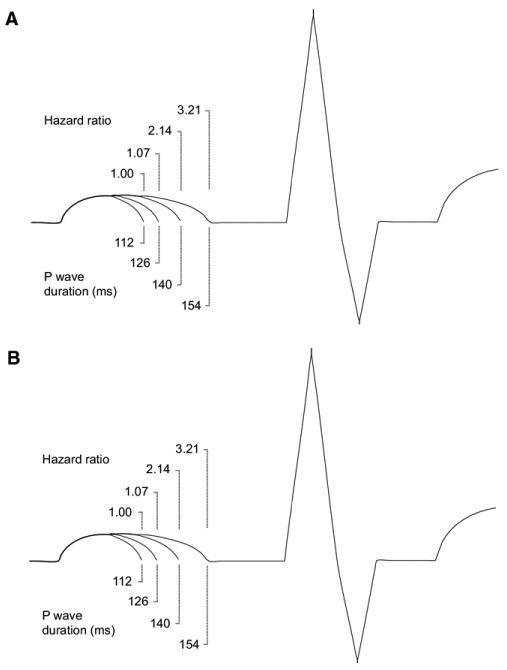
Representation of ECGs showing the increasing HR for all-cause mortality in multivariable analysis incorporating sex, age, race, heart rate, BMI, smoking, ratio of total to high-density lipoprotein cholesterol, hypertension, and diabetes. The figure shows the corresponding, progressive increase of P wave duration by standard deviation with the respective, associated HR for (A) all-cause mortality and (B) cardiovascular mortality.
The interaction terms for AV nodal agents and P wave indices were significantly associated with all-cause mortality when introduced into multivariable models testing P wave indices and all-cause mortality (P<.0001 for PR interval and P wave duration and P = .0012 for P wave amplitude). We then conducted an analysis stratified by use of AV nodal agents with results as described in Supplementary Table 2. Stratification demonstrated that PR interval and P wave duration were significantly associated with all-cause mortality in the stratum of NHANES III participants using AV nodal agents (n = 1,230). In contrast, none of the P wave indices were associated with mortality in the stratum not using AV nodal agents (n = 6,483). When interactions for sex, age, and race were incorporated into the multivariable models testing the P wave indices and survival, none of the interaction terms were significantly associated with cardiovascular or all-cause mortality.
Discussion
We examined P wave indices' association with cardiovascular and all-cause mortality in a multiracial, nationally representative cohort of adults 40 years of age or older. We determined the P wave indices' age- and sex-adjusted relations to all-cause mortality and then in comprehensive multivariable analyses we identified an association between P wave duration and cardiovascular and all-cause mortality. Mortality in the NHANES III cohort after an average of 8 years of follow-up was 20.2%, equivalent to 1999–2006 U.S. death rates in individuals age 45 years or more as reported by the National Vital Statistics System.21
The strongest association we observed was between P wave duration and cardiovascular mortality. In a multivariable model, the HR was 1.13 (95% CI 1.04 –1.23, P = .004). When subjects with cardiovascular disease were excluded in an identical multivariable model, the HR was 1.17 (95% CI 1.05–1.30, P = .005). Thus, in multivariable models including demographic, anthropometric, and cardiovascular risk factors, we identified a modest but significant association between P wave duration and cardiovascular mortality. We identified a less robust association between P wave duration and all-cause mortality in the multivariable analysis (HR 1.06, 95% CI 1.00 –1.12, P = .050), which was no longer significant in multivariable analysis excluding subjects with cardiovascular disease (HR 1.07, 95% CI 1.00 –1.15, P = .056). When all three P wave indices were assessed together, only P wave duration emerged as significantly associated with all-cause mortality. These findings establish that in the NHANES cohort, prolonged P wave duration carries an adverse association with mortality. In multivariable analysis excluding individuals with prevalent cardiovascular disease, P wave duration was associated with cardiovascular mortality. The clinical implications of these findings are demonstrated by our finding that a P wave duration of 154 ms conveys a three-fold all-cause mortality risk in individuals 40 – 80 years old without prevalent cardiovascular disease after multivariable adjustment for age, sex, race, BMI, and other factors.
We further found that the PR interval and P wave duration were longer in men than in women in all age groups and became progressively prolonged with advancing age. A reverse trend was noted for P wave amplitude in lead II. We depicted these trends by comparing the age- and sex-adjusted restricted splines, which showed clear evidence supporting these trends. These observations have been confirmed in other studies employing signal-average ECGs22–24 and in reference ranges derived from an international registry.25
Comparison with the prior literature
P wave indices have had limited study in population-based or representative cohorts; the development of these indices has been constrained by challenges to measurement technique, studies of small sample size, absence of long-term follow-up, and failure to adjust for confounders.2 Hence the present study is one of a small number of studies to examine P wave indices in a representative cohort. The unique strength of the current study consists in NHANES's nationally representative design, enhancing its generalizability beyond prior studies of P wave indices.
In the current analysis, P wave duration's HR per standard deviation for mortality was 1.08 (95% CI 1.02–1.14). A recent analysis of PR interval and long-term outcomes in the Framingham Heart Study had a similar estimate.4 PR interval was not associated with increased mortality in the present analysis, and the Framingham study did not include P wave duration. While similarities between Framingham and NHANES have been established,26 the present study had considerably shorter follow-up.
In a large population-based study, P wave duration in lead II was strongly associated with increased risk of incident AF (HR per standard deviation 1.80, 95% CI 1.49–2.20).3 Of note, that study did not adjust for use of AV nodal agents in determining the association between P wave indices and AF. Assessment of longitudinal outcomes other than mortality is not possible using NHANES. Hence we are unable in the present analysis to assess the association of P wave indices with AF, need for pacemaker, stroke, or progression to other conduction disease.
Potential mechanisms for the relation between P-wave duration and mortality
The PR interval reflects comprehensive atrial conduction from sinus node activation through the atrioventricular node. In contrast atrial and interatrial electrophysiologic conduction generates the P wave. We hypothesize that abnormalities in P wave duration reflect insults from manifest or subclinical diseases and constitute a noninvasive barometer of clinical status. To our knowledge, P wave amplitude has had less evaluation with regard to risk of outcomes. It was not included in prior studies employing digital ECG quantification and analysis3,27 and requires further exploration and validation in other contexts.
Abnormal P wave indices have been associated with diastolic dysfunction,28 hypertension,28,29 obesity,30–32 diabetes,33 and a range of other adverse cardiac disease states associated with increased mortality. These diseases alter atrial electrophysiologic conduction. Atrial tissue in diabetic subjects, for example, demonstrates persistent oxidative stress compared with nondiabetics34; whether these changes correlate with abnormal P wave indices has not been demonstrated. In individuals with left ventricular dysfunction and no history of AF, atrial conduction is highly abnormal, consisting of fractionated electrograms, profibrillatory changes in refractory periods, and prolonged P wave duration.6 Electroanatomical studies of atrial conduction show decreased voltage, slower conduction, double potentials, and fractionation in older subjects with no history of AF.5 Further studies are necessary to correlate P wave indices, inflammatory markers, histopathologic changes, and electrophysiologic properties.
Degenerative atrial conduction may also be a product of more extensive impairment in the cardiac conduction system or result from the atrial electrical abnormalities that accompany sinus node disease.35 Prolongation of P wave duration has been associated with a twofold increased risk of AF and an increased risk of ischemic stroke in a multiethnic, population-based study.3 AF potentiates heart failure and conveys an increased mortality risk.36,37 It is possible that individuals in our study had interim AF, strokes, heart failure, or complications from heart block contributing to their mortality.
We identified significant interaction between use of AV nodal agents and P wave indices. As indicated by Supplementary Table 2, when we stratified by use of AV nodal agents, the associations between two of the P wave indices (PR interval and P wave duration) and survival only persisted in the stratum using AV nodal agents. We created the initial models adjusting for established risk factors for mortality including cardiovascular disease and hypertension. It seems unlikely that AV nodal blockers per se are associated with increased risk for mortality. Rather we speculate that the AV nodal agents may represent as confounding, likely owing to an indication bias of an uncertain nature. Additional studies will be required to replicate these findings and elucidate the etiology of the confounding. Our findings indicate the importance and relevance of including AV nodal agents in subsequent outcomes analyses for P wave indices.
Our results complement other literature assessing the relevance of quantitative electrocardiography to mortality outcomes. For example, an analysis of predominantly male, middle-aged veterans (mean age 56 ±15 years) found a significant increase in cardiovascular mortality with prolonged QRS duration after adjusting for age, sex, and heart rate.38 Similarly, the association between QT interval prolongation and sudden death has been well established.39,40 Further studies are essential to establish the utility of P wave indices as an intermediate phenotype and verify our findings in other cohorts.
Limitations
The present study has multiple limitations. First NHANES was designed originally as a cross-sectional survey. The linkage with NDI permits follow-up for outcome as ascertained by a separate instrument. Thus NHANES does not include other outcomes of interest that have been associated with P wave indices, such as stroke and AF.
It is also conceivable that individuals with a history of undiagnosed, paroxysmal AF participated in the ECG component of the exam. Such subjects would likely be older, would have increased mortality risks, and would be expected to have longer P wave durations than those without AF, thereby exaggerating our results. Second, by design, NHANES III quantified a limited number of P wave indices; a more complete assessment of P wave indices (including P wave dispersion, area, and terminal force) would provide greater insight into these variables' utility in conveying adverse risk. Third, despite the representative design of NHANES III, the study has only four racial categories. Further population-based study of P waves in ethnic minorities (such as Asians, for example) are necessary to extend and qualify these results. Next, NHANES III limited ECGs only to adults ≥40 years old who participated in the examination component of the survey. Because home-bound individuals would not have been eligible for ECGs, there may have been selection for healthier subjects. We additionally excluded subjects with incomplete covariates and illegible P waves, also introducing bias. Fifth, follow-up of the cohort was limited to a median of only 8.6 years; further longitudinal analysis would be helpful to validate the results presented here. Also NHANES III did not include cardiac echocardiography, precluding us from establishing the association between ECG and physiologic measurements. Finally, there may be residual confounding due to undiagnosed cardiovascular disease in a middle-aged cohort with a high prevalence of hypertension (50.6%).
Conclusion
We determined that P wave duration conveyed greater mortality hazard than the PR interval. This finding is highly generalizable given the design of the NHANES survey and establishes the prognostic significance of prolonged P wave duration. P wave duration likely reflects subclinical disease and merits further examination to elucidate its association with other adverse outcomes.
Supplementary Material
Acknowledgments
This research was funded by American Heart Association Award 09FTF2190028 and by grants from the National Institutes of Health (RC1HL101056; HL092577).
Abbreviations
- AF
atrial fibrillation
- BMI
body mass index
- CI
confidence interval
- ECG
electrocardiogram
- HR
hazard ratio
- NCHS
National Center for Health Statistics
- NHANES III
National Health and Nutrition Examination Survey
Footnotes
Appendix: Supplementary data: Supplementary data associated with this article can be found, in the online version, at doi:10.1016/j.hrthm.2010.09.020.
References
- 1.Nattel S, Burstein B, Dobrev D. Atrial remodeling and atrial fibrillation: mechanisms and implications. Circ Arrhythm Electrophysiol. 2008;1:62–73. doi: 10.1161/CIRCEP.107.754564. [DOI] [PubMed] [Google Scholar]
- 2.Magnani JW, Williamson MA, Ellinor PT, Monahan KM, Benjamin EJ. P wave indices: current status and future directions in epidemiology, clinical, and research applications. Circ Arrhythm Electrophysiol. 2009;2:72–79. doi: 10.1161/CIRCEP.108.806828. [DOI] [PMC free article] [PubMed] [Google Scholar]
- 3.Soliman EZ, Prineas RJ, Case LD, Zhang ZM, Goff DC., Jr Ethnic distribution of ECG predictors of atrial fibrillation and its impact on understanding the ethnic distribution of ischemic stroke in the Atherosclerosis Risk in Communities (ARIC) study. Stroke. 2009;40:1204–1211. doi: 10.1161/STROKEAHA.108.534735. [DOI] [PMC free article] [PubMed] [Google Scholar]
- 4.Cheng S, Keyes MJ, Larson MG, et al. Long-term outcomes in individuals with prolonged PR interval or first-degree atrioventricular block. JAMA. 2009;301:2571–2577. doi: 10.1001/jama.2009.888. [DOI] [PMC free article] [PubMed] [Google Scholar]
- 5.Kistler PM, Sanders P, Fynn SP, et al. Electrophysiologic and electroanatomic changes in the human atrium associated with age. J Am Coll Cardiol. 2004;44:109–116. doi: 10.1016/j.jacc.2004.03.044. [DOI] [PubMed] [Google Scholar]
- 6.Sanders P, Morton JB, Davidson NC, et al. Electrical remodeling of the atria in congestive heart failure: electrophysiological and electroanatomic mapping in humans. Circulation. 2003;108:1461–1468. doi: 10.1161/01.CIR.0000090688.49283.67. [DOI] [PubMed] [Google Scholar]
- 7.Rautaharju PM, MacInnis PJ, Warren JW, Wolf HK, Rykers PM, Calhoun HP. Methodology of ECG interpretation in the Dalhousie program; NOVACODE ECG classification procedures for clinical trials and population health surveys. Methods Inf Med. 1990;29:362–374. [PubMed] [Google Scholar]
- 8.Frohlich ED. Recommendations for blood pressure determination by sphygmo-manometry. Ann Intern Med. 1988;109:612. doi: 10.7326/0003-4819-109-8-612. [DOI] [PubMed] [Google Scholar]
- 9.Chobanian AV, Bakris GL, Black HR, et al. Seventh report of the Joint National Committee on Prevention, Detection, Evaluation, and Treatment of High Blood Pressure. Hypertension. 2003;42:1206–1252. doi: 10.1161/01.HYP.0000107251.49515.c2. [DOI] [PubMed] [Google Scholar]
- 10.Laboratory Procedures Used for the Third National Health and Nutrition Examination Survey (NHANES III), 1998–1994. http://www.cdc.gov/nchs/data/nhanes/nhanes3/cdrom/nchs/manuals/labman.pdf.
- 11.Diagnosis and classification of diabetes mellitus. Diabetes Care. 2010;33(Suppl 1):S62–S69. doi: 10.2337/dc10-S062. [DOI] [PMC free article] [PubMed] [Google Scholar]
- 12.Sierra-Johnson J, Romero-Corral A, Lopez-Jimenez F, et al. Relation of increased leptin concentrations to history of myocardial infarction and stroke in the United States population. Am J Cardiol. 2007;100:234–239. doi: 10.1016/j.amjcard.2007.02.088. [DOI] [PMC free article] [PubMed] [Google Scholar]
- 13.Ninomiya JK, L'Italien G, Criqui MH, Whyte JL, Gamst A, Chen RS. Association of the metabolic syndrome with history of myocardial infarction and stroke in the Third National Health and Nutrition Examination Survey. Circulation. 2004;109:42–46. doi: 10.1161/01.CIR.0000108926.04022.0C. [DOI] [PubMed] [Google Scholar]
- 14.NHANES III Linked Mortality Public-use File
- 15.Comparative analysis of the NHANES III public-use and restricted-use linked mortality files
- 16.National Center for Health Statistics, Centers for Disease Control and Prevention . Third National Health and Nutrition Examination Survey (NHANES III) Linked Mortality File Underlying and Multiple Cause of Death Codes. [Google Scholar]
- 17.Lauer MS, Blackstone EH, Young JB, Topol EJ. Cause of death in clinical research: time for a reassessment? J Am Coll Cardiol. 1999;34:618–620. doi: 10.1016/s0735-1097(99)00250-8. [DOI] [PubMed] [Google Scholar]
- 18.Lin D, Wei L, Ying Z. Checking the Cox model with cumulative sums of Martingale-based residuals. Biometrika. 1993;80:557–572. [Google Scholar]
- 19.Analytic and Reporting Guidelines: The Third National Health and Nutrition Examination Survey, NHANES III (1988–1994) National Center for Health Statistics; [Google Scholar]
- 20.Chirinos JA, Franklin SS, Townsend RR, Raij L. Body mass index and hypertension hemodynamic subtypes in the adult US population. Arch Intern Med. 2009;169:580–586. doi: 10.1001/archinternmed.2008.611. [DOI] [PubMed] [Google Scholar]
- 21.Center for Disease Control and Prevention. National Vital Statistics System. [Google Scholar]
- 22.Babaev AA, Vloka ME, Sadurski R, Steinberg JS. Influence of age on atrial activation as measured by the P wave signal-averaged electrocardiogram. Am J Cardiol. 2000;86:692–695. A9. doi: 10.1016/s0002-9149(00)01056-0. [DOI] [PubMed] [Google Scholar]
- 23.Havmoller R, Carlson J, Holmqvist F, et al. Age-related changes in P wave morphology in healthy subjects. BMC Cardiovasc Disord. 2007;7:22. doi: 10.1186/1471-2261-7-22. [DOI] [PMC free article] [PubMed] [Google Scholar]
- 24.Michelucci A, Padeletti L, Chelucci A, et al. Influence of age, lead axis, frequency of arrhythmic episodes, and atrial dimensions on P wave triggered SAECG in patients with lone paroxysmal atrial fibrillation. Pacing Clin Electrophysiol. 1996;19:758–767. doi: 10.1111/j.1540-8159.1996.tb03357.x. [DOI] [PubMed] [Google Scholar]
- 25.Mason JW, Ramseth DJ, Chanter DO, Moon TE, Goodman DB, Mendzelevski B. Electrocardiographic reference ranges derived from 79,743 ambulatory subjects. J Electrocardiol. 2007;40:228–234. doi: 10.1016/j.jelectrocard.2006.09.003. [DOI] [PubMed] [Google Scholar]
- 26.Vasan RS, Sullivan LM, Wilson PW, et al. Relative importance of borderline and elevated levels of coronary heart disease risk factors. Ann Intern Med. 2005;142:393–402. doi: 10.7326/0003-4819-142-6-200503150-00005. [DOI] [PubMed] [Google Scholar]
- 27.Ishida K, Hayashi H, Miyamoto A, et al. P wave and the development of atrial fibrillation. Heart Rhythm. 2010;7:289–294. doi: 10.1016/j.hrthm.2009.11.012. [DOI] [PubMed] [Google Scholar]
- 28.Gunduz H, Binak E, Arinc H, et al. The relationship between P wave dispersion and diastolic dysfunction. Tex Heart Inst J. 2005;32:163–167. [PMC free article] [PubMed] [Google Scholar]
- 29.Dagli N, Karaca I, Yavuzkir M, Balin M, Arslan N. Are maximum P wave duration and P wave dispersion a marker of target organ damage in the hypertensive population. Clin Res Cardiol. 2007 doi: 10.1007/s00392-007-0587-8. [DOI] [PubMed] [Google Scholar]
- 30.Kosar F, Aksoy Y, Ari F, Keskin L, Sahin I. P wave duration and dispersion in obese subjects. Ann Noninvasive Electrocardiol. 2008;13:3–7. doi: 10.1111/j.1542-474X.2007.00194.x. [DOI] [PMC free article] [PubMed] [Google Scholar]
- 31.Russo V, Ammendola E, De CI, Docimo L, Santangelo L, Calabro R. Severe obesity and P wave dispersion: the effect of surgically induced weight loss. Obes Surg. 2008;18:90–96. doi: 10.1007/s11695-007-9340-7. [DOI] [PubMed] [Google Scholar]
- 32.Seyfeli E, Duru M, Kuvandik G, Kaya H, Yalcin F. Effect of obesity on P wave dispersion and QT dispersion in women. Int J Obes (Lond) 2006;30:957–961. doi: 10.1038/sj.ijo.0803233. [DOI] [PubMed] [Google Scholar]
- 33.Yazici M, Ozdemir K, Altunkeser BB, et al. The effect of diabetes mellitus on the P wave dispersion. Circ J. 2007;71:880–883. doi: 10.1253/circj.71.880. [DOI] [PubMed] [Google Scholar]
- 34.Anderson EJ, Kypson AP, Rodriguez E, Anderson CA, Lehr EJ, Neufer PD. Substrate-specific derangements in mitochondrial metabolism and redox balance in the atrium of the type 2 diabetic human heart. J Am Coll Cardiol. 2009;54:1891–1898. doi: 10.1016/j.jacc.2009.07.031. [DOI] [PMC free article] [PubMed] [Google Scholar]
- 35.Sanders P, Morton JB, Kistler PM, et al. Electrophysiological and electroanatomic characterization of the atria in sinus node disease: evidence of diffuse atrial remodeling. Circulation. 2004;109:1514–1522. doi: 10.1161/01.CIR.0000121734.47409.AA. [DOI] [PubMed] [Google Scholar]
- 36.Wang TJ, Larson MG, Levy D, et al. Temporal relations of atrial fibrillation and congestive heart failure and their joint influence on mortality: the Framingham Heart Study. Circulation. 2003;107:2920–2925. doi: 10.1161/01.CIR.0000072767.89944.6E. [DOI] [PubMed] [Google Scholar]
- 37.Wang TJ, Massaro JM, Levy D, et al. A risk score for predicting stroke or death in individuals with new-onset atrial fibrillation in the community: the Framingham Heart Study. JAMA. 2003;290:1049–1056. doi: 10.1001/jama.290.8.1049. [DOI] [PubMed] [Google Scholar]
- 38.Desai AD, Yaw TS, Yamazaki T, Kaykha A, Chun S, Froelicher VF. Prognostic significance of quantitative QRS duration. Am J Med. 2006;119:600–606. doi: 10.1016/j.amjmed.2005.08.028. [DOI] [PubMed] [Google Scholar]
- 39.Sauer AJ, Moss AJ, McNitt S, et al. Long QT syndrome in adults. J Am Coll Cardiol. 2007;49:329–337. doi: 10.1016/j.jacc.2006.08.057. [DOI] [PubMed] [Google Scholar]
- 40.Jons C, Moss AJ, Goldenberg I, et al. Risk of fatal arrhythmic events in long QT syndrome patients after syncope. J Am Coll Cardiol. 2010;55:783–788. doi: 10.1016/j.jacc.2009.11.042. [DOI] [PubMed] [Google Scholar]
Associated Data
This section collects any data citations, data availability statements, or supplementary materials included in this article.