

Abstract
Chromosomal abnormalities that give rise to elevated expression levels of the ETS genes ETV1, ETV4, ETV5, or ERG are prevalent in prostate cancer, but the function of these transcription factors in carcinogenesis is not clear. Previous work in cell lines implicates ERG, ETV1, and ETV5 as regulators of invasive growth but not transformation. Here, we show that the PC3 prostate cancer cell line provides a model system to study the overexpression of ETV4. Migration assays, anchorage-independent growth assays, and microarray analysis indicate that high ETV4 expression contributes to both transformation and cellular motility in PC3 cells. ETV4 directly bound the 5′ and 3′ MYC enhancers and modulated expression of both MYC and other cell proliferation genes, demonstrating a potential role in cell growth control. Despite this novel role for ETV4 in anchorage-independent growth, ETV4 overexpression in normal prostate-derived RWPE-1 cells showed effects similar to ETV1 overexpression: increased cellular motility and an upregulation of genes encoding extracellular proteins as well as ones important for development, inflammation, and wound healing. Because ETV1 and ETV4 have similar roles when introduced to the same cellular background, we suggest that the requirement of high ETV4 expression for maintenance of the anchorage-independent growth in PC3 cells is due to a specific characteristic of this cell line rather than a function of ETV4 that is distinct from the other oncogenic ETS genes. Thus, the function of ETS genes in prostate cancer may differ based on other genetic alterations in a tumor.
Keywords: ETS, prostate cancer, transformation, PC3, ETV4
Introduction
The most prevalent chromosomal rearrangement in solid tumors is the TMPRSS2-ERG fusion found in approximately half of prostate cancers.1,2 This rearrangement results in prostate-specific and androgen-induced expression of either full-length or truncated versions of ERG. ERG is an ETS transcription factor with adult expression normally confined to endothelial cells.3,4 Similar chromosomal abnormalities that result in aberrant expression of the ETS genes ETV1 (ER81), ETV4 (PEA3, E1AF), and ETV5 (ERM) occur in prostate cancer but are usually mutually exclusive with TMPRSS2-ERG.2,5-7 Thus, it has been proposed that these 4 ETS proteins have overlapping or redundant functions that promote prostate carcinogenesis.8,9 However, the oncogenic mechanism of these ETS proteins is still unclear.
The ETS family transcription factors, including the 28 human paralogs, all have a conserved ETS DNA binding domain.10,11 This results in similar DNA sequence recognition throughout the family and the potential for overlapping transcriptional targets.12 Phylogenetic analysis of the family reveals subfamilies that exhibit sequence conservation beyond the DNA binding domain. One example is the PEA3 subfamily, which includes 3 of the 4 ETS genes that are found in prostate cancer rearrangements: ETV1, ETV4, and ETV5. ERG, however, is in a distinct subfamily that maintains little conservation with PEA3 factors outside of the DNA binding domain. It is not currently known whether ETV1, ETV4, ETV5, and ERG indeed have the same role in carcinogenesis.
A careful comparison of the function of individual ETS family members in cell line models can address questions of redundant and specific carcinogenic roles. Previous studies indicate that the exogenous expression of ERG, ETV1, and ETV5 in cell lines derived from normal prostate increases growth in invasion assays but does not promote transformation in anchorage-independent growth assays.6,13,14 Similarly, reduction of ERG or ETV1 expression in V-CAP or LN-CAP prostate cancer lines, respectively, decreases invasion but does not alter anchorage-independent growth.13-15 Together, these studies suggest that expression of ERG or ETV1 is sufficient to activate an invasive growth program, but neither is essential for the maintenance of transformation. However, the heterogeneity of prostate cancer cells precludes the extension of these results to all cases of ETS overexpression. For example, cancer-derived cell lines overexpressing ETV4 and ETV5 have not been tested for ETS roles in transformation.
We have previously shown that the prostate cancer cell line, PC3, expresses high levels of ETV4.4 Here, we show that this high expression level is necessary for robust anchorage-independent growth of this cell line. Furthermore, knockdown of ETV4 resulted in a decrease in the expression of genes involved in cellular proliferation and the cell cycle. This provides the first evidence that overexpression of 1 of the 4 oncogenic ETS transcription factors is important for the transformation program of a prostate cancer line. However, the overexpression of ETV4 in normal prostate-derived RWPE-1 cells resulted in upregulation of a set of genes more closely related to those controlled by ETV1 in RWPE-1 cells than those regulated by ETV4 in PC3 cells. Thus, the role of ETV4 in PC3 cell anchorage-independent growth suggests a role for cell line background rather than a function of ETV4 distinct from other ETS factors associated with prostate cancer. These findings demonstrate that the genetic background of a cancer cell can influence the role of an overexpressed ETS gene.
Results
PC3 cells express high levels of ETV4
Chromosomal rearrangements in prostate cancers rarely result in overexpression of more than one of the ETS genes: ETV1, ETV4, ETV5, or ERG.7 This exclusive pattern of expression should also occur in cell lines used as models of ETS overexpression in prostate cancer. To test if commonly used prostate cell lines overexpress single ETS transcription factors, quantitative RT-PCR was used to measure mRNA levels of ETV1, ETV4, ETV5, and ERG (Fig. 1A). Normal prostate tissue and normal prostate-derived RWPE-1 cells were tested as controls. The prostate cancer cell lines tested were the following: LN-CAP cells, which have a chromosomal rearrangement resulting in ETV1 overexpression13; PC3 cells, which we have previously shown to express ETV4 at a level 100 times that of normal prostate4; and DU-145 cells, which are not known to overexpress an ETS gene. As expected, normal prostate tissue expressed very low levels of each ETS gene. RWPE-1 cells expressed moderately elevated levels of ETV4. DU-145 cells showed elevated levels of both ETV4 and ETV5. However, in absolute terms, the level of ETV1 and ETV4, in LN-CAP and PC3 cells, respectively, clearly predominated compared to other ETS genes in all samples. Protein immunoblots confirmed that ETV4 protein levels correlate with the difference in mRNA level between PC3 and LN-CAP cells (Fig. 1B). Thus, based on the expression of these 4 ETS genes, PC3 and LN-CAP cells represent appropriate cell line models for ETV4 and ETV1 overexpression in prostate cancer.
Figure 1.
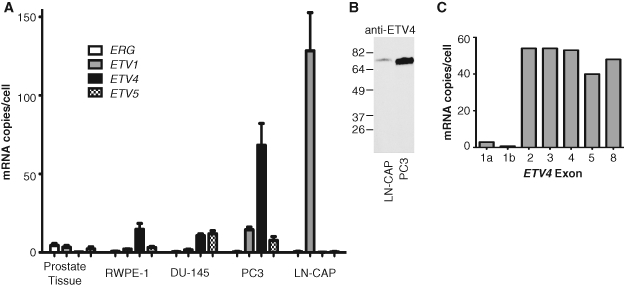
ETV4 is a uniquely overexpressed ETS gene in the PC3 cell line. (A) The expression levels of the 4 ETS genes involved in chromosomal rearrangements in prostate cancers were measured by quantitative RT-PCR with gene-specific primers. The mRNA copy number per cell was estimated as mRNA molecules per 2 × 10⁶ 18S rRNA molecules in the same sample, as previously reported.4 Bars represent the mean and standard error of 3 independent replicates. (B) An immunoblot with anti-ETV4 antibody. Equivalent amounts of whole cell extracts of indicated cell lines were electrophoresed by SDS-PAGE. Molecular mass (kDa) markers are indicated. (C) PC3 cell expression levels of the indicated exons of ETV4 were measured as in A except only a single replicate was performed.
The most common chromosomal rearrangements in prostate cancer samples involve the fusion of the promoter region and 5′ exon(s) of a gene normally expressed in prostate with all, or a portion of, the coding region of an ETS gene.9 To identify any chromosomal rearrangement that occurs within the ETV4 gene in PC3 cells, levels of ETV4 exons were measured by quantitative RT-PCR (Fig. 1C). Two alternative copies of exon 1 result in distinct ETV4 mRNAs that encode the same protein via a start codon in exon 2. In PC3 cells, expression levels of exons 2, 3, 4, 5, and 8 were similar, but both alternative copies of exon 1 were found at much lower levels. This result could indicate the presence of a gene fusion with a break point between exons 1 and 2. However, RNA ligase-mediated rapid amplification of cDNA ends (RLM-RACE) indicated that the most common ETV4 mRNA in PC3 cells began near the 5′ end of exon 2 (Suppl. Fig. S1A). Furthermore, fluorescence in situ hybridization (FISH) analysis of chromosome 17 did not indicate any chromosomal rearrangement consistent with a fusion gene involving ETV4 (Suppl. Fig. S1B). Therefore, we conclude that an alternate mechanism, such as internal initiation, results in overexpression of an ETV4 mRNA species that begins with exon 2.
A role for ETV4 overexpression in PC3 cell anchorage-independent growth
Previous reports of ETV1 in LN-CAP cells and ERG in V-CAP cells showed a role in cellular invasion but no essential role in anchorage-independent growth.13,14 To test the role of ETV4 in PC3 cells, small hairpin RNAs (shRNAs) targeting ETV4 were expressed by a retroviral vector system. Independent shRNAs targeting 2 distinct regions of the ETV4 gene decreased ETV4 mRNA and protein levels; however, a control shRNA targeting luciferase had no effect (Fig. 2A and 2B). Knockdown of ETV4 did not alter the rate of growth of PC3 cells on a solid surface (Fig. 2C). ETV4 knockdown caused a decrease in cellular migration (Fig. 2D), consistent with the invasive growth-promoting characteristics of ETV1 and ERG in other cancer lines. Strikingly, shRNA depletion of ETV4 also significantly decreased colony formation in an anchorage-independent growth assay (Fig. 2E and 2F). This suggests that, unlike ETV1 or ERG in other cell lines, ETV4 expression is essential for the transformation status of PC3 cells.
Figure 2.
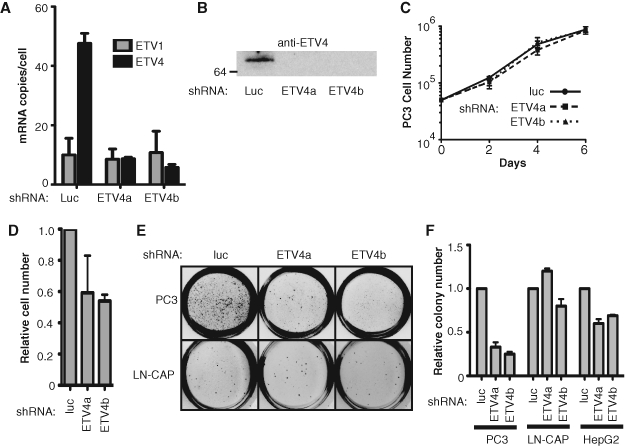
ETV4 is required for both anchorage-independent growth and cell migration properties of PC3 cells. (A) The levels of ETV1 and ETV4 mRNA in PC3 cells expressing shRNAs targeting either luciferase (luc) as a control or each of 2 distinct regions of ETV4 (ETV4a or ETV4b) were measured as in Figure 1A. (B) Anti-ETV4 immunoblot of extracts from PC3 cells expressing the indicated shRNA as in Figure 1B. (C) The growth rate of PC3 cells expressing the indicated shRNA was measured by plotting cell number counted versus time. (D) PC3 cells expressing the indicated shRNA were cultured in a Boyden Chamber with 8-µm pores in media lacking serum and allowed to migrate to 10% serum growth media for 24 hours. Cells that migrated out of the chamber were stained and counted. Migrating cell number is shown relative to the first lane (control) and is the mean and standard error of 2 biological replicates, each consisting of the mean of 2 technical replicates. (E) Either PC3 or LN-CAP cells expressing the indicated shRNA were plated in soft agar and allowed to grow for 4 weeks. Images are from a representative experiment. (F) Soft agar colonies formed by either PC3, LN-CAP, or HepG2 cells expressing the indicated shRNA were counted by colony-counting software (BioRad) at equivalent thresholds, and the number of colonies was plotted relative to the number of colonies expressing the control luciferase shRNA. Bar graph reports the mean and standard error of 3 (PC3) or 2 (LN-CAP, HepG2) independent biological replicates. Significance by t test are P < 0.0001 (PC3), P = 1 (LN-CAP), and P = 0.0003 (HepG2).
A control coexpression of an ETV4 targeting shRNA, with an ETV4 expression construct resistant to the shRNA, failed to rescue the loss of anchorage-independent growth. However, we have concerns that this ETV4 construct resulted in dramatically higher ETV4 expression than present normally in PC3 cells. Indeed, in this experiment, there was a decrease in PC3 cell growth rate both on a solid surface and in an anchorage-independent setting (data not shown). As an alternative control, we repeated the knockdown experiment in additional cell lines. ETV4 targeting shRNAs were introduced into LN-CAP prostate cancer cells, which exhibit anchorage-independent growth in the absence of overexpressed ETV4. Neither ETV4 shRNA significantly decreased LN-CAP growth in soft agar (Fig. 2E and 2F). We know of no other prostate cancer cell line that uniquely overexpresses ETV4. However, the liver cancer cell line HepG2 expresses ETV4 at very high levels.4 Knockdown of ETV4 in this cell line resulted in a modest but reproducible decrease in soft agar growth (Fig. 2F). Thus, high ETV4 expression levels are necessary for robust anchorage-independent growth in multiple cancer-derived cell lines.
Distinct roles of ETS family members in cancer-derived cell lines could result from differences between ETS genes or differences in the cellular background. To distinguish between these possibilities, ETV4 was overexpressed by a retroviral method in RWPE-1 cells, which are derived from normal prostate epithelia (Fig. 3A). RWPE-1 cells expressing ETV4 showed no increase in anchorage-independent growth (Fig. 3B) but a robust increase in cellular migration (Fig. 3C). Thus, in this cell line, the role of ETV4 is consistent with previous reports that investigated ETV1 and ERG13,14 in prostate cell lines.
Figure 3.

ETV4 expression increases migration but not anchorage-independent growth of RWPE-1 cells. (A) Expression of ETV4 in RWPE-1 cells. Extracts from RWPE-1 cells transduced with retroviruses containing either an empty construct (–) or a 3x FLAG-ETV4 expression construct (+) were analyzed as in Figure 1B, except with an anti-FLAG antibody. (B) RWPE-1 cells transduced with the indicated retrovirus were subjected to soft agar assays as in Figure 2F. Bars represent the mean and standard error of 4 independent replicates. (C) RWPE-1 cells transduced with the indicated retrovirus were used in a migration assay as in Figure 2D, except RWPE-1 growth supplements replaced serum and 3 biological replicates are reported.
ETV4 maintains a cellular proliferation gene expression program in PC3 cells
To identify ETV4 target genes that might regulate the anchorage-independent growth observed in PC3 cells, the gene expression profiles of cells with an ETV4 knockdown were measured by microarray analysis (Suppl. Table S1). Two independent shRNAs targeting ETV4 resulted in a similar gene expression profile (Fig. 4A). Ontology analysis determined functional classes of genes that had consistent 2-fold or greater increase or decrease in both ETV4 knockdowns compared to the control shRNA (Table 1). No functional classes were enriched for upregulated genes. However, the downregulated genes, which are potential targets of ETV4 activation function, were highly enriched for cell cycle or cell growth functions. This gene expression profile contrasts with a previous analysis of ETV1 in LN-CAP cells, which identifies target genes involved in cellular migration and invasion but not cell cycle or proliferation.13 Thus, both anchorage-independent growth assays and microarray profiling indicate that ETV4 contributes to a unique transformation-associated characteristic of PC3 prostate cancer cells.
Figure 4.

Manipulation of ETV1 and ETV4 levels results in similar gene expression changes. (A) Two independent shRNAs targeting ETV4 result in similar gene expression profiles. Microarray analysis provides log10-transformed ratios of the level of each gene (dot) in a cell line expressing ETV4a shRNA versus luciferase shRNA (x-axis) or ETV4b shRNA versus luciferase shRNA (y-axis). Each ratio is the mean of 2 independent biological replicates. (B) Comparison of genes upregulated by overexpression (vertical arrow ↑) of ETV1 and ETV4 in RWPE-1 cells or downregulated by knockdown (vertical arrow ↓) of ETV4 in PC3 cells. Genes with at least a 2-fold decrease in both shRNA knockdown experiments in PC3 cells are compared to genes with a mean 2-fold increase when either ETV4 (mean of 3 independent experiments) or ETV113 is expressed in RWPE-1 cells.
Table 1.
Overrepresented Categories of Genes that Change Expression upon ETV4 shRNA Treatment of PC3 Cells
| Category | Functional Classa | P Valueb |
|---|---|---|
| Down (210 genes)c | DNA metabolic process | 9.9 × 10⁻⁷ |
| DNA replication | 3.9 × 10⁻⁶ | |
| Oxidoreductase activity acting on CH or CH2 groups | 3.0 × 10⁻⁵ | |
| Cell cycle phase | 3.3 × 10⁻⁵ | |
| Cell cycle process | 3.7 × 10⁻⁵ | |
| Cell cycle | 4.2 × 10⁻⁵ | |
| Deoxyribonucleotide biosynthetic process | 5.2 × 10⁻⁵ | |
| DNA-dependent DNA replication | 7.5 × 10⁻⁵ | |
| Replication fork | 9.2 × 10⁻⁵ | |
| Cell proliferation | 9.8 × 10⁻⁵ | |
| Mitotic cell cycle | 1.0 × 10⁻⁴ | |
| DNA replication initiation | 1.0 × 10⁻⁴ | |
| Up (274 genes)d | None | ≤1.0 × 10⁻⁴ |
Functional classes are shown in the order returned by GoMiner with no editing.
P value for each functional class from GoMiner.
Genes with a mean decrease of 2-fold or greater in both independent shRNA knockdowns of ETV4.
Genes with a mean increase of 2-fold or greater in both independent shRNA knockdowns of ETV4.
Like ETV1,13 ETV5,6 and ERG,14 ETV4 expression was not sufficient to induce anchorage-independent growth in RWPE-1 cells (Fig. 3B). To test if ETV4 regulation of gene expression is cell type dependent, genes upregulated upon ETV4 overexpression in RWPE-1 cells were identified by microarray (Suppl. Table S1). There was a small but significant overlap (8% overlap; P < 0.0001, χ2 = 20) between the set of ETV4 upregulated genes in RWPE-1 cells and genes that decreased upon ETV4 knockdown in PC3 cells (Fig. 4B). However, these 2 gene lists contained no similar enriched functional classes (cf. Table 1 and Table 2) indicating differing functions of ETV4 in these cell lines. In contrast, there was a much larger overlap (17% overlap; P < 0.0001, χ2 = 203) between genes upregulated by ETV1 and ETV4 overexpression in RWPE-1 cells (Fig. 4B). Furthermore, the overrepresented classes of genes upregulated by ETV1 and ETV4 in RWPE-1 cells were similar and indicated increased expression of extracellular proteins and genes involved in processes such as inflammation, wound response, and organismal development (Table 2). These expression data indicate that ETV1 and ETV4 have overlapping function, but functional characteristics can differ between cell lines.
Table 2.
Categories of Genes Upregulated by ETV1 or ETV4 in RWPE-1 Cells
| Category | Functional Classa | P Valuea |
|---|---|---|
| Genes up with ETV1b | Extracellular region part | 4.3 × 10⁻⁹ |
| Extracellular space | 1.2 × 10⁻⁸ | |
| Extracellular region | 5.7 × 10⁻⁸ | |
| Multicellular organismal process | 2.9 × 10⁻⁶ | |
| Cytoplasm organization and biogenesis | 1.9 × 10⁻⁵ | |
| Cell fraction | 2.0 × 10⁻⁵ | |
| Developmental process | 2.0 × 10⁻⁵ | |
| Multicellular organismal development | 2.3 × 10⁻⁵ | |
| System development | 2.5 × 10⁻⁵ | |
| Cell activation | 4.2 × 10⁻⁵ | |
| Anatomical structure development | 4.3 × 10⁻⁵ | |
| Receptor binding | 8.9 × 10⁻⁵ | |
| Hormone metabolic process | 1.2 × 10⁻⁴ | |
| Organ development | 1.4 × 10⁻⁴ | |
| Leukocyte activation | 1.4 × 10⁻⁴ | |
| Wound healing | 1.4 × 10⁻⁴ | |
| Response to extracellular stimulus | 1.7 × 10⁻⁴ | |
| Response to wounding | 3.5 × 10⁻⁴ | |
| Cell adhesion | 3.5 × 10⁻⁴ | |
| Biological adhesion | 3.8 × 10⁻⁴ | |
| Genes up with ETV4c | Response to wounding | 4.7 × 10⁻⁸ |
| Extracellular region | 1.7 × 10⁻⁷ | |
| Response to biotic stimulus | 7.3 × 10⁻⁷ | |
| Receptor binding | 3.0 × 10⁻⁶ | |
| Response to external stimulus | 4.5 × 10⁻⁶ | |
| Cytokine activity | 5.5 × 10⁻⁶ | |
| Integrin binding | 2.1 × 10⁻⁵ | |
| Response to unfolded protein | 2.1 × 10⁻⁵ | |
| Response to protein stimulus | 3.5 × 10⁻⁵ | |
| Extracellular region part | 3.9 × 10⁻⁵ | |
| Inflammatory response | 4.3 × 10⁻⁵ | |
| Extracellular space | 9.8 × 10⁻⁵ | |
| Response to stress | 1.0 × 10⁻⁴ | |
| Regulation of vasoconstriction | 1.1 × 10⁻⁴ | |
| Response to molecule of bacterial origin | 1.5 × 10⁻⁴ | |
| Positive regulation of phosphorylation | 2.6 × 10⁻⁴ | |
| Cell-cell signaling | 2.7 × 10⁻⁴ | |
| Defense response | 3.1 × 10⁻⁴ | |
| Response to stimulus | 3.8 × 10⁻⁴ | |
| Positive regulation of multicellular organismal process | 3.9 × 10⁻⁴ |
Functional classes and P values are reported as in Table 1.
Genes with a mean increase of 2-fold or higher when ETV1 is expressed in RWPE-1 cells as reported by Tomlins et al.13
Genes with a mean increase of 2-fold or higher when ETV4 is expressed in RWPE-1 cells.
Cell proliferation genes are targets of ETV4 in PC3 cells
The cell cycle and cell proliferation genes affected by ETV4 knockdown in PC3 cells are either direct or indirect targets of ETV4. We confirmed that ETV4 knockdown decreased expression of 3 of these genes by quantitative RT-PCR (Fig. 5A). Coexpression of ETV4 by a retroviral method restored these expression levels to wild type or above, supporting the specificity of this approach. Intriguingly, MYC, a central regulator of cell proliferation, was one of the 185 genes whose expression decreased upon ETV4 knockdown in PC3 cells but was not increased upon ETV4 overexpression in RWPE-1 cells. Chromatin immunoprecipitation was used to test if MYC is a direct target of ETV4 in PC3 cells. Both the MYC 5′ and 3′ enhancers,16 but not a control region in the body of the MYC gene, were occupied by ETV4 in PC3 cells (Fig. 5B), suggesting that ETV4 directly regulates MYC expression in PC3 cells. In conclusion, ETV4 overexpression in PC3 cells upregulates cell cycle and cell proliferation genes, and in the case of MYC, this regulation appears to be direct. We conclude that ETV4 regulates a transcriptional program in PC3 cells that is essential for anchorage-independent growth, a characteristic of cell transformation.
Figure 5.

ETV4 regulation of cell cycle genes. (A) Levels of MYC, CHEK1, and MCM7 mRNA were measured by quantitative RT-PCR from RWPE-1 cells expressing the indicated retroviral constructs. mRNA levels are standardized between samples by an internal control (18S ribosomal RNA) and reported relative to the level in RWPE-1 cells expressing a control shRNA targeting luciferase (first lane each). A retroviral construct expressing the ETV4 open reading frame (without the 3′UTR) is present where indicated (+). The ETV4a shRNA targets the ETV4 3′UTR. Bars represent the mean and standard error of 3 (MYC) or 2 (CHEK1 and MCM7) independent replicates. Asterisks indicate significance (*P < 0.05; **P < 0.01) for effects on MYC and CHEK1, respectively. (B) Chromatin immunoprecipitation (ChIP) followed by Q-PCR assays detected ETV4 at MYC enhancers in PC3 cells. Primer sets that amplify the indicated regions (A, B, or C) in the vicinity of the MYC gene were used to test ChIP with ETV4 or ELK1 antibodies. ELK1 is an ETS gene not known to be affected by chromosome rearrangements in prostate cancer. Amplicons A and C are within the 5′ and 3′ MYC enhancer regions,16 respectively. Amplicon B is in a position distal to known regulatory elements and serves as a negative control. Fold enrichment is the ratio of the level of the indicated amplicon versus the mean level of 2 negative control genomic regions. Each bar represents the mean and standard error of 2 independent biological replicates.
Discussion
The frequency of chromosomal abnormalities that result in aberrant ERG, ETV1, ETV4, or ETV5 gene expression in prostate cancer indicates an oncogenic role for these genes. Our study provides both gene expression and phenotypic evidence that ETV4 has a role in the maintenance of transformation in prostate cells. Furthermore, this function varies between cell lines, indicating cell type–specific roles of ETS proteins.
The PC3 prostate cancer cell line expressed much higher levels of ETV4 than the other oncogenic ETS genes, a pattern consistent with other cancer-derived cell lines (Fig. 1A). Moderate (10-20 copies per cell) expression of the PEA3 subfamily members is observed in both PC3 (ETV1 and ETV5) and DU-145 (ETV4 and ETV5) prostate cancer cell lines and the normal prostate-derived RWPE-1 cell line (ETV4). This is consistent with our previous observation that this subfamily is consistently expressed at elevated levels in cell lines compared to adult tissues4 and may indicate a positive selection for expression in cell culture. However, high-level overexpression (>50 copies per cell) is limited to ETV1 in LN-CAP cells and ETV4 in PC3 cells. This high-level expression was significant because reduction of ETV4 to moderate (~10 copies per cell) levels by shRNA in PC3 cells (Fig. 2A) resulted in a reduction in anchorage-independent growth (Fig. 2E and 2F).
The loss of anchorage-independent growth of PC3 cells upon knockdown of ETV4 was not expected because this property is not observed after knockdown of ETV1 and ERG in other prostate cancer cell lines.13,14 A number of observations suggest that this result is specific to decreased ETV4 expression rather than an off-target effect. First, 2 independent shRNAs with no sequence similarity decreased ETV4 expression and anchorage-independent growth to a similar extent (Fig. 2A and 2F). Furthermore, introduction of either shRNA resulted in strikingly similar gene expression patterns (Fig. 4A). Second, the loss of anchorage-independent growth was observed specifically in 2 cell lines that overexpress ETV4 (Fig. 2F). Finally, the expression levels of ETV4 target genes were restored by the coexpression of a shRNA-resistant ETV4 construct with the ETV4 shRNA (Fig. 5A). Thus, we conclude that the ETV4 knockdown is responsible for the gene profiling and cell transformation characteristics reported here.
Overexpression of full-length ETV4 in PC3 cells is not due to a gross chromosomal aberration. Interestingly, the chromosomal rearrangements described thus far in prostate cancers result in versions of ETV4 that lack the N-terminal amino acids encoded by either exon 2 or exons 2 to 4.5,17,18 Our data suggest that alternative mechanisms by which prostate cancer cells alter full-length ETV4 expression may play an important role in cancers where no chromosomal abnormalities are present. There are many potential ways to overexpress an ETS gene. For example, mutation in the cis elements or trans factors that regulate transcription of ETS genes could be responsible for upregulation. Our exon mapping and RLM-RACE findings (Fig. 1C and Suppl. Fig. S1A) suggest that aberrant ETV4 regulation in PC3 cells could result in use of an alternative transcription start site in exon 2 with a potential to drive higher levels of mRNA synthesis.
Our analysis indicates that the function of ETV4 in anchorage-independent growth and regulation of a cellular proliferation gene expression program is linked to the genetic background of PC3 cells. A previous report found that a nonspecific inhibitor of ETS function and an antisense knockdown of ETS2 also decrease soft agar growth of PC3 cells.19 Thus, ETS proteins appear to play a critical, and possibly redundant, role in transformation in this particular cellular background. The context dependence of ETV4 function is consistent with the ability of overexpressed ERG to synergistically promote transformation in concert with other oncogenic mutations such as PTEN deletion and overexpression of androgen receptor (AR).20,21 Unique signaling characteristics resulting from the activating K-RAS mutation,22 the homozygous deletion of PTEN,23 which are known PC3 lesions, and/or additional abnormalities could contribute to the PC3 cell response to ETV4 depletion. One distinguishing feature is the androgen independence of PC3 cells,24 which is a contrast to the androgen responsiveness of RWPE-1 and LN-CAP cells.25,26 It has been reported recently that the enhancer regions accessible for AR binding differ between androgen-independent and -dependent cells.27 Interestingly, the types of genes associated with enhancers preferentially targeted in androgen-independent cells are similar to the genes downregulated by ETV4 knockdown in PC3 cells, specifically, genes involved in cell cycle and cell proliferation. Thus, the increased accessibility of regulatory regions near these genes upon transition to androgen independence may allow access to both AR and ETS transcription factors, such as ETV4.
We speculated that the enhancers of the MYC oncogene could represent this pathway. MYC encodes a transcription factor that activates cellular proliferation genes. We have shown that ETV4 targets MYC enhancers in PC3 cells and an ETV4 knockdown leads to downregulation of MYC expression (Fig. 5). Two recent studies have identified MYC as a target of ERG in prostate cells.20,28 This indicates a possible overlapping role of ETV4 and ERG in the regulation of cellular proliferation consistent with an overlapping function in prostate cancer.
This study identifies the PC3 cell line as a model for ETV4 overexpression in prostate cancer and for ETS overexpression in an androgen-independent background. Whereas ETV4 overexpression is less common in prostate cancer than ETV1 and ERG overexpression, high levels of ETV4 have been associated with aggressive tumors in a variety of other epithelial cancers.29-34 In fact, the necessity of ETV4 for both cellular migration and anchorage-independent growth in PC3 cells parallels findings in mouse mammary tumor cells.35 Thus, studies into the role of ETV4 in PC3 cells may shed light on widespread oncogenic mechanisms.
Materials and Methods
Constructs and retroviruses
The following oligonucleotides were annealed and cloned into Age1 and EcoR1 sites of pMKO.1puro36 to create shRNA expression constructs: luciferase: ccggcttacgctgagtacttcgattcaagagatcgaagtactcagcgtaagtttttttg and aattcaaaaaaacttacgctgagtacttcgatctcttgaatcgaagtactcagcgtaag; ETV4a: ccggggcgcttcccaacttcatattcaagagatatgaagttgggaagcgcctttttttg and aattcaaaaaaaggcgcttcccaacttcatatctcttgaatatgaagttgggaagcgcc; ETV4b: ccgggcagagctttaagcaagaattcaagagattcttgcttaaagctctgctgtttttg and aattcaaaaacagcagagctttaagcaagaatctcttgaattcttgcttaaagctctgc. A 3x FLAG-tagged ETV4 expression construct was created by reverse transcription PCR of RNA from PC3 cells using the following primers: 5′ agactaccggtatggactacaaggacgacgacgacaaggagcggaggatgaaagccgg, 3′ gtgacattaattaactagtaagagtagccacccttggg, followed by an additional PCR step using an alternative 5′ primer, tcagtaccggtatggactacaaagaccatgacggtgattataaagatcatgatatcgactacaaggacgacgacgacaag, followed by cloning into the Age1 and Pac1 sites of pQCXIH (Clontech, Mountain View, CA). Retroviral expression plasmids were cotransfected with vesicular stomatitus virus-G glycoprotein and gag/pol packaging plasmids into 293 EBNA cells to make retroviruses.
Cell culture
Cell lines were maintained using standard cell culture practices. Human PC3 cells (ATCC CRL-1435) were cultured in F-12K medium (Invitrogen, Carlsbad, CA) and 10% fetal bovine serum (FBS). LN-CAP cells (ATCC CRL-1740) were cultured in RPMI 1640 medium (Invitrogen) with 10% FBS. DU-145 (ATCC HTB-81) cells were cultured in Eagle’s minimum essential media with 10% FBS. RWPE-1 cells were grown in Keratinocyte SFM (Invitrogen). All media were supplemented with 100 U/mL penicillin and 100 U/mL streptomycin. After retroviral incubation with 8 mg/mL polybrene, transduced cells were selected with the appropriate antibiotic. Growth curves were obtained by counting cells at the indicated times after serially plating 5 × 10⁴ cells in 6-well dishes. Anchorage-independent growth assays were preformed as previously described.37 In brief, 5 × 10⁴ cells were seeded in 6-cm plates with 0.35% agar in Iscove’s media containing 20% FBS. Colonies were counted after 4 weeks using Quantity One software (Bio-Rad, Hercules, CA). Migration assays were preformed by plating 2.5 × 10⁴ cells into a Boyden Chamber with 8-µm pores (BD Biosciences, San Jose, CA) in media lacking serum (PC3) or the keratinocyte media supplements (RWPE-1). Chambers were placed in a well containing normal growth media. After 36 (PC3) or 60 (RWPE-1) hours, cells in the chamber were removed by swab, and cells that migrated to the outside of the chamber were stained by the Wright-Giemsa method. Stained cells were visualized by light microscopy for counting.
Quantitation of RNA levels
Methods and DNA oligonucleotides used for quantitative RT-PCR of ETS gene mRNAs were reported previously.4 Oligonucleotides for quantitative RT-PCR of cell cycle genes were the following: MYC, tgcagctgcttagacgctgg, cgaggtcatagttcctgttgg; CHEK1, tggtattggaataactcacaggg, ccgaaatactgttgccaagcc; MCM7, cgaagctctttgctgatgcc, ccgatgctcaatgtaaacgtcc. RNA for microarray analysis was isolated with an RNeasy kit (Qiagen, Valencia, CA) from 2 × 10⁶ cells. One microgram of total RNA from each sample was labeled and hybridized to Agilent Whole Human Genome microarrays using Agilent kits and protocols (Santa Clara, CA). Microarray analysis of ETV4 knockdown in PC3 cells used 2 biologically independent replicates each of RNA from cells expressing either ETV4a or ETV4b shRNA compared to cells expressing luciferase shRNA. Microarray analysis of ETV4 expression in RWPE-1 cells used 3 biologically independent replicates comparing cells transduced with a retroviral vector expressing 3x FLAG-ETV4 with cells transduced with an empty vector. Genes with mean expression changes of 2-fold or greater are listed in Supplementary Table S1.
Protein immunoblots and chromatin immunoprecipitation
Whole cell extracts were run on 10% SDS PAGE gels and blotted to nitrocellulose. Proteins were detected with anti-ETV4 (ARP32263, Aviva Systems Biology, San Diego, CA) or anti-FLAG M2 (Sigma Life Science, St. Louis, MO) antibodies. Chromatin immunoprecipitation was performed as described previously12 with anti-ETV4 and anti-ELK1 (sc-355, Santa Cruz Biotechnology, Santa Cruz, CA) antibodies. Enrichments are a ratio of the level of the target region in each sample over the mean of the level of 2 negative control genomic regions. Primers for the MYC gene are as follows: 5′ enhancer: ccatattctcccgtctagcacc, ccaggtttca gaagagacaaatcc; ORF: ggtcacacccttctcccttcg, ctggttcaccatgtctcctcc; 3′ enhancer: ctgttcaaaacacttaacccttcg, cttgagtct gtccattaggtcc.
Acknowledgments
The authors thank University of Utah colleagues Steven L. Lessnick for technical advice and protocols as well as Emily Aston and Arthur Brothman for assistance with FISH. All microarray datasets are available for download from NCBI’s Gene Expression Omnibus (GEO, http://www.ncbi.nlm.nih.gov/geo) (accession number GSE21209).
Footnotes
The author(s) declared no potential conflicts of interest with respect to the authorship and/or publication of this article.
The author(s) disclosed receipt of the following financial support for the research and/or authorship of this article: This work was supported by the National Institutes of Health [RGM0138663 to B.J.G.] and [P30CA42014 to the Huntsman Cancer Institute for support of core facilities]. B.J.G. acknowledges funding from the Huntsman Cancer Institute/Huntsman Cancer Foundation and the Prostate Cancer Foundation. P.C.H. acknowledges support from the Indiana University School of Medicine.
Supplementary material for this article is available on the Genes & Cancer website at http://ganc.sagepub.com/supplemental.
References
- 1. Mosquera JM, Mehra R, Regan MM, et al. Prevalence of TMPRSS2-ERG fusion prostate cancer among men undergoing prostate biopsy in the United States. Clin Cancer Res. 2009;15:4706-11 [DOI] [PMC free article] [PubMed] [Google Scholar]
- 2. Tomlins SA, Rhodes DR, Perner S, et al. Recurrent fusion of TMPRSS2 and ETS transcription factor genes in prostate cancer. Science. 2005;310:644-8 [DOI] [PubMed] [Google Scholar]
- 3. Hewett PW, Nishi K, Daft EL, Clifford Murray J. Selective expression of erg isoforms in human endothelial cells. Int J Biochem Cell Biol. 2001;33:347-55 [DOI] [PubMed] [Google Scholar]
- 4. Hollenhorst PC, Jones DA, Graves BJ. Expression profiles frame the promoter specificity dilemma of the ETS family of transcription factors. Nucleic Acids Res. 2004;32:5693-702 [DOI] [PMC free article] [PubMed] [Google Scholar]
- 5. Tomlins SA, Mehra R, Rhodes DR, et al. TMPRSS2:ETV4 gene fusions define a third molecular subtype of prostate cancer. Cancer Res. 2006;66:3396-400 [DOI] [PubMed] [Google Scholar]
- 6. Helgeson BE, Tomlins SA, Shah N, et al. Characterization of TMPRSS2:ETV5 and SLC45A3:ETV5 gene fusions in prostate cancer. Cancer Res. 2008;68:73-80 [DOI] [PubMed] [Google Scholar]
- 7. Svensson MA, Lafargue CJ, Macdonald TY, et al. Testing mutual exclusivity of ETS rearranged prostate cancer. Lab Invest. Epub 2010. October 25 [DOI] [PMC free article] [PubMed] [Google Scholar]
- 8. Turner DP, Watson DK. ETS transcription factors: oncogenes and tumor suppressor genes as therapeutic targets for prostate cancer. Expert Rev Anticancer Ther. 2008;8:33-42 [DOI] [PubMed] [Google Scholar]
- 9. Kumar-Sinha C, Tomlins SA, Chinnaiyan AM. Recurrent gene fusions in prostate cancer. Nat Rev Cancer. 2008;8:497-511 [DOI] [PMC free article] [PubMed] [Google Scholar]
- 10. Oikawa T, Yamada T. Molecular biology of the Ets family of transcription factors. Gene. 2003;303:11-34 [DOI] [PubMed] [Google Scholar]
- 11. Sharrocks AD. The ETS-domain transcription factor family. Nat Rev Mol Cell Biol. 2001;2:827-37 [DOI] [PubMed] [Google Scholar]
- 12. Hollenhorst PC, Shah AA, Hopkins C, Graves BJ. Genome-wide analyses reveal properties of redundant and specific promoter occupancy within the ETS gene family. Genes Dev. 2007;21:1882-94 [DOI] [PMC free article] [PubMed] [Google Scholar]
- 13. Tomlins SA, Laxman B, Dhanasekaran SM, et al. Distinct classes of chromosomal rearrangements create oncogenic ETS gene fusions in prostate cancer. Nature. 2007;448:595-9 [DOI] [PubMed] [Google Scholar]
- 14. Tomlins SA, Laxman B, Varambally S, et al. Role of the TMPRSS2-ERG gene fusion in prostate cancer. Neoplasia. 2008;10:177-88 [DOI] [PMC free article] [PubMed] [Google Scholar]
- 15. Cai C, Hsieh CL, Omwancha J, et al. ETV1 is a novel androgen receptor-regulated gene that mediates prostate cancer cell invasion. Mol Endocrinol. 2007;21:1835-46 [DOI] [PubMed] [Google Scholar]
- 16. Yochum GS, Cleland R, Goodman RH. A genome-wide screen for beta-catenin binding sites identifies a downstream enhancer element that controls c-Myc gene expression. Mol Cell Biol. 2008;28:7368-79 [DOI] [PMC free article] [PubMed] [Google Scholar]
- 17. Han B, Mehra R, Dhanasekaran SM, et al. A fluorescence in situ hybridization screen for E26 transformation-specific aberrations: identification of DDX5-ETV4 fusion protein in prostate cancer. Cancer Res. 2008;68:7629-37 [DOI] [PMC free article] [PubMed] [Google Scholar]
- 18. Hermans KG, Bressers AA, van der Korput HA, Dits NF, Jenster G, Trapman J. Two unique novel prostate-specific and androgen-regulated fusion partners of ETV4 in prostate cancer. Cancer Res. 2008;68:3094-8 [DOI] [PubMed] [Google Scholar]
- 19. Sementchenko VI, Schweinfest CW, Papas TS, Watson DK. ETS2 function is required to maintain the transformed state of human prostate cancer cells. Oncogene. 1998;17:2883-8 [DOI] [PubMed] [Google Scholar]
- 20. Zong Y, Xin L, Goldstein AS, Lawson DA, Teitell MA, Witte ON. ETS family transcription factors collaborate with alternative signaling pathways to induce carcinoma from adult murine prostate cells. Proc Natl Acad Sci U S A. 2009;106:12465-70 [DOI] [PMC free article] [PubMed] [Google Scholar]
- 21. Carver BS, Tran J, Gopalan A, et al. Aberrant ERG expression cooperates with loss of PTEN to promote cancer progression in the prostate. Nat Genet. 2009;41:619-24 [DOI] [PMC free article] [PubMed] [Google Scholar]
- 22. Pergolizzi RG, Kreis W, Rottach C, Susin M, Broome JD. Mutational status of codons 12 and 13 of the N- and K-ras genes in tissue and cell lines derived from primary and metastatic prostate carcinomas. Cancer Invest. 1993;11:25-32 [DOI] [PubMed] [Google Scholar]
- 23. Vlietstra RJ, van Alewijk DC, Hermans KG, van Steenbrugge GJ, Trapman J. Frequent inactivation of PTEN in prostate cancer cell lines and xenografts. Cancer Res. 1998;58:2720-3 [PubMed] [Google Scholar]
- 24. Kaighn ME, Narayan KS, Ohnuki Y, Lechner JF, Jones LW. Establishment and characterization of a human prostatic carcinoma cell line (PC-3). Invest Urol. 1979;17:16-23 [PubMed] [Google Scholar]
- 25. Horoszewicz JS, Leong SS, Kawinski E, et al. LNCaP model of human prostatic carcinoma. Cancer Res. 1983;43:1809-18 [PubMed] [Google Scholar]
- 26. Bello D, Webber MM, Kleinman HK, Wartinger DD, Rhim JS. Androgen responsive adult human prostatic epithelial cell lines immortalized by human papillomavirus 18. Carcinogenesis. 1997;18:1215-23 [DOI] [PubMed] [Google Scholar]
- 27. Wang Q, Li W, Zhang Y, et al. Androgen receptor regulates a distinct transcription program in androgen-independent prostate cancer. Cell. 2009;138:245-56 [DOI] [PMC free article] [PubMed] [Google Scholar]
- 28. Sun C, Dobi A, Mohamed A, et al. TMPRSS2-ERG fusion, a common genomic alteration in prostate cancer activates C-MYC and abrogates prostate epithelial differentiation. Oncogene. 2008;27:5348-53 [DOI] [PMC free article] [PubMed] [Google Scholar]
- 29. Liu HY, Zhou B, Wang L, et al. Association of E1AF mRNA expression with tumor progression and matrilysin in human rectal cancer. Oncology. 2007;73:384-8 [DOI] [PubMed] [Google Scholar]
- 30. Hata H, Kitamura T, Higashino F, et al. Expression of E1AF, an ets-oncogene transcription factor, highly correlates with malignant phenotype of malignant melanoma through up-regulation of the membrane-type-1 matrix metalloproteinase gene. Oncol Rep. 2008;19:1093-8 [PubMed] [Google Scholar]
- 31. Nosho K, Yamamoto H, Adachi Y, Endo T, Hinoda Y, Imai K. Gene expression profiling of colorectal adenomas and early invasive carcinomas by cDNA array analysis. Br J Cancer. 2005;92:1193-200 [DOI] [PMC free article] [PubMed] [Google Scholar]
- 32. Izumiyama Y, Ohiro Y, Higashino F, et al. E1AF expression is closely correlated with malignant phenotype of tongue squamous cell carcinoma through activation of MT1-MMP gene promoters. Oncol Rep. 2005;13:715-20 [PubMed] [Google Scholar]
- 33. Yamamoto H, Horiuchi S, Adachi Y, et al. Expression of ets-related transcriptional factor E1AF is associated with tumor progression and over-expression of matrilysin in human gastric cancer. Carcinogenesis. 2004;25:325-32 [DOI] [PubMed] [Google Scholar]
- 34. Hida K, Shindoh M, Yoshida K, et al. Expression of E1AF, an ets-family transcription factor, is correlated with the invasive phenotype of oral squamous cell carcinoma. Oral Oncol. 1997;33:426-30 [DOI] [PubMed] [Google Scholar]
- 35. Firlej V, Ladam F, Brysbaert G, et al. Reduced tumorigenesis in mouse mammary cancer cells following inhibition of Pea3- or Erm-dependent transcription. J Cell Sci. 2008;121:3393-402 [DOI] [PubMed] [Google Scholar]
- 36. Masutomi K, Yu EY, Khurts S, et al. Telomerase maintains telomere structure in normal human cells. Cell. 2003;114:241-53 [DOI] [PubMed] [Google Scholar]
- 37. Lessnick SL, Dacwag CS, Golub TR. The Ewing’s sarcoma oncoprotein EWS/FLI induces a p53-dependent growth arrest in primary human fibroblasts. Cancer Cell. 2002;1:393-401 [DOI] [PubMed] [Google Scholar]