

Abstract
Objective
To identify genetic variation influencing serum bilirubin levels in American Indians, we performed genome-wide screening and association analyses in the Strong Heart Family Study. Bilirubin is an endogenous antioxidant that has demonstrated an inverse relationship with cardiovascular disease. Genetic variation within the promoter region of uridine diphosphate glucuronosyltransferase (UGT1A1) on chromosome 2q has been associated with elevated serum bilirubin levels in European populations. However, no study has investigated the UGT1A1 promoter in American Indians.
Methods
Statistical analyses were carried out with 3,484 participants aged 14 to 93 years recruited from three geographic areas in the United States; Arizona, Oklahoma, and North and South Dakota.
Results
Variance components linkage analysis detected a quantitative trait locus (QTL) for bilirubin on chromosome 2q in the combined centers (LOD = 6.61, P = 4.24 × 10⁻⁶) and in Oklahoma (LOD = 5.65, P = 4.57 24 × 10−5). Genetic association of the UGT1A1 promoter polymorphism was significant for all geographic locations. After adjustment using conditional linkage for UGT1A1 promoter variance, the linkage signal dropped to 1.10 in the combined sample and to 3.32 (P = 0.02) in Oklahoma, indicating this polymorphism is not completely responsible for the linkage signal in American Indians. We also detected suggestive linkage signals in the Dakotas on chromosome 10p12 (LOD = 2.18) and in the combined centers (LOD = 2.24) on chromosome 10q21.
Conclusions
Replication of a serum bilirubin QTL on chromosome 2q in American Indians implicates UGT1A1 but further genotyping is warranted to identify additional causative polymorphisms. Evidence also supports a potential novel locus for bilirubin on chromosome 10. Am. J. Hum. Biol. 23:118–125, 2011.
Cardiovascular disease (CVD) is the leading cause of mortality in the American Indian population, and CVD rates in American Indians surpass other US populations and are more often fatal (Howard et al., 1999; Lee et al., 1990). The study of biological risk factors influencing CVD in American Indians is important as it may allow for the detection of genetic variants unique to this population and allow for further understanding of the complexity involved in cardiovascular molecular pathways. Therefore, understanding the complex etiology of CVD and its risk factors, including the underlying genetic components, in American Indians has important implications for medical and public health professionals.
One important risk factor for CVD is serum bilirubin, an antioxidant that suppresses lipid oxidation and retards atherosclerosis formation. A number of epidemiological studies have shown bilirubin to have an inverse relationship with the development of CVD (Bosma et al., 2003; Breimer et al., 1995; Djoussé et al., 2000; Gajdos et al., 2006; Hopkins et al., 1996; Hunt et al., 2001; Lin et al., 2006; Lingenhel et al., 2008; Rantner et al., 2008; Schwertner, 1998; Schwertner and Fisher, 2000; Schwertner et al., 1994). Population-based studies have demonstrated serum bilirubin levels vary with gender, race, and smoking status (Schwertner, 1998). The antioxidant properties of bilirubin result from its ability to inhibit the oxidation of low-density lipoprotein cholesterol and other lipids, scavenge oxygen radicals, and counteract oxidative stress (Schwertner and Vitek, 2008). In addition, bilirubin has been found to be a more effective protector of human ventricular monocytes than other antioxidants, including vitamins C and E. Bilirubin maintains its antioxidant properties whether it is free, conjugated, unconjugated, or albumin bound (Wu et al., 1996). Serum bilirubin is the principal product of heme degradation and levels are regulated by three enzymes: (1) heme oxygenase-1 (HMOX1); (2) biliverdin reductase (BLVR-A and BLVR-B); and (3) uridine diphosphate-glucurnosyltransferase (UGT1A1). HMOX1 and BLVR direct the synthesis of bilirubin, whereas UGT1A1 regulates the removal of circulating bilirubin (Sedlak and Snyder, 2004).
Two previous family-based genetic linkage studies on European populations identified a major quantitative trait locus (QTL) for bilirubin on chromosome 2q near the UGT1A1 gene (Kronenberg et al., 2002; Lin et al., 2003). The number of TA repeats in the UGT1A1 TATA promoter box is negatively associated with transcriptional activity, with 5 and 6 repeats (designated allele*36 and *1, respectively) associated with high-UGT1A1 activity, and 7 and 8 repeats (designated alleles *28 and *37, respectively) linked to low-transcriptional activity (Bosma, 2003). Individuals homozygous for 7 repeats (7/7) have higher levels of serum bilirubin when compared with heterozygous individuals (6/7) or individuals homozygous for 6 repeats (6/6). However, previous association studies between UGT1A1*28 and coronary artery disease (CAD) have demonstrated discordant results. Several studies found no association between UGT1A1*28 and CAD (Bosma et al., 2003; Gajdos et al., 2006; Lingenhel et al., 2008; Rantner et al., 2008), whereas the Framingham Offspring Study demonstrated individuals homozygous for the 7/7 genotype had one-third the risk of developing CVD and CAD as individuals with the 6 repeat allele (Lin et al., 2006).
The genetic influences on bilirubin levels in American Indians are unknown and little research has been conducted on the frequency and effect of the UTG1A1 promoter polymorphism within this group. Therefore, we conducted genome-wide screening and association analyses to localize loci influencing bilirubin levels in three geographical centers participating in the Strong Heart Family Study (SHFS) and to examine UTG1A1*28 frequency and its association with bilirubin levels in American Indians. The three objectives of this study are as follows: (1) to perform a genome screen for loci influencing bilirubin levels in the overall SHFS data set and in each of the three geographic centers (Arizona, Oklahoma, North and South Dakota), separately; (2) to genotype UGT1A1 promoter variation to assess the frequency of the UTG1A1*28 allele in American Indian populations; and (3) to test for genetic association in SHFS participants to establish whether UGT1A1*28 accounts for the chromosome 2q bilirubin QTL. To our knowledge, this is the first study to conduct genome-wide screening for loci influencing serum bilirubin and genetic association of the UGT1A1 promoter polymorphism in American Indians.
Materials and Methods
Study population
The Strong Heart Study (SHS) began in 1988 and is an epidemiological study that investigates cardiovascular risk factors and heart disease in the American Indian population (Howard et al., 1999). Population-based samples of American Indian participants aged 45–74 years were recruited from three geographic areas, Arizona, Oklahoma, and North and South Dakota in order to understand risk factors involved with CVD in this population.
In 1998, the SFHS was initiated in with the goal of localizing genes that influence CVD and associated risk factors in these same American Indian populations. In brief for the SHFS, American Indian participants aged 14 years and older were recruited without regard to disease status. Families were selected through a sibship of two to eight siblings who had participated in the original Strong Heart Epidemiological Study (Lee et al., 1990). Parents, spouses, offspring, spouses of offspring, and grandchildren of the original participants were then recruited to construct extended pedigrees. Detailed description of SHFS protocols have been previously published (North et al., 2003). All participants provided informed consent. In addition, approval for this study was obtained from the relevant American Indian tribes and institutional review boards. The epidemiological portion of this study was conducted from SHS participants, whereas the linkage and association portion of this study was conducted with SHFS participants.
Phenotype measurements and risk assessment
Collection protocols of phenotypic data have been described previously (North et al., 2003). Total bilirubin was assayed centrally at Penn Medical Laboratory (PML; MedStar Research Institute, Washington, DC) using TBIL dry slide reagents on the Vitros 950 platform (Ortho Clinical Diagnostics, Rochester, NY). Serum samples were centrifuged, aliquoted into o-ring cryovials in the field, stored in the dark at −80°C, shipped in liquid N2 vapor phase to PML, and then maintained at −80°C until assay. In addition to routine quality control (QC) procedures, blinded QC samples were drawn at study visits from 5 to 10% of participants, with comparable results to those from the study samples. To assess the relationship between bilirubin and CVD in American Indians, we analyzed epidemiological data from the larger SHS cohort using logistic regression. After excluding clinically overt CVD individuals at baseline and those with abnormal serum glutamic oxaloacetic transaminase (SGOT) and serum glutamic pyruvic transaminase (SGPT) levels, 2,399 participants remained at risk for CVD with a mean age of 63.3 years. Overt CVD individuals were those participants that had definite acute myocardial infarction, definite coronary heart disease (e.g., documented by angiography or need for coronary bypass procedure), or definite stroke (Howard et al., 1992).
Genotyping
Fasting blood samples were collected from SHFS participants by venipuncture and DNA was extracted using organic solvents at the Southwest Foundation for Biomedical Research (SFBR). Genomic DNA was amplified with separate primer specific polymerase chain reactions (PCR) for microsatellite (STR) markers using the ABI PRISM Linkage Mapping Set-MD10 Version 2.5 (Applied Biosystems, Foster City, CA). Pooled PCR products were loaded onto ABI PRISM 377 and Applied Biosystems 3100 Genetic Analyzers for laser-based automated genotyping. Resulting STRs were detected and size was estimated by comparison with the labeled size standard using the Genescan software package (Applied Biosystems). Genotypes were assigned using the Genotyper software package (Applied Biosystems). In families genotyped for genome-wide linkage screens, total bilirubin measurements are available for 3,602 participants (1,213 in Arizona, 1,189 in the Dakotas, and 1,200 in Oklahoma). All genotyping was conducted at SFBR in the Genetics Core Laboratory.
The UGT1A1 promoter polymorphism was analyzed on an Applied Biosystems 3100 (AB 3100) Genetic Analyzer. PCR was performed using the following pair of primers at a concentration of 0.37 pmol each: a 5-FAM labeled forward primer (5′-CACGTGACACAGTCAAAC-3′) and an unlabeled reverse primer (5′-CAACAGTATCTTCCCAGC-3′). Twenty nanograms of genomic DNA were amplified using the True Allele PCR Premix (Applied Biosystems) according to manufacturer's specifications with the following modifications: PCR cycling conditions were 95°C for 15 min, 28 cycles of 94°C for 30 s, 62°C for 30 s, 72°C for 30 s, and a final extension at 72°C for 10 min. The diluted, denatured PCR product and an added ROX size standard were loaded onto the AB 3100. Genotypes were assigned using Genotyper v2.1 software (Applied Biosystems).
Statistical analysis
Genome-wide linkage analyses and linkage conditional on associations with UGT1A1 TA repeats were conducted using variance component methods, as implemented in SOLAR (Almasy and Blangero, 1998). Identity by descent allele sharing was estimated on the basis of the genome-wide STR data. Sex, sex-specific age, and age-squared variables were included in all analyses. Linkage analyses of total bilirubin were conducted for each of three SHFS collection centers and for a combined single analysis of all three centers. Combined analysis of the three centers included center covariates allowing for different mean trait levels in the three centers. To make our analyses more comparable to previously published results from the Framingham Offspring Study (Lin et al., 2009), we included eight covariates in the initial polygenic model: height; weight; total cholesterol; hematocrit; albumin; SGOT; smoking; and alcohol consumption. Variables were kept within the final polygenic model if significantly associated with bilirubin at P < 0.05 level. Serum bilirubin was transformed using an inverse normalization (Rutherford et al., 2007) procedure available in SOLAR (Almasy and Blangero, 1998). Genome-wide P values were obtained by the Feingold et al. (1993) method.
Genetic association was conducted using a standard measured genotype test, by coding UGT1A1 genotypes as 0, 1, or 2, representing the number of 6 or 7-repeat alleles, and including this as a covariate in a polygenic model to test whether mean serum bilirubin differs by genotype. Conditional linkage was then conducted by rerunning the chromosome 2 linkage analyses while accounting for the effect of UGT1A1 genotype by including this covariate in the linkage model (Almasy and Blangero, 1998, 2004). Hardy-Weinberg equilibrium (HWE) was calculated for UGTA1A1 genotypes by comparing the likelihood of the frequency-based model with that of the allele frequency model as implemented in SOLAR (Almasy and Blangero, 1998).
Results
In the SHS epidemiological study conducted in these same populations, among 2,399 participants, there were 292 cases identified with CVD events as defined by Lee et al. (1990) during 6 years of surveillance and 2,107 controls without events. A logistic regression investigating the relationship between bilirubin levels and CVD, with age, sex, and body mass index (BMI) as significant covariates, resulted in an odds ratio of 0.4257 with higher bilirubin levels being associated with lower CVD risk (0.244–0.744; 95% Confidence Interval) and was highly significant (P = 0.0027).
Descriptive characteristics of untransformed bilirubin levels and significant covariates stratified by center in SHFS participants are summarized in Table 1. Participants in Arizona and Oklahoma had the highest bilirubin levels (8.00 ± 4.91 and 8.00 ± 5.10 μmol/l, respectively) and levels were lowest in the Dakotas (7.32 ± 4.94 μmol/l). Hematocrit, SGOT, and serum albumin were statistically significant covariates in all samples. Bilirubin levels differed by sex in the Combined, Arizona, and Oklahoma models, whereas Age2*Sex was a significant covariate in the Dakotas. Smoking was a significant covariate in all models except the Dakotas, where prevalence of smoking (43%) was highest.
TABLE 1. Characteristics of SHFS participants stratified by study center.
| Arizona | Oklahoma | Dakotas | Combined | |
|---|---|---|---|---|
| Total sample size | N = 1,202 | N = 1,182 | N = 1,100 | N = 3,484 |
| Female, N (%) | 758 (62)* | 709 (59)* | 705 (59) | 2,172 (60)* |
| Age, years, Mean (±SD) | 37.32 (16.00)* | 43.64 (17.29) | 39.03 (14.09) | 39.95 (17.02)* |
| Bilirubin, μmol/l, Mean (±SD) | 8.00 (4.91) | 8.00 (5.10) | 7.32 (4.94) | 7.78 (4.99) |
| Smoking, Current, N (%) | 309 (25)* | 399 (33)* | 508 (43) | 1,216 (34)* |
| Alcohol, Current, N (%) | 717 (58)* | 573 (48) | 792 (66) | 2,082 (58)* |
| Height, m, Mean (±SD) | 164.69 (8.7) | 167.55 (9.15) | 169.55 (8.9)* | 167.26 (9.1)* |
| Weight, kg, Mean (±SD) | 96.72 (27.35) | 87.77 (22.3) | 86.89 (21.65) | 90.46 (24.3) |
| Total cholest, mmol/l, Mean (±SD) | 4.51 (0.88) | 4.80 (0.96) | 4.70 (1.01) | 4.67 (0.96) |
| Hematocrit, Mean percent (±SD) | 42.12 (5.2)* | 43.03 (4.56)* | 41.85 (4.52)* | 42.34 (4.8)* |
| Serum albumin, mg/dl, Mean (±SD) | 3.87 (0.4)* | 4.02 (0.38)* | 3.99 (0.37)* | 3.96 (0.389)* |
| SGOT, U/l, Mean (±SD) | 39.6 (36.6)* | 32.37 (30.06)* | 28.33 (25.98)* | 32.46 (31.4)* |
| Age * Sex | * | NS | NS | NS |
| Age2 | NS | NS | * | NS |
| Age2 * Sex | NS | NS | * | NS |
| Dakota center | NS | NS | NS | |
| Oklahoma center | NS | NS | NS | NS |
NS, not statistically significant.
Statistically significant with bilirubin levels at P < 0.05.
Heritability estimates for serum bilirubin in the SHFS, after adjusting for significant covariates, are shown in Table 2. All heritabilities were significant at the 0.05 level. Participants from Oklahoma had the highest heritability (0.48 ± 0.05) and the Dakotas had the lowest (0.38 ± 0.07). Results of genome-wide linkage analyses of the combined sample and the three collection centers are summarized in Table 2 and displayed in Figure 1. The highest LOD for bilirubin occurred in the combined sample: 6.61 (genome wide P-value = 4.24 × 10⁻⁶) on chromosome 2q37.1 between markers D2S396 and D2S206 (Fig. 2). This signal comes primarily from Oklahoma participants, who had a LOD score of 5.65 (genome wide P-value = 4.57 × 10⁻⁵) near the same region, 2q37.2. A suggestive LOD score (1.83) was found in this region in the Arizona center and the linkage was lowest in the Dakotas (0.37). The highest LOD in the Dakotas was 2.18 on chromosome 10p12.1 between markers D10S1653 and D10S548 (Fig. 3). A suggestive LOD score (2.24) was also found in the combined sample on chromosome 10q. On the basis of previous genetic studies of bilirubin, we also investigated whether linkage signals were present in the regions of HMOX1, SLCOB1, SLCOB3, BLVR-A, and BLVR-B. The highest LOD observed near HMOX1 is in Oklahoma (0.42), whereas in two linkage scans, the LOD score was zero (Combined and the Dakotas). There are two isozymes of biliverdin reductase encoded by two genes, BLVR-A on chromosome 7 and BLVR-B on chromosome 19. We find no evidence of linkage near BLVR-A in any of the populations. We do find evidence of linkage in the chromosomal region encompassing BLVR-B in Oklahoma but not in either Arizona or the Dakotas. The highest LOD score observed near the SCLOB1 and SLCOB3 loci on chromosome 12 was in 1.15 in Arizona.
TABLE 2. Heritability, variance, significant, and suggestive LOD scores with and without UGT1A1 genotype.
| Center | Ha (SE) | Covariate varianceb | Chromosome | Orig LOD (P-value)a | UGT1A1 variancec | UGT1A1 P-value | LOD w/UGTIAl (P-value)a |
|---|---|---|---|---|---|---|---|
| Arizona | 0.38 (0.07) | 0.165 | 2q37 | 1.83 (NS) | 0.15 | 6.71 × 10−43 | 0.07 (NS) |
| Dakotas | 0.37 (0.05) | 0.202 | 2q37 | 0.336 (NS) | 0.08 | 8.63 × 10⁻²³ | 0.00 (NS) |
| Oklahoma | 0.48 (0.05) | 0.175 | 2q37 | 5.65 (4.57 × 10⁻⁵) | 0.11 | 5.17 × 10⁻¹⁷ | 3.23 (0.02) |
| Combined | 0.42 (0.03) | 0.173 | 2q37 | 6.61 (4.24 × 10⁻⁶) | 0.12 | 4.73 × 10−91 | 1.10 (NS) |
NS, not statistically significant.
Genome-wide P-value.
Proportion of variance explained by covariates (see Table 1).
Proportion of variance explained by UGT1A1 promoter genotype.
Fig. 1.
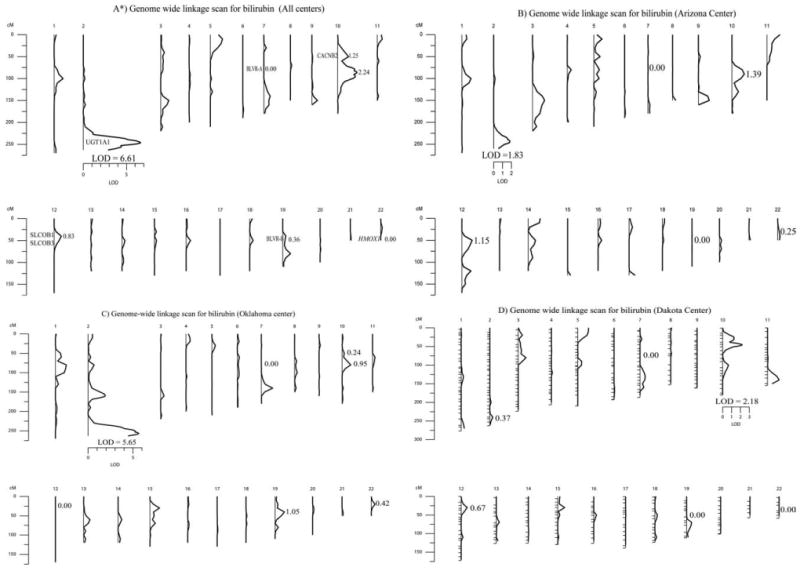
Multipoint LOD scores for bilirubin genome-wide linkage screens in the SHFS without including the effect of the UGT1A1 polymorphism: A) Combined; B) Oklahoma; C) Arizona; and D) Dakotas. *Also, shown are the locations of other genomic regions previously implicated for influencing bilirubin levels. BLVR-A on chromosome 7, CACNB2 on chromosome 10, SLCOB1 and SLCOB3 on chromosome 12, BLVR-B on chromosome 19, and HMOX1 on chromosome 22.
Fig. 2.
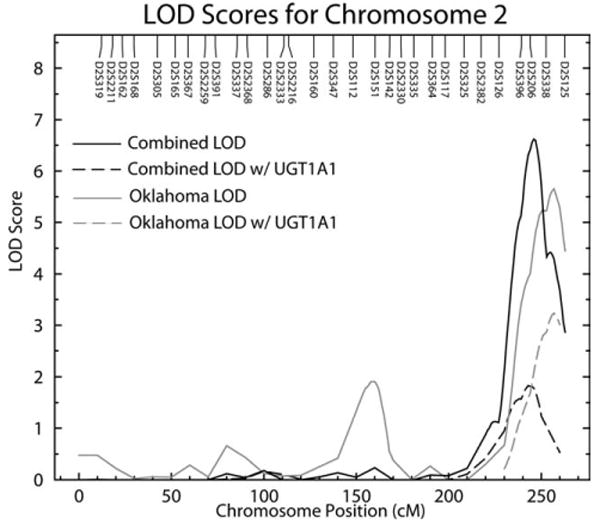
Multipoint LOD scores on chromosome 2 for serum bilirubin levels. Results for Combined and Oklahoma centers are shown for both standard linkage, without incorporating association results, and linkage conditional upon UGT1A1 promoter genotype.
Fig. 3.
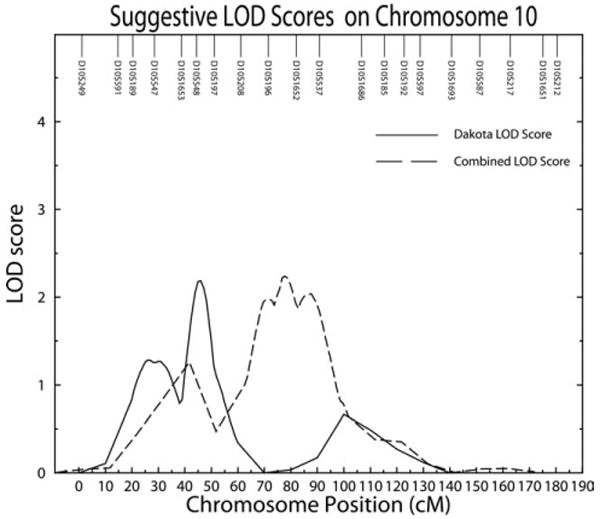
Multipoint suggestive LOD scores on chromosome 10 for serum bilirubin levels in the Combined and Dakota centers shown for standard linkage.
UGT1A1 promoter genotype frequencies are shown in Table 3 for SHFS and all centers, combined. The UGT1A1*1 (6 repeats) allele had the highest frequency in all three populations, ranging from 0.69 in the Dakotas to 0.59 in Arizona. Frequency of the UGT1A1*28 allele (7 repeats) was highest in Arizona (0.41) and lowest in the Dakotas (0.31). In addition, we found five participants with the UGT1A1*36 allele (5 repeats) and 27 with the *37 allele (8 repeats). Because of these low frequencies (<1%) and to be consistent with approaches used by previous studies, we combined the *36 allele with *1 allele and the *37 allele with the *28 allele for statistical analyses. Distribution of genotypes for all four population groups were in HWE. Untransformed bilirubin levels stratified by genotype are presented in Table 4. Average serum bilirubin was highest in participants with the 7/7 genotype and lower in individuals with the 6/7 and 6/6 genotypes in the three data centers and the combined sample. The highest bilirubin levels were detected in participants with genotype 7/7 from Oklahoma (13.18 ± 9.06) and were lowest in individuals with genotype 6/6 from Arizona (6.19 ± 3.08).
TABLE 3. UGT1A1 promoter allele frequencies, stratified by SHFS center.
| Population | N | *36(5)a | *1(6) | *28(7) | *37(8) | HWEb |
|---|---|---|---|---|---|---|
| Arizona | 1,247 | 0.001 | 0.589 | 0.409 | 0.001 | 0.43 |
| Dakotas | 1,200 | 0.000 | 0.685 | 0.313 | 0.002 | 0.07 |
| Oklahoma | 1,210 | 0.003 | 0.657 | 0.332 | 0.008 | 0.82 |
| Combined | 3,657 | 0.001 | 0.644 | 0.353 | 0.002 | 0.31 |
Number of TA repeats within UGT1A1 promoter region.
HWE, Hardy-Weinberg equilibrium P-values.
TABLE 4. Mean serum bilirubin levels (μmol/l) with standard deviations stratified by UGT1A1 promoter genotype and SHFS center.
| Center | Genotype *1/*1 | Genotype *1/*28 | Genotype *28/*28 |
|---|---|---|---|
| Arizona (SD) | 6.19 (3.08) | 7.61 (4.45) | 11.94 (5.81) |
| Dakotas (SD) | 6.40 (4.96) | 7.44 (3.93) | 11.32 (6.67) |
| Oklahoma (SD) | 6.75 (3.42) | 8.21 (4.79) | 13.18 (9.06) |
| Combined (SD) | 6.48 (3.93) | 7.75 (4.45) | 12.12 (7.01) |
Analysis of UGT1A1 repeat polymorphisms showed strong association with serum bilirubin levels in all three populations and the combined group (Table 1; P = 4.73 × 10−91). When linkage analyses were redone conditional on the observed association, inclusion of the UGT1A1 promoter genotype lowered the magnitude of the 2q linkage peak in the combined, Arizona and Dakota communities. However, a significant LOD score (3.23 genome P = 0.02) was still observed in the Oklahoma (Fig. 2).
Discussion
Results of this American Indian population-based study replicate previous genome wide linkage analyses that detected a significant QTL for bilirubin levels on chromosome 2q in European populations (Kronenberg et al., 2002; Lin et al., 2003). The most probable candidate gene in this region is UGT1A1, which regulates excretion of bilirubin. Previous research has suggested that the number of TA repeats in the UGT1A1 promoter affects variation in serum bilirubin levels (Kronenberg et al., 2002; Lin et al., 2003). Therefore, we genotyped participants in the three SHFS centers, tested for association with UGT1A1 promoter variants, and conducted linkage analyses conditional on UGT1A1 promoter genotypes. Our results indicate the UGT1A1 promoter polymorphism is significantly associated with bilirubin levels in all three SHFS centers but is not completely responsible for the observed chromosome 2q QTL in American Indians. This indicates that there may be important differences in functional variants influencing serum bilirubin levels between ethnic populations. In particular, the strong linkage results in the Oklahoma sample after accounting for UGT1A1 promoter genotype suggest there may be additional functional variants in or near UGT1A1 in this population. Therefore, further studies are required to determine if additional functional variants within UGT1A1 are responsible or if another gene in the chromosome 2q region or on chromosome 10p plays a role in the genetic control of bilirubin levels.
Genotypes for UGT1A1 promoter polymorphisms in North American Indians do not differ significantly from other comparable ethnic populations (Hall et al., 1999). The UGT1A1*1 allele is the most common allele across all of the previously reported ethnic populations and occurs in frequencies ranging from 42% in Africans to 86% in South American Indians (Hall et al., 1999). In the one comparative cohort of similar sample size, the Framingham Offspring Study (n = 1,780) which is primarily European American, the UGT1A1*1 allele had a frequency of 68% and the UGT1A1*28 allele frequency of 32%, comparable to the distribution found in the SHFS populations (Lin et al., 2009).
Analogous to several other studies (Bosma et al., 2003; Gajdos et al., 2006; Lin et al., 2006; Lingenhel et al., 2008; Rantner et al., 2008) individuals homozygous for the UGT1A1*28 allele in the SHFS had higher bilirubin levels than either heterozygote *1/*28 or homozygous *1 study participants. An epidemiological study of the Framingham Offspring cohort demonstrated that homozygous *28 individuals had one-third the risk of developing CVD as individuals with the *1 allele (Lin et al., 2006). However, several other studies have found no association between the *28 allele and CVD, and instead suggested that other factors that result in mild hyperbilirubinemia, such as heme-oxygenase, may be involved (Bosma et al., 2003; Gajdos et al., 2006; Lingenhel et al., 2008; Rantner et al., 2008). This makes the findings in this study intriguing as they confirm that bilirubin levels are associated with CVD in American Indian populations and that UGT1A1 has a major role in influencing overall bilirubin levels but also indicate that other biological factors are involved in its determination, including a novel suggestive linkage signal detected on chromosome 10p in the Dakotas.
The highest LOD scores in our genome wide scan for bilirubin were in the combined (LOD = 6.61) and Oklahoma (LOD = 5.65) centers between the regions of D2S396 and D2S206 on chromosome 2q37. This result is consistent with previously reported genome scans in European and European American populations (Kronenberg et al., 2002; Lin et al., 2003). Thus, our results confirm the presence of a major gene on chromosome 2q influencing bilirubin in different ethnic populations. The lack of a visible linkage in the Dakotas (LOD = 0.33) and Arizona (LOD = 1.83) centers of the UGT1A1 gene at chromosome 2q37, in contrast to European populations, suggests genetic differences between and within ethnic groups. These present results are derived from three specific subsets of the North American Indian population and each center of this study examined a cohort approximately equal in size to the Framingham Offspring Study (Lin et al., 2006). These populations are characterized by distinct cultural and linguistic features and separated by large geographic distances allowing for genetic variation between groups to have occurred. An alternative interpretation is that given the strong association signals with the UGT1A1 repeat in all three centers, low linkage power is responsible for the weak LOD scores observed in Arizona and the Dakotas. Therefore, we have chosen to report the linkage analyses for each center separately and the three centers combined.
This is the first study to perform linkage conditional on association to determine if UGT1A1 promoter variation could be completely responsible for the observed bilirubin linkage signal on chromosome 2q in American Indians. In all three SHFS centers and combined centers, there is strong association with the TA repeat and the LOD score is reduced in conditional analyses indicating that variation within the promoter region is involved in determining bilirubin levels. However, only in the Dakotas does the LOD score fall to 0, whereas in Oklahoma, the LOD score remains significant at 3.23. These results differ from those detected in the Framingham Heart Study, where the LOD score for bilirubin dropped from 3.8 to 0.4 when accounting for UGT1A1 (Lin et al., 2009). In conditional linkage analysis if the genotyped polymorphism is the sole functional variant, all evidence should disappear and the LOD score should drop to 0. However, if the genotyped marker is one of several functional sites, or if the polymorphism is not functional but in high linkage disequilibrium with another site, linkage will remain in the conditional analysis (Almasy and Blangero, 2004). These results further support important differences observed between SHFS centers and between different populations in this gene and indicate that other variation within UGT1A1 might also play an important role in determining variation in bilirubin levels in some populations. In addition to the promoter region, 14 other polymorphisms within the UGT1A1 gene have been studied. In a study of ethnically diverse women, Hong et al. (2007) found one UGT1A1 SNP (rs4148326) was significantly associated with bilirubin levels after accounting for the TA repeats in the promoter region. This SNP is found in the first intron of UGT1A1 and is a transition from cytosine to thymine.
Two recent genome wide association studies (GWAS) have confirmed the genetic influence of UGT1A1 on bilirubin and also identified additional candidate genes that may be associated with increased bilirubin levels on chromosome 12p (Johnson et al., 2009; Sanna et al., 2009). In an examination of 4,300 Sardinian individuals, significant association was detected on chromosome 12p within SLCO1B3 (solute carrier organic anion transporter family, member IB3) from two SNPs (rs17680137 and rs2117032) (Sanna et al., 2009). In addition a meta-analysis of three genome wide association studies also found significant association for a SNP (rs4149056) in the SLCO1B1 gene (Johnson et al., 2009). Bilirubin is a known substrate for both of these genes and both have been shown to be expressed in the liver (Smith et al., 2005). This indicates that other genetic variants besides those in UGT1A1 also contribute to variation in serum bilirubin levels. The GWAS meta-analysis of three studies by Johnson et al. (2009) investigated SNPs within 13 candidate loci aside from UGT1A1, SLCOB1, and SLCOB3. They did not find any genome wide significant (5.0 × 10⁻⁸) SNPs in any of these regions. They did report that one SNP in HMOX1 was nominally significant in an Icelandic study and one SNP in BLVR-B was nominally significant in both the Rotterdam and Icelandic studies. Both SNPs had values of P < 0.05. They identified one SNP (rs11190297) on chromosome 10q24 that was nominally significant in the meta-analysis but was not significant in any of the three cohorts by themselves.
We also detect a suggestive linkage signal (LOD = 2.18) in the Dakotas on chromosome 10p12. A potential candidate gene in this region is the calcium channel voltage-dependent subunit beta 2 (CACNB2) (Taviaux et al., 1997). CACNB2 contributes to the function of the calcium channel through increasing the calcium current peak, shifting voltage dependencies of activation and inactivation, modulates G protein inhibition, and controls α-1 subunit membrane targeting (Williams et al., 1992). Missense mutations within CACNB2 have been implicated in Brugada syndrome (Antzelevitch et al., 2007), a rare autosomal dominant disorder that results in idiopathic ventricular fibrillation (London et al., 2007). One earlier linkage study had identified a suggestive linkage signal on chromosome 10q25-26 and did not indicate any obvious candidate genes in this region (Kronenberg et al., 2002). This is a significant distance from where we observed our significant linkage signal on chromosome 10p12 but closer to where suggestive linkages were identified in our combined sample (LOD = 2.24).
In summary, we confirm significant evidence for the presence of a major gene on chromosome 2q influencing serum bilirubin levels in American Indians. A candidate gene in this region is UGT1A1, which encodes an enzyme that regulates the removal of bilirubin by the liver. Previous research has suggested that genetic variation in the UGT1A1 promoter region is associated with higher bilirubin levels. On the basis of this study's genetic association of the UGT1A1 promoter repeat polymorphism, we find that variation in this region contributes a significant amount of the serum bilirubin variance, but does not completely account for differences in American Indians. We also provide further evidence for a suggestive QTL located on chromosome 10p associated with serum bilirubin levels. Given the importance of bilirubin levels in understanding CVD risk as well as in drug metabolism, these results are of clinical significance and they suggest that genetic heterogeneity in factors influencing serum bilirubin levels may be present between populations. To determine what other human genomic regions contribute to bilirubin levels, further investigation is warranted in both American Indians as well as other ethnic populations.
Acknowledgments
The authors thank the Strong Heart Family Study participants, the Indian Health Service hospitals and clinical staff, and the directors of the SHS clinics. The views expressed in the article are those of the authors and do not necessarily reflect those of the Indian Health Service. All authors read and approved the final manuscript.
Contract grant sponsor: NIH (through the National Heart, Lung, and Blood Institute); Contract grant numbers: U01 HL65520, U01 HL41642, U01 HL41652, U01 HL41654, U01 HL65521; Contract grant sponsor: NIH; Contract grant number: MH59490; Contract grant sponsor: Research Facilities Improvement Program; Contract grant numbers: C06 RR013556, C06 RR017515.
Literature Cited
- Almasy L, Blangero J. Exploring positional candidate genes: linkage conditional on measured genotype. Behav Genet. 2004;34:173–177. doi: 10.1023/B:BEGE.0000013731.03827.69. [DOI] [PubMed] [Google Scholar]
- Almasy L, Blangero J. Multipoint quantitative-trait linkage analysis in general pedigrees. Am J Hum Genet. 1998;62:1198–1211. doi: 10.1086/301844. [DOI] [PMC free article] [PubMed] [Google Scholar]
- Antzelevitch C, Pollevick GD, Cordeiro JM, Casis O, Sanguinetti MC, Aizawa Y, Guerchicoff A, Pfeiffer R, Oliva A, Wollnik B, Gelber P, Bonaros EP, Jr, Burashnikov E, Wu Y, Sargent JD, Schickel S, Oberheiden R, Bhatia A, Hsu LF, Haïssaguerre M, Schimpf R, Borggrefe M, Wolpert C. Loss-of-function mutations in the cardiac calcium channel underlie a new clinical entity characterized by ST-segment elevation, short QT intervals, and sudden cardiac death. Circulation. 2007;115:442–449. doi: 10.1161/CIRCULATIONAHA.106.668392. [DOI] [PMC free article] [PubMed] [Google Scholar]
- Bosma PJ. Inherited disorders of bilirubin metabolism. J Hepatol. 2003;38:107–117. doi: 10.1016/s0168-8278(02)00359-8. [DOI] [PubMed] [Google Scholar]
- Bosma PJ, van der Meer IM, Bakker CT, Hofman A, Paul-Abrahamse M, Witteman JC. UGT1A1*28 allele and coronary heart disease: the Rotterdam study. Clin Chem. 2003;49:1180–1181. doi: 10.1373/49.7.1180. [DOI] [PubMed] [Google Scholar]
- Breimer LH, Wannamethee G, Ebrahim S, Shaper AG. Serum bilirubin and risk of ischemic heart disease in middle-aged British men. Clin Chem. 1995;41:1504–1508. [PubMed] [Google Scholar]
- Djoussé L, Levy D, Cupples LA, Evans JC, D'Agostino RB, Ellison RC. Total serum bilirubin and risk of cardiovascular disease in the Framingham Offspring study. Am J Cardiol. 2000;87:1196–1200. doi: 10.1016/s0002-9149(01)01494-1. [DOI] [PubMed] [Google Scholar]
- Feingold E, Brown PO, Siegmund D. Gaussian models for genetic linkage analysis using complete high-resolution maps of identity by descent. Am J Hum Genet. 1993;53:234–251. [PMC free article] [PubMed] [Google Scholar]
- Gajdos V, Petit FM, Perret C, Mollet-Boudjemline A, Colin P, Capel L, Nicaud V, Evans A, Arveiler D, Parisot F, Francoual J, Genin E, Cambien F, Labrune P. Further evidence that the UGT1A1*28 allele is not associated with coronary heart disease: the ECTIM study. Clin Chem. 2006;52:2313–2314. doi: 10.1373/clinchem.2006.078667. [DOI] [PubMed] [Google Scholar]
- Hall D, Ybazeta G, Destro-Bisol G, Petzl-Erler ML, Di Rienzo A. Variability at the uridine diphosphate glucuronosyltransferase 1A1 promoter in human populations and primates. Pharmacogenetics. 1999;9:591–599. [PubMed] [Google Scholar]
- Hong AL, Huo D, Kim HJ, Niu Q, Fackenthal DL, Cummings SA, John EM, West DW, Whittemore AS, Das S, Olopade OI. UDP-glucuronosyltransferase 1A1 gene polymorphisms and total bilirubin levels in an ethnically diverse cohort of women. Drug Metab Dispos. 2007;35:1254–1261. doi: 10.1124/dmd.106.014183. [DOI] [PubMed] [Google Scholar]
- Hopkins PN, Wu LL, Hunt SC, James BC, Vincent GM, Williams RR. Higher serum bilirubin is associated with decreased risk for early familial coronary artery disease. Arterioscler Thromb Vasc Biol. 1996;16:250–255. doi: 10.1161/01.atv.16.2.250. [DOI] [PubMed] [Google Scholar]
- Howard BV, Welty TK, Fabsitz RR, Cowan LD, Oopik AJ, Le NA, Yeh J, Savage PJ, Lee ET. Risk factors for coronary heart disease in diabetic and nondiabetic Native Americans. The strong heart study. Diabetes. 1992;41 2:4–11. doi: 10.2337/diab.41.2.s4. [DOI] [PubMed] [Google Scholar]
- Howard BV, Lee ET, Cowan LD, Devereux RB, Galloway JM, Go OT, Howard WJ, Rhoades ER, Robbins DC, Sievers ML, Welty TK. Rising tide of cardiovascular disease in American Indians. The strong heart study. Circulation. 1999;99:2389–2395. doi: 10.1161/01.cir.99.18.2389. [DOI] [PubMed] [Google Scholar]
- Hunt SC, Kronenberg F, Eckfeldt JH, Hopkins PN, Myers RH, Heiss G. Association of plasma bilirubin with coronary heart disease and segregation of bilirubin as a major gene trait: the NHLBI family heart study. Atherosclerosis. 2001;154:747–754. doi: 10.1016/s0021-9150(00)00420-2. [DOI] [PubMed] [Google Scholar]
- Johnson AD, Kavousi M, Smith AV, Chen MH, Dehghan A, Aspelund T, Lin JP, van Duijn CM, Harris TB, Cupples LA, Uitterlinden AG, Launer L, Hofman A, Rivadeneira F, Stricker B, Yang Q, O'Donnell CJ, Gudnason V, Witteman JC. Genome-wide association meta-analysis for total serum bilirubin levels. Hum Mol Genet. 2009;18:2700–2710. doi: 10.1093/hmg/ddp202. [DOI] [PMC free article] [PubMed] [Google Scholar]
- Kronenberg F, Coon H, Gutin A, Abkevich V, Samuels ME, Ballinger DG, Hopkins PN, Hunt SC. A genome scan for loci influencing anti-atherogenic serum bilirubin levels. Eur J Hum Genet. 2002;10:539–546. doi: 10.1038/sj.ejhg.5200842. [DOI] [PubMed] [Google Scholar]
- Lee ET, Welty TK, Fabsitz R, Cowan LD, Le NA, Oopik AJ, Cucchiara AJ, Savage PJ, Howard BV. The strong heart study. A study of cardiovascular disease in American Indians: design and methods. Am J Epidemiol. 1990;132:1141–1155. doi: 10.1093/oxfordjournals.aje.a115757. [DOI] [PubMed] [Google Scholar]
- Lin JP, Cupples LA, Wilson PW, Heard-Costa N, O'Donnell CJ. Evidence for a gene influencing serum bilirubin on chromosome 2q telomere: a genomewide scan in the Framingham study. Am J Hum Genet. 2003;72:1029–1034. doi: 10.1086/373964. [DOI] [PMC free article] [PubMed] [Google Scholar]
- Lin JP, O'Donnell CJ, Schwaiger JP, Cupples LA, Lingenhel A, Hunt SC, Yang S, Kronenberg F. Association between the UGT1A1*28 allele, bilirubin levels, and coronary heart disease in the Framingham heart study. Circulation. 2006;114:1476–1481. doi: 10.1161/CIRCULATIONAHA.106.633206. [DOI] [PubMed] [Google Scholar]
- Lin JP, Schwaiger JP, Cupples LA, O'Donnell CJ, Zheng G, Schoenborn V, Hunt SC, Joo J, Kronenberg F. Conditional linkage and genome-wide association studies identify UGT1A1 as a major gene for anti-atherogenic serum bilirubin levels-the Framingham heart study. Atherosclerosis. 2009;206:228–233. doi: 10.1016/j.atherosclerosis.2009.02.039. [DOI] [PMC free article] [PubMed] [Google Scholar]
- Lingenhel A, Kollerits B, Schwaiger JP, Hunt SC, Gress R, Hopkins PN, Schoenborn V, Heid IM, Kronenberg F. Serum bilirubin levels, UGT1A1 polymorphisms and risk for coronary artery disease. Exp Gerontol. 2008;43:1102–1107. doi: 10.1016/j.exger.2008.08.047. [DOI] [PMC free article] [PubMed] [Google Scholar]
- London B, Michalec M, Mehdi H, Zhu X, Kerchner L, Sanyal S, Viswanathan PC, Pfahnl AE, Shang LL, Madhusudanan M, Baty CJ, Lagana S, Aleong R, Gutmann R, Ackerman MJ, McNamara DM, Weiss R, Dudley SC., Jr Mutation in glycerol-3-phosphate dehydrogenase 1 like gene (GPD1-L) decreases cardiac NA+ current and causes inherited arrhythmias. Circulation. 2007;116:2260–2268. doi: 10.1161/CIRCULATIONAHA.107.703330. [DOI] [PMC free article] [PubMed] [Google Scholar]
- North KE, Howard BV, Welty TK, Best LG, Lee ET, Yeh JL, Fabsitz RR, Roman MJ, MacCluer JW. Genetic and environmental contributions to cardiovascular disease risk in American Indians: the strong heart family study. Am J Epidemiol. 2003;157:303–314. doi: 10.1093/aje/kwf208. [DOI] [PubMed] [Google Scholar]
- Rantner B, Kollerits B, Anderwald-Stadler M, Klein-Weigel P, Gruber I, Gehringer A, Haak M, Schnapka-Kopf M, Fraedrich G, Kronenberg F. Association between the UGT1A1 TA-repeat polymorphism and bilirubin concentration in patients with intermittent claudication: results from the CAVASIC study. Clin Chem. 2008;54:851–857. doi: 10.1373/clinchem.2007.102046. [DOI] [PubMed] [Google Scholar]
- Rutherford S, Cai G, Lopez-Alvarenga JC, Kent JW, Voruganti VS, Proffitt JM, Curran JE, Johnson MP, Dyer TD, Jowett JB, Bastarrachea RA, Atwood LD, Goring HH, Maccluer JW, Moses EK, Blangero J, Comuzzie AG, Cole SA. A chromosome 11q quantitative-trait locus influences change of blood-pressure measurements over time in Mexican Americans of the San Antonio family heart study. Am J Hum Genet. 2007;81:744–755. doi: 10.1086/521151. [DOI] [PMC free article] [PubMed] [Google Scholar]
- Sanna S, Busonero F, Maschio A, McArdle PF, Usala G, Dei M, Lai S, Mulas A, Piras MG, Perseu L, Masala M, Marongiu M, Crisponi L, Naitza S, Galanello R, Abecasis GR, Shuldiner AR, Schlessinger D, Cao A, Uda M. Common variants in the SLCO1B3 locus are associated with bilirubin levels and unconjugated hyperbilirubinemia. Hum Mol Genet. 2009;18:2711–2718. doi: 10.1093/hmg/ddp203. [DOI] [PMC free article] [PubMed] [Google Scholar]
- Schwertner HA. Association of smoking and low serum bilirubin antioxidant concentrations. Atherosclerosis. 1998;136:383–387. doi: 10.1016/s0021-9150(97)00232-3. [DOI] [PubMed] [Google Scholar]
- Schwertner HA, Fisher JR., Jr Comparison of various lipid, lipoprotein, and bilirubin combinations as risk factors for predicting coronary artery disease. Atherosclerosis. 2000;150:381–387. doi: 10.1016/s0021-9150(99)00387-1. [DOI] [PubMed] [Google Scholar]
- Schwertner HA, Jackson WG, Tolan G. Association of low serum concentration of bilirubin with increased risk of coronary artery disease. Clin Chem. 1994;40:18–23. [PubMed] [Google Scholar]
- Schwertner HA, Vitek L. Gilbert syndrome, UGT1A1*28 allele, and cardiovascular disease risk: possible protective effects and therapeutic applications of bilirubin. Atherosclerosis. 2008;198:1–11. doi: 10.1016/j.atherosclerosis.2008.01.001. [DOI] [PubMed] [Google Scholar]
- Sedlak TW, Snyder SH. Bilirubin benefits: cellular protection by a biliverdin reductase antioxidant cycle. Pediatrics. 2004;113:1776–1782. doi: 10.1542/peds.113.6.1776. [DOI] [PubMed] [Google Scholar]
- Smith NF, Figg WD, Sparreboom A. Role of the liver-specific transporters OATP1B1 and OATP1B3 in governing drug elimination. Expert Opin Drug Metab Toxicol. 2005;1:429–445. doi: 10.1517/17425255.1.3.429. [DOI] [PubMed] [Google Scholar]
- Taviaux S, Williams ME, Harpold MM, Nargeot J, Lory P. Assignment of human genes for beta 2 and beta 4 subunits of voltage-dependent Ca2+ channels to chromosomes 10p12 and 2q22-q23. Hum Genet. 1997;100:151–154. doi: 10.1007/pl00008704. [DOI] [PubMed] [Google Scholar]
- Williams ME, Feldman DH, McCue AF, Brenner R, Velicelebi G, Ellis SB, Harpold MM. Structure and functional expression of alpha 1, alpha 2, and beta subunits of a novel human neuronal calcium channel subtype. Neuron. 1992;8:71–84. doi: 10.1016/0896-6273(92)90109-q. [DOI] [PubMed] [Google Scholar]
- Wu TW, Fung KP, Wu J, Yang CC, Weisel RD. Antioxidation of human low density lipoprotein by unconjugated and conjugated bilirubins. Biochem Pharmacol. 1996;51:859–862. doi: 10.1016/0006-2952(95)02395-x. [DOI] [PubMed] [Google Scholar]