Abstract
In complex orbital defects, typically the eye globe is retruded in a pathological position. This is associated with severe functional and cosmetic post-traumatic conditions. Characteristically, the posterior orbital floor and the medial wall of the bony orbit (=region of interest, ROI) is fractured where adequate reconstruction is crucial for a satisfactory surgical outcome but difficult to achieve. By introducing the concept of preshaped, navigated orbital implants, the repair of complex orbital fracture patterns could be significantly facilitated and improved. However, this ROI, delineated according to surgical criteria, cannot be defined by distinct anatomical landmarks because of the absence of reliable anatomical features. The determination of homologous surface points therefore remains a problem in such regions. The aim of this study was to provide a method for the assessment of the 3D shape of the ROI and of its variability, respectively. By aligning an anatomically determinable region that embeds the region of interest with a thin plate spline, transformation homology can be determined suitable for subsequent state-of-the-art shape analysis. First results of shape variations are illustrated and give hints into the future of optimized implant design.
Key words: Shape analysis, bony orbits, fuzzy regions, landmarks
Introduction
Binocular vision includes the perception and fusion of information of both left and right eye. Facial injuries with involvement of the bony orbit frequently lead to a misalignment of the eye globes. Double vision and severe cosmetic defects are frequently observed sequels. This is mainly due to fractured bony orbital walls resulting in a pathologic enlarged and shaped bony orbit. Especially the posterior orbital floor and medial wall is an area of special importance where fractures (1) significantly affect the eye globe in its anterio-posterior position, leading to post-traumatic enopthalmos, and (2) are difficult to repair because of limited access and visibility during surgical reconstruction.1,2 Using existing surgical techniques, correct implant shaping and positioning therefore still remain a clinical challenge, and the result of primary surgery is frequently incomplete.
The present study is based on the assumption that the repair of such complex orbital defects could be significantly improved and facilitated by the development of anatomical preshaped orbital implants exactly positioned using intraoperative navigation. Such preshaped orbital implants will be shaped, sized, and positioned according to the preinjury region of interest (ROI) of a given fractured orbit.
The problem of related shape analysis of such ROIs is that its boundaries are lacking anatomical criteria. Anatomical landmarking becomes unreliable and the ROI remains fuzzy. Therefore, with regard to an optimized preshaped implant design, a method for a statistical analysis of fuzzy regions is presented as well as some results of the shape analysis.
The state-of-the-art method for investigating 3D shape variability is the principal components analysis (PCA) of triangulated surfaces that consist of homologous triangle vertices aligned according to the Procrustes Fit method. The determination of the triangulated ROI and its corresponding or homologous points is the most critical step in the analysis. It greatly influences the outcome of the shape analysis. Many different methods exist for the production of surfaces with corresponding or homologous points and the subsequent shape analysis.
One topic in current research investigates three-dimensional statistical modeling. Bookstein3 published a comprehensive text on geometric morphometrics that addresses topics from shape coordinates to relative warps. However, this work focuses primarily on two-dimensional landmark data and only briefly mentions three-dimensional problems. In contrast, Zollikofer and Ponce de León4 focus more on the technique of virtual reconstruction in a primer for computer-assisted paleontology and biomedicine.
Dryden and Mardia5 provide an excellent entry on statistical shape analysis and address many problems regarding geometric morphometrics. This work, however, like that of Bookstein,3 relates more to landmark data and fails to discuss the computation of average shapes consisting of thousands of non-homologous points.
Lamecker et al. solve the correspondence problem in three-dimensional shapes consisting of a large dataset of points by an interactive approach which is able to handle shapes of arbitrary topology such as the genus 3 surface of the pelvic bone.6 The authors specify corresponding anatomical features as boundary constraints to the matching process. In,7 they apply the method on some orbits subdivided into some anatomically meaningful patches to examine their shape variability.
Rajamani et al.8 address the problem of extrapolating an extremely sparse three-dimensional set of digitized landmarks and bone surface points to obtain a complete surface representation. The extrapolation is done using a statistical PCA shape model. The correspondence problem was solved with a semi-automatic landmark-driven method and an optimization based on the minimum description length criteria.
Styner et al.9 present comparative studies in three anatomical structures of four different correspondence-establishing methods. They analyze both the direct correspondence via manually selected landmarks as well as the properties of the model implied by the correspondences, in regard to compactness, generalization, and specificity.
In this work, a method is described that is particularly well suited for analyzing ROIs that are not clearly identifiable by anatomic landmarks such as parts of orbital walls or floors. The proposed method is simple and uses commercially or freely available software enhanced with script procedures to relieve the work involved in processing large samples. It is based on thin plate splines used for non-rigid registration.3,10
Materials and Methods
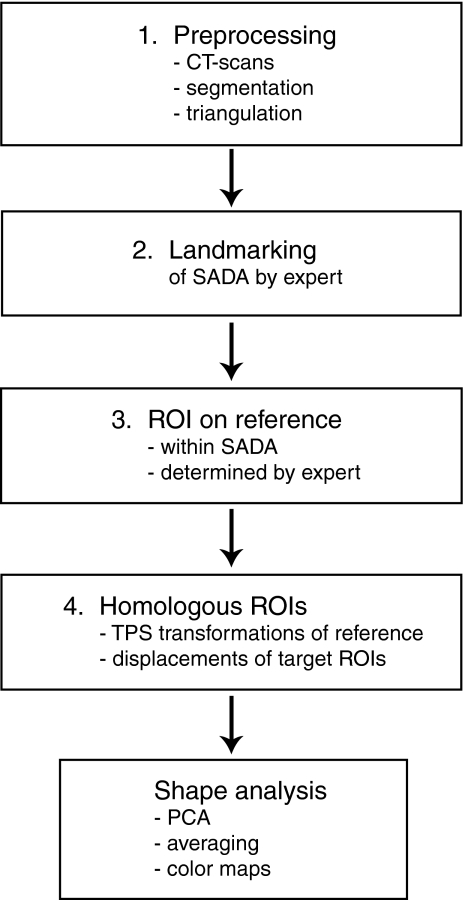
The proposed method, summarized and illustrated in Figure 1, was applied on 136 ROIs (68 left and right ROIs) extracted from CT scans of 68 patients (34 women, 34 men, age 20–88 years) obtaining routine diagnostic procedures but having unaffected orbits.
Fig 1.
The major steps of a method for analyzing a fuzzy region on bony orbits.
The clinical CT scans, with a typical resolution of 0.4 × 0.4 × 0.4 mm, were first anonymized and semi-automatically segmented. Most parts of the orbital regions were obtained by using 3D and 2D region growing tools. Only the very thin orbital walls were manually enhanced by an expert with anatomical knowledge of the orbit. As the partial volume effect of the scans lowers the gray values of parts of the very thin orbital walls, region growing tools fail to segment them correctly, and therefore, they were manually thickened on the extraorbital side by using a brush tool but by preserving the intraorbital wall side to be assessed. After segmentation, triangulated surfaces of the bony orbit were produced, as illustrated in Figure 2.
Fig 2.
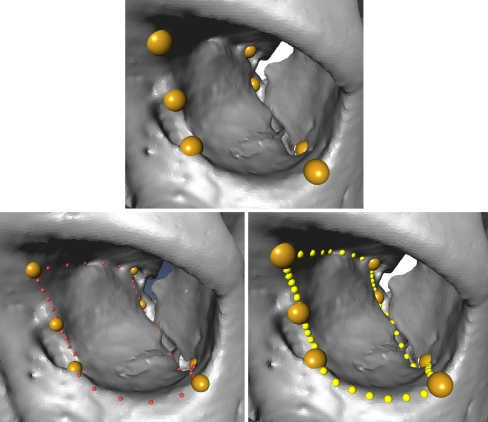
Some meaningful anatomical landmarks are manually set and determine a SADA of the orbital floor and medial wall (upper). Some (non-homologous) landmarks are manually placed between the anatomical landmarks (lower left). They define the border of the SADA. Then, homologous landmarks of the patch border of the extended ROI are determined by computing a given number of equidistant border points (=anatomical–mathematical landmarking) (lower right).
In the second step, an expert manually placed seven homologous landmarks on the border of the extended ROI corresponding to the smallest anatomical definable area (SADA). These landmarks, illustrated in Figure 2 (upper), were anatomically meaningful and could be located repeatedly by an expert. The expert then defined non-homologous landmarks along the border of the SADA, as illustrated in Figure 2 (lower left). These non-homologous landmarks were next made homologous by computing a given number of equidistant landmarks between two subsequent anatomical landmarks and by linear interpolation of the non-homologous intermediate landmarks. The SADA could then be defined by a certain number of homologous border points as illustrated in Figure 2 (lower right).
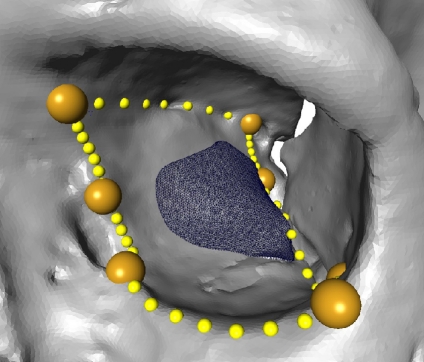
In the third step, an expert selected the proper ROI within the SADA (see Fig. 3) according to surgical criteria. This embedded ROI was only defined once on one reference orbit, which should be a typical orbit with an appropriate regular triangulation and no holes or triangle intersections. This reference ROI, together with the corresponding homologous landmarks (see Fig. 4 upper left) of the SADA, were then used to determine the equivalent ROIs of the other bony orbits consisting of non-homologous surface vertices.
Fig 3.
The embedded reference ROI is manually selected by an expert in the reference orbit.
Fig 4.
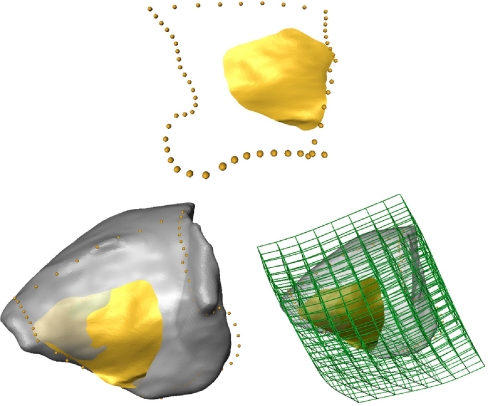
The reference ROI (upper, lateral view) is warped on the target orbit volume (lower left, medial view). The lower right picture visualizes the deformation of a space grid produced by the TPS warp.
The homologous surface points of the embedded ROI for all remaining orbits were computed in the fourth step. The following approach was developed. The untransformed embedded reference ROI was warped to each of the orbits by a thin plate spline (TPS) transformation by using the LandmarkSurfaceWarp module of the Amira software (Visage Imaging). This transformation fit all homologous border points of the SADA to each other and transformed the reference ROI accordingly by deforming it slightly, as illustrated in Figure 4 (lower left, right).
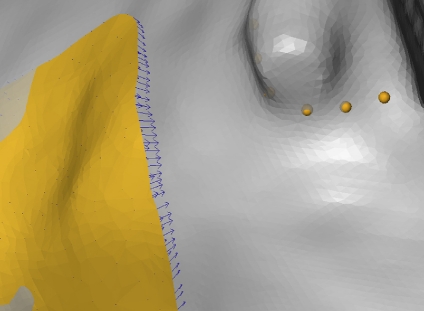
Then, according to the closest point method, the SurfaceDistance module of Amira computed a vector field of the distances between the warped reference ROI and a given orbit for each triangle vertex of the warped reference ROI (shown in Fig. 5).
Fig 5.
The distance vectors from the reference ROI on the target orbit.
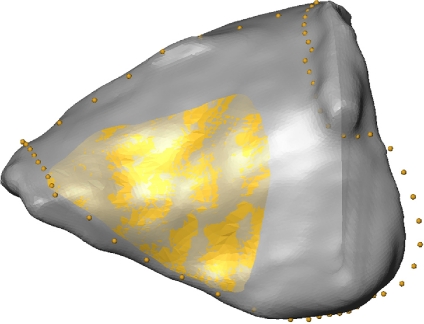
Finally, the corresponding distance vectors were added to the vertex points of the warped reference ROI, and the corresponding vertex points of the target ROI were thus obtained as shown in Figure 6. These newly generated points, together with the same triangulation structure of the reference ROI, represent the embedded ROI of the target. This embedded ROI of the target consisted of exactly the same number of homologous surface points as the reference. All of these operations were scripted in Amira and all of the ROI determinations for the 136 orbits were performed in a single run.
Fig 6.
The homologous ROI on the target orbit obtained by adding the distance vectors to the reference ROI vertices.
The resulting 136 homologous ROIs were next aligned by a generalized Procrustes Fit and analyzed by PCA. This analysis was performed by the cost-free Morphologika software. Converting the 136 STL (Standard Triangulation Language) files of triangulated surfaces of the ROIs into a Morphologika input file was straightforward and programmed by a TCL script (Tool Command Language).
Results
This work presents a simple method for 3D shape analysis of ROIs without distinct anatomical criteria which are embedded in an anatomically well-defined area. For the latter, we used smallest anatomical definable areas. Although it has only been applied on human bony orbits, its principle can be applied on any anatomical region of the human skeleton or even arbitrary shapes with smooth topology of the ROIs. The method can be conducted with the commercially available software Amira, enhanced with a few scripts, and the cost-free software Morphologika, for example. The figures in the ‘Results’ section are intended to show potential uses of the method. A profound discussion of the clinical relevance and the clinical aspects of the shape analysis of the SADA and the ROI itself is in work and will be published later.
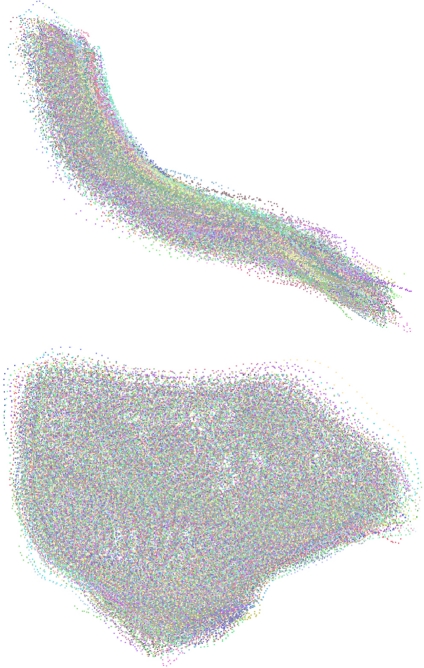
Applied on 136 human bony orbits, this method provides a means of generating a 3D shape analysis, which might be of interest for future optimized implant design. Figure 7 shows two different views of a point cloud generated from aligning the 136 ROIs according to the generalized Procrustes Fit. All of the ROIs were rigidly aligned and isotropically scaled so that the distances between the homologous surface points of all of the ROIs and the mean shape were minimized. This point cloud offers a visual impression of the shape variability of the ROIs.
Fig 7.
Generalized Procrustes Fit of 136 ROIs of left and mirrored right orbits (upper, frontal view; lower, lateral view).
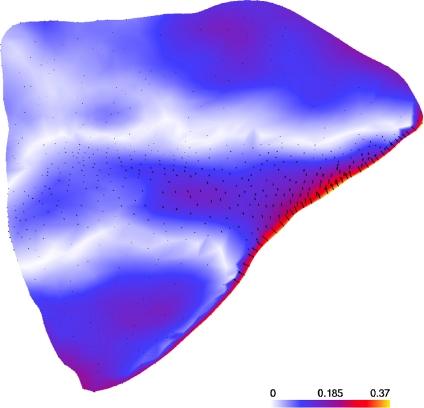
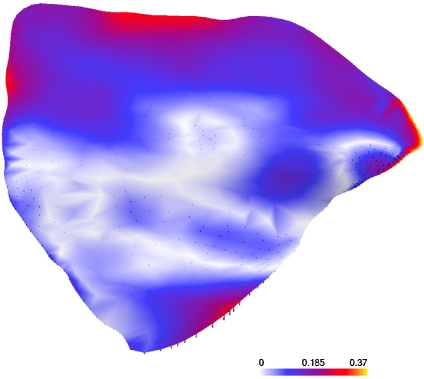
Figure 8 compares the mean shapes of the left and mirrored right ROIs of the sample using a color map of the distances [mm] of the homologous surface points on the left mean shape. The displacement vectors are also shown. The mean shapes were computed after rigid and scaling Procrustes Fits. Then, for comparison, both mean shapes were again fitted to each other by the same procedure. As expected, there was no significant shape difference between left and right ROIs. The majority of the distances were below 0.2 mm. The deviations were slightly higher at the border of the inferior orbital fissure but remained below 0.4 mm (the CT scan resolution). These higher deviations were most likely border artifacts, as the proposed method is not well suited in regions with strong curvature.
Fig 8.
Comparison of the mean shapes of left and right (mirrored) ROIs of the orbit [mm].
Figure 9 shows a similar comparison between the mean shapes of the left ROIs of women and men. Also, here most distances are smaller than 0.2 mm and some higher ones can be found on the border. It can be concluded that, between women and men of this sample, there is no clinically significant shape difference.
Fig 9.
Comparison of left ROIs of women and men [mm].
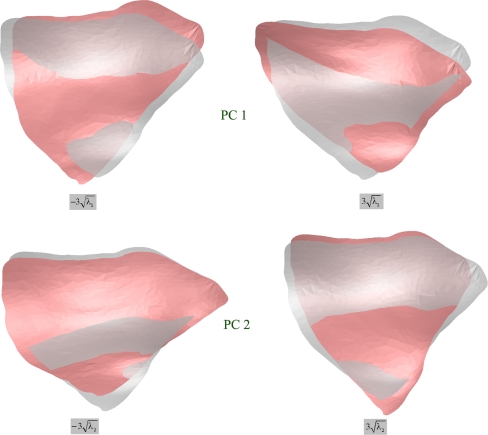
Since the modified ROIs consisted of homologous points, standard PCA, similar to that described in,11 was applied to investigate principal shape variations. Figure 10 illustrates the effects of varying the first and second parameter of the principal components model. In this example, according to the computed eigenvalues, the first and second components describe  of the shape variance.
Fig 10.
Effects of varying the first and second parameter of the ROI model within ranges covering most of the variations. The middle gray shapes correspond to the mean shape.
Discussion
To the best of our knowledge, for the first time, a method for the assessment of 3D shape variations of fuzzy regions with a clinical application in the human bony orbit has been presented. It has been applied on the posterior part of the orbital floor and medial wall which are typically affected in complex orbital fractures. The method is general and can be applied to other anatomical regions of human bones. It can be applied by state-of-the-art imaging tools such as Amira enhanced by some scripting. However, this method also has its limitations. It should only be applied on smooth ROIs without sharp edges. In order to preserve the homology of points, the extended anatomical ROI should not be much larger than the ROI itself. Methods that use shape-preserving re-parameterization12 for the determination of homologous ROIs would probably yield better results in the cases where the anatomical ROI exceeds the ROI by a significant amount. A profound discussion of this problem can be found in13 where the authors provide a tutorial and survey of methods for parameterizing surfaces with a view to applications in geometric modeling and computer graphics. It is also planned to compare the method developed in this work with a similar method based on shape-preserving parameterization of surface triangulations. With that said, most applications concerning shape variability of ROIs of the human skeleton refer to sufficiently smooth ROI surfaces, which could be treated with this method. In both methods, best homology is obtained using anatomically well-defined regions corresponding to SADAs. In many anatomical regions, there may not be sufficiently pure homologous anatomical landmarks. Therefore, in addition to simple anatomical landmarking, the concept for creating additional landmarks termed in this work as anatomical–mathematical landmarking at the boundaries (Fig. 2, lower right) and mathematical landmarking with TPS transformations for the surfaces (Fig. 2) is a possibility for creating homology in 3D shape analysis of anatomical structures such as bone.
Conclusions
Preliminary results of the method applied on the ROI are illustrated here and provide an avenue to the future of preshaped implant design. An exhaustive shape analysis and discussion of its clinical relevance and consequence, with respect to an optimized orbital implant design, is beyond the scope of this work and will be addressed in a future study.
Acknowledgement
The underlying surgical concept is formulated in a dedicated research project supported by the AO Research Fund of the AO Foundation (AO Research Grant 05-H37).
Contributor Information
Hansrudi Noser, Phone: +41-81-4142589, FAX: +41-81-4142285, Email: hansrudi.noser@aofoundation.org.
Beat Hammer, Email: beat.hammer@hirslanden.ch.
Lukas Kamer, Email: lukas.kamer@aofoundation.org.
References
- 1.Hammer B. Orbital fractures: diagnosis, operative treatment, secondary corrections. Seattle: Hogrefe & Huber; 1995. [Google Scholar]
- 2.Hammer B, Kunz C, Schramm A, deRoche R, Prein J. Repair of complex orbital fractures: technical problems, state-of-the-art solutions and future perspectives. Ann Acad Med Singapore. 1999;28(5):687–691. [PubMed] [Google Scholar]
- 3.Bookstein FL. Morphometric tools for landmark data, geometry and biology. Cambridge: Cambridge University Press; 1991/97. [Google Scholar]
- 4.Zollikofer CPE, Ponce de León M. Virtual reconstruction, a primer in computer-assisted paleontology and biomedicine. New York: Wiley-Interscience; 2005. [Google Scholar]
- 5.Dryden IL, Mardia KV. Statistical shape analysis. Chichester: Wiley; 1998. [Google Scholar]
- 6.Lamecker H, Seebaß M, Hege HC, Deuflhard P. A 3D statistical shape model of the pelvic bone for segmentation. Proc SPIE—Med Imaging 2004: Image Processing. 2004;5370:1341–1351. [Google Scholar]
- 7.Lamecker H, Kamer L, Wittmers A, Zachow S, Kaup T, Schramm A, Noser HR, Hammer B: A method for the three-dimensional statistical shape analysis of the bony orbit, CAS-H 2007, 4th International Conference on Computer Aided Surgery around the Head, Innsbruck, February 21–24, 2007
- 8.Rajamani KT, Nolte LP, Styner M. Bone morphing with statistical shape models for enhanced visualization. Proc SPIE Med Imaging. 2004;5367:122–130. [Google Scholar]
- 9.Styner MA, Rajamani KT, Nolte LP, Zsemlye G, Szekely G, Taylor CJ, Davies RH. Evaluation of 3D correspondence methods for model building. Inf Process Med Imaging. 2003;18:63–75. doi: 10.1007/978-3-540-45087-0_6. [DOI] [PubMed] [Google Scholar]
- 10.Daniel R. Nonrigid registrations: concepts, algorithms, and applications. In: Hajnal JV, Hill DLG, Hawkes DJ, editors. Medical image registration. Boca Raton: CRC; 2001. pp. 281–298. [Google Scholar]
- 11.Cootes TF, Taylor CJ, Cooper DH, Graham J. Active shape models—their training and applications. Comput Vision Image Understanding. 1995;61/1:38–59. doi: 10.1006/cviu.1995.1004. [DOI] [Google Scholar]
- 12.Floater MS. Parameterization and smooth approximation of surface triangulations. Comput Aided Geomet Des. 1997;14:231–250. doi: 10.1016/S0167-8396(96)00031-3. [DOI] [Google Scholar]
- 13.Floater MS, Hormann K. Surface parameterization: a tutorial and survey. Advances in multiresolution for geometric modeling. Berlin: Springer; 2005. pp. 157–186. [Google Scholar]


