Abstract
Mammograms are X-ray images of human breast which are normally used to detect breast cancer. The presence of pectoral muscle in mammograms may disturb the detection of breast cancer as the pectoral muscle and mammographic parenchyma appear similar. So, the suppression or exclusion of the pectoral muscle from the mammograms is demanded for computer-aided analysis which requires the identification of the pectoral muscle. The main objective of this study is to propose an automated method to efficiently identify the pectoral muscle in medio-lateral oblique-view mammograms. This method uses a proposed graph cut-based image segmentation technique for identifying the pectoral muscle edge. The identified pectoral muscle edge is found to be ragged. Hence, the pectoral muscle is smoothly represented using Bezier curve which uses the control points obtained from the pectoral muscle edge. The proposed work was tested on a public dataset of medio-lateral oblique-view mammograms obtained from mammographic image analysis society database, and its performance was compared with the state-of-the-art methods reported in the literature. The mean false positive and false negative rates of the proposed method over randomly chosen 84 mammograms were calculated, respectively, as 0.64% and 5.58%. Also, with respect to the number of results with small error, the proposed method out performs existing methods. These results indicate that the proposed method can be used to accurately identify the pectoral muscle on medio-lateral oblique view mammograms.
Key words: Mammography, pectoral muscle segmentation, computer-aided diagnosis, biomedical image analysis
Introduction
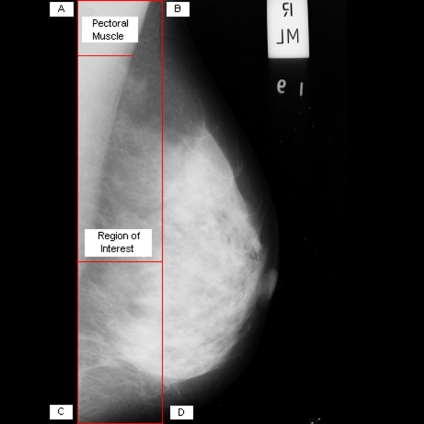
Breast cancer ranks second among cancer related deaths in woman (after lung cancer) in the USA. Mammography is especially valuable as an early detection tool because it can identify breast cancer at an early stage. Numerous studies have shown that early detection saves lives and increases treatment options. The recent declines in breast cancer mortality have been attributed to the regular use of screening mammography and to improvements in treatments.1 Pectoral muscle appears as a triangular opacity across the upper posterior margin of the mammogram (see Fig. 1).2 Automatic identification of the pectoral muscle on medio-lateral oblique (MLO) view mammograms is an essential step for computerized analysis of mammograms. It can reduce the bias of mammographic density estimation, will enable region-specific processing in lesion detection programs, and may be used as a reference in image registration algorithms.3 Also, accurate identification of the pectoral muscle is important for its suppression or exclusion from mammograms so that the subsequent analysis of breast cancer without the pectoral muscle bias can be carried out.
Fig 1.
Extraction of region of interest.
It is a hard task to estimate the volume of pectoral muscle in mammograms through naked eyes and slice-by-slice manual segmentation of the pectoral muscle is a tedious and time consuming process. Computer assistance is demanded in such medical applications due to the fact that it could improve the results of human interpretation in such a domain like mammogram analysis where the negative cases must be at a very low rate. Automatic identification of the pectoral muscle using computer makes the tough job easier for mammographic analysis which may involve the study of breast diseases. Like most of the previous methods,4,5 cranio-caudal (CC) view mammograms are not taken into account for our analysis as studies show that the pectoral muscle is seen only in about 30% to 40% of CC images.2
Prior Works
There are several methods proposed in the literature to identify the pectoral muscle in mammograms. Suckling et al.6 used multiple-linked self-organizing neural network to segment mammograms into four major components, which include the pectoral muscle. However, this neural network-based method may produce drastically different results depending on the training set chosen and critically depend on good training information which is not always available. Sometimes, it is expensive or impractical to acquire even a small number of good training samples. Masek et al.7 presented a threshold-based algorithm which uses the threshold obtained through minimum cross-entropy thresholding algorithm,8 and also, a straight-line fitting technique is used to smoothly represent the pectoral muscle. However, this method extracts pectoral muscle as straight line which may not be always accurate as curved pectoral muscle is also present in mammograms. A two-step technique consisting of estimation and refinement of the pectoral muscle edge is suggested by Kwok et al.4,9 The estimation step of the pectoral muscle edge uses an iterative threshold and straight-line fitting with gradient test. The refinement step uses surface smoothing and edge detection. The main disadvantage of this method remains in its weakness in detecting texture and vertical pectoral edges. Another notable work is by Karssemeijer et al.10 They used Hough transform and a set of thresholds to identify the pectoral muscle. Inspired by this work of Karssemeijer, several authors used the Hough transform for the pectoral muscle segmentation. Ferrari et al.11 segmented mammograms into skin-air boundary, fibro-glandular tissue, and pectoral muscle using the Hough transform. In another work,12 an approximate estimation of pectoral muscle boundary is done using Hough transform, and the boundary is then refined using dynamic programming. Aylward et al.13 suggested a method using gradient magnitude ridge traverse algorithm which parallels that of Karssemijer’s approach.10 Weidong et al.14 used an optimal threshold which is obtained using an iterative thresholding technique applied on a set of region of interest to partially segment the pectoral muscle. Then, the partially segmented pectoral muscle is refined by twice-line fitting and polygon approaching technique. The line fitting uses Hough transform for straight-line band detection.
In the method based on Hough transformation,11 the hypothesis of a straight line for the representation of the pectoral muscle is not always correct and may impose certain limitations in the subsequent image analysis.5 To overcome the limitations of the straight-line representation, a work of Ferrari et al.5 utilized Gabor wavelets as the primary tool to segment the pectoral muscle. However, the results of this method mainly depend on the chosen choice of the filter parameters. Raba et al.15 combined an adaptive histogram approach and a selective region growing algorithm to achieve the pectoral muscle segmentation. But, for mammograms where the dense tissues appear near the pectoral muscle, this region-growing algorithm may produce segmentation leakage in which dense tissues are included in pectoral muscle region. Fei ma et al.16–18 proposed two graph-based methods which relies on global image information to segment the pectoral muscle. The first method uses minimum spanning tree (MST) algorithm which is well known for its speed, and the second method uses adaptive pyramid (AP) algorithm for the pectoral boundary detection. Both of these methods use active contour technique in common to improve the details of the identified ragged pectoral muscle boundary. The MST algorithm is sensitive to noise if the original algorithm is applied on mammograms without initial filtering as the single edge decides the merge of regions. Also, it has one more limitation, when it was used for the pectoral muscle segmentation, it failed to identify the pectoral muscle for some images where the pectoral muscle size is very small.18
Most of the available methods in the literature identify pectoral muscle as straight line. However, mammograms can also have curved pectoral muscle. Hence, the proposed work attempts to consider pectoral muscle both as straight line and curve using Bezier curve for the accurate detection of the pectoral muscle.
Overview of the Proposed Method
This work proposes a method for the pectoral muscle identification on medio-lateral oblique-view mammograms. This method uses a proposed graph cut-based image segmentation technique for finding out the pectoral muscle edge. In each iteration of the segmentation technique, two adjacent regions are merged if a merging criterion is satisfied. The merging criterion involves graph cut and low-level features. The pectoral muscle is then represented using Bezier curve which uses the control points obtained from the pectoral muscle edge. The results obtained through this method are very promising.
In this method, mammograms of the left breasts are processed directly and mammograms of the right breasts are flipped before the pectoral muscle identification. Now, if the mammograms are carefully examined, the following anatomical features can be noted.
The intensities of the pectoral muscle are normally higher than the surrounding tissues.4,9,14 The pectoral muscle has nearly homogeneous gray-level values.5
After the elimination of the unwanted black portion in the left side of the mammogram, the pectoral muscle occupies the top left corner of the image. In another words, the pixel at the spatial coordinate (1, 1) belongs to the pectoral muscle.9,18
The pectoral muscle forms a roughly triangular shape region.4,9,18
Traversing this from top to bottom, there is a gradual decrease in the width of the pectoral muscle. The right side of this shape may be approximated by a straight line and its deviation, say a curve.4,9
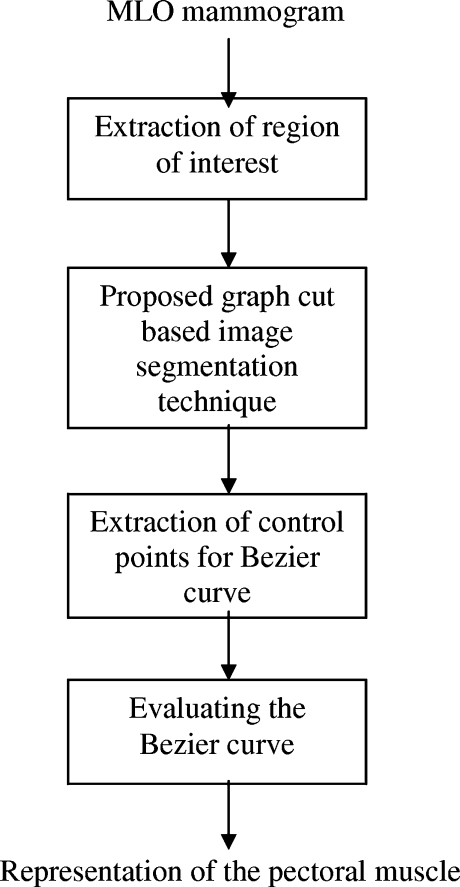
This method is developed by adopting these observations. Initially, as a preprocessing step, mammogram is cropped to a region of interest (ROI) which includes the pectoral muscle completely. As the pectoral muscle has nearly homogeneous and distinguishable gray level values over the surrounding tissues, a graph-cut-based segmentation technique is used to segment the ROI. At the end of the segmentation, a region which includes the pixel at the spatial coordinate (1, 1) is identified as the pectoral muscle region. However, the pectoral muscle edge is ragged and should be refined to clearly represent the pectoral muscle. Hence, observations 3 and 4 are used to represent the pectoral muscle edge smoothly using Bezier curve. The overview of the proposed work is represented in Fig. 2.
Fig 2.
Overview of the proposed method.
Extraction of Region of Interest
The background of a mammogram generally consists of a film label to identify the image, noise, and other artifacts such as scratches or unexposed areas of film. Also, a high-quality MLO mammogram should have the pectoral muscle visible to the depth of the nipple or below.2,19 Hence, the rectangular region ABDCA (see Fig. 1) is extracted as our ROI which includes the entire pectoral muscle. This is done to eliminate the unwanted regions (which may also interfere the identification) to reduce the time complexity.
The Proposed Graph-Cut-Based Segmentation Technique
The proposed graph-cut-based segmentation technique is used for the segmentation of the ROI. The segmentation method consists of three major steps: formation of a graph, sorting of graph edges, and region merging. A weighted graph G = (V, E) is constructed from the digital image such that the vertices, V, are the pixels of the digital image and the edges, E, are defined between neighborhood pixels. The weight of any edge, say w(vi, vj) is a measure of dissimilarities between the pixels vi and vj. Once the graph is created, edges are sorted in nondecreasing order of their weights, say <e1, e2,……en> such that w(e1) ≤ w(e2)….. ≤ w(en). Each time, one edge (ei) in sorted order is picked up from e1 to en. The edge ei is present between two groups of pixels. Now, it has to be decided whether to merge two groups of pixels to form a (single) group or not. Each vertex is initially considered as a group. If the merge criterion (Eq. 8) is satisfied, then the two groups are merged. Finally, multiple groups of pixels representing different regions or objects are obtained.
Intra-region Edge Average
Assume that there are “n” regions after the ith iteration of region merge. For the (i + 1)th iteration, a suitable homogeneity representative of the two regions should be selected and compared for region merge. The homogeneity representative of a region could be selected in different ways. However, edges could be used as a good indicator of homogeneity. Say, for example, if the weight for an edge is defined on the basis of the similarity of pixels, then a higher value for the edge represents that the two pixels which are connected by that edge are more homogeneous. A randomly chosen edge or the smallest weight edge or the greatest weight edge of a region could be an outlier and, hence, cannot be considered as the homogeneity representative. The mean of a bunch of random edges also could not be considered as a good choice as some important details might have been lost due to other pixels that are not considered. The mean of all edges will be a good choice as it includes the contribution of all edges of a group, and which also eliminates random noise. Thus, the intra-region edge average (IRA) which is a single-valued function and represents the homogeneity of a group is defined as
 |
1 |
IRA for a region “R” is a measure of the mean of the weight of edges in “R.” Va is a set of edges in the region “R” which can be represented as
 |
2 |
Inter-Region Edge Mean
The discussion for computing IRA can be applicable to compute the homogeneity representative for intermediate edges between the two regions. Hence, we define inter-region edge mean (IRM) as
 |
3 |
IRM is a measure of the mean of the weight of edges between the two regions, R1 and R2. Vb is a set of edges between the two regions, R1 and R2, which can be represented as
 |
4 |
Dynamic Thresholds
The degree of variations among pixels of a region can be inferred from the homogeneity representative of the region IRA. To merge pixels of two regions, the IRM must be above a threshold value. This threshold must be computed based on the IRA and other parameters to control the merge operation adaptive to the properties of regions. Hence, we define a dynamic threshold (DT) for merging between two regions R1 and R2 as given in the following equation
 |
5 |
The appropriate selection of the parameters (δ1 and δ2) plays a vital role as it determines the merge of regions. Values of these parameters are chosen to achieve the following desirable features: (1) when more number of regions is present, then the choice of the values (of δ1 and δ2) should favor merging of regions; (2) the choice of the values should allow the grouping of small regions than large regions. The large regions should be merged only when their intensity values are more similar; (3) it is preferred to have values that are adaptive to the total number of regions and the number of vertices in the regions that are considered for merge. Hence, the parameters δ1 and δ2 are defined as
 |
6 |
 |
7 |
We refer NR to the total number of regions. Initially, NR = |V|, the size of the vertices and each merge decreases the value of NR by one. |Ri| indicates the number of vertices in the region “Ri.” C is a positive constant and is equal to two for the pectoral muscle segmentation which is found through experimental studies.
Merge Criterion
When the pixels of a group have intensity values similar to the pixels of the other group, then intuitively the calculated IRM between these groups should be small. The expected smaller value of the IRM to merge these two regions is tested by comparing it with the dynamic threshold. Hence, the merge criterion, to merge the two regions, R1 and R2, is defined as
 |
8 |
In Appendix, we have shown how this merge criterion works for homogeneous and non-homogeneous regions.
Bezier Curve
The segmentation technique results in the identification of the pectoral muscle as a region which starts at the left-top pixel at the spatial coordinate (1, 1) and extends to the right-bottom direction as a triangular shape. The edge of the identified pectoral region is ragged and is necessary to smoothly represent the pectoral muscle edge. Hence, extracting the pectoral edge as both straight line and curve is important in automatic evaluation of mammogram adequacy.20 Smooth curves can effectively be modeled using Bezier curves. For Bezier curve representation of the pectoral muscle, control points from the pectoral muscle edge should be extracted. As the pectoral muscle region width gradually deceases from top to bottom in the right side, the right-topmost pectoral pixel is selected as the first control point. The subsequent control points are selected in such a way that moving in the direction top to bottom and up to the row where the pectoral muscle is seen, the rightmost pectoral pixel is chosen which is not equal to and greater than the previously chosen control point. Finally, a set of control points of distinct values in order is obtained.
Bezier curve can be generalized for “n + 1” control points, b0, b1, b2……bn obtained from the segmented pectoral muscle as
 |
9 |
 |
10 |
where  is the binomial coefficient. One of the known properties of the Bezier curve is that if all control points lie in a straight line, then the Bezier curve also forms a line. It is a useful property for our application as the pectoral muscle could be extracted as a straight line and its deviations. Evaluating the Bezier curve at a given value “t” yields a point f(t). As the value of “t” increases from 0 to 1, the point f(t) evolves as a curve segment. One of the best known methods to evaluate the Bezier curve is the de Casteljau’s algorithm. The de Casteljau’s algorithm is a recursive method which takes the control points as the input, and it can be represented as
 |
11 |
Each point is superscripted by its level of recursion.21
In a few mammograms, false boundaries are formed within the pectoral muscle due to pectoralis minor5 and auxiliary folds.4,18 These boundaries are approximately parallel to the true pectoral muscle boundary. The presence of such pseudo boundaries may influence the pectoral muscle identification. To overcome this problem, the adjacent regions are merged repeatedly to the initially identified pectoral muscle region, when it satisfies the pectoral muscle triangular condition. In this method, the triangular condition is checked in such a way that the number of control points obtained for a chosen pectoral region should be at least 20% of the total number of rows of the region.
Experimental Setup
For effective comparison of the proposed work with existing methods (the Hough transform, Gabor wavelets, MST algorithm, and AP algorithm), we used a dataset which was used for validating these previous works. A set of images containing 84 randomly chosen mammograms and their coordinates of the pectoral muscle edge as marked by a radiologist were kindly given by Rangayyan5 which enabled us to conduct tests and validate the proposed work. The mammograms were obtained from mammographic image analysis society database,22 and all images were MLO mammograms with 200-μm sampling interval and 8 bit gray level depth. The mammograms were initially down-sampled to 256 × 256 pixels and processed in order to reduce the time complexity. Finally, results were up-sampled to the original size of 1,024 × 1,024 pixels for subsequent analysis.
We extracted the ROI from the mammogram as follows:
We defined two points P1 and P2 from the mammogram. Point P1 is the Y-coordinate value of the pixel whose intensity value is slightly greater than the background intensity when traversing forward across the first row starting from the first pixel of the mammogram. Point P2 is the Y-coordinate value of the pixel whose intensity is equal to the background intensity when traversing forward across the first row starting from the point P1.
All the pixels of the mammogram whose Y-coordinate are either P1 or P2 or positions in between these two points irrespective of X-coordinate were selected as the ROI.
We used the absolute value of difference between pixels as the edge weight function.
 |
12 |
We refer Iu and Iv to denote intensity value of the pixels u and v, respectively. We used counting sort23,24 to arrange the graph edges in increasing order. The major work involved in the segmentation technique is equivalent to finding the graph cut which denotes the affinity between two regions. Also, it is a measure to show how much these two regions are homogeneous and could be combined.
The area normalized error5,18 was used as a quantitative measure to evaluate the segmentation performance of the proposed work. This measure paved a direct way for the comparison of the proposed method with existing methods. This measure involves the calculation of the number of false positive (FP) and false negative (FN) pixels normalized by the area of ground truth (pectoral muscle as marked by the radiologist). A pixel is assigned to FP when it is present in the algorithm identified pectoral muscle but not in the ground truth. And a pixel is assigned to FN when it is present in the ground truth but not in the algorithm identified pectoral muscle. The FP and FN values for a mammogram image I for the left breast were calculated as
 |
13 |
 |
14 |
where A(I) is the area of ground truth and p is the number of rows of pectoral muscle in the mammogram. Balg (i) is the horizontal coordinate of pectoral muscle edge in the ith row as identified by the algorithm. Bgro (i) is the horizontal coordinate of pectoral muscle edge in the ith row of the ground truth. A total match between the algorithm identified edge and the ground truth results in zero value calculated against FP and FN.
For a set of “n” images, the mean of FP and FN values were calculated as
 |
15 |
Results and Discussion
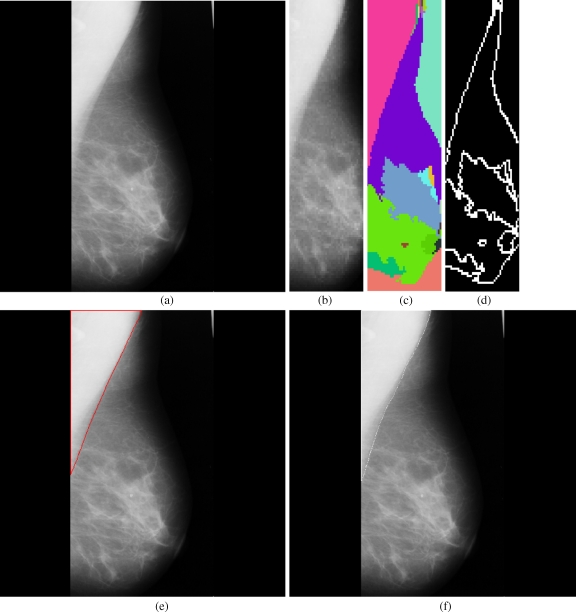
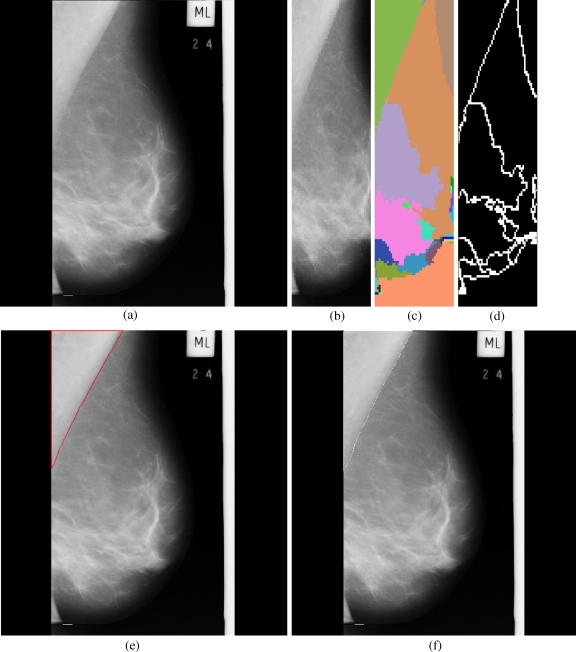
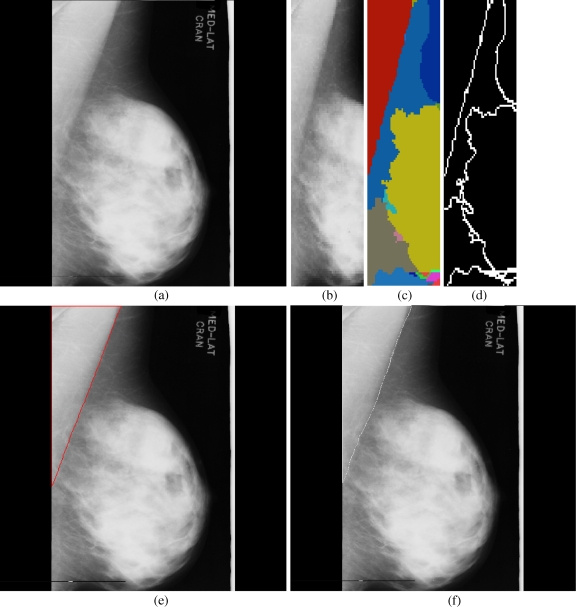
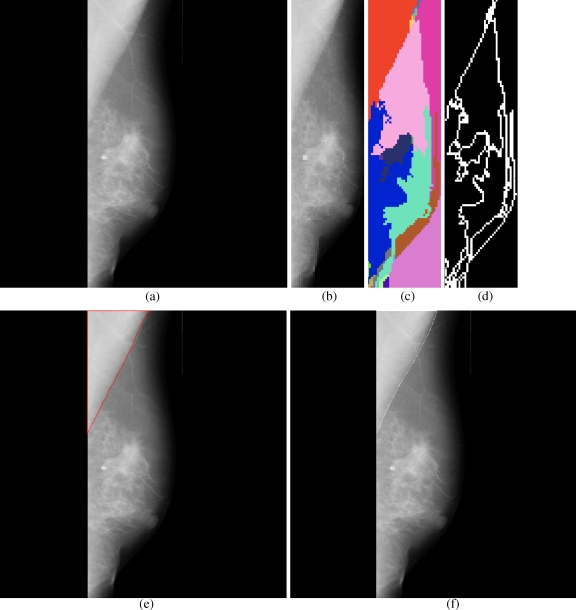
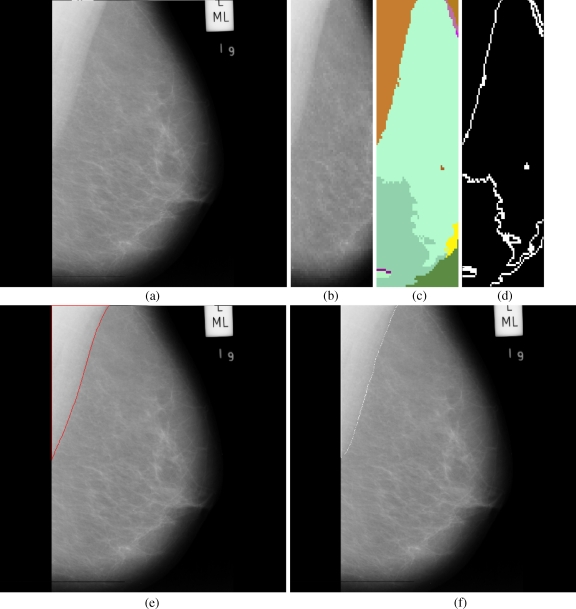
Totally 84 MLO mammograms were processed using the proposed method [results are available on request], and a few results are reported for illustration in the Figures 3, 4, 5, 6, and 7. For 84 mammograms, FP and FN values were calculated and its analysis is reported in Table 1 along with the values obtained for the state-of-the-art methods. The proposed method takes approximately 20 s for identifying the pectoral muscle using a Pentium IV, 3.0 GHz, 512 MB RAM machine, running Matlab 7.0 environment.
Fig 3.
Results obtained for each stage in the pectoral muscle identification: a mdb048, b extracted ROI, c segmented boundaries, d edge image, e pectoral muscle identification by the proposed method (red), f ground truth (white).
Fig 4.
Results obtained for each stage in the pectoral muscle identification: a mdb051, b extracted ROI, c segmented boundaries, d edge image, e pectoral muscle identification by the proposed method (red), f ground truth (white).
Fig 5.
Results obtained for each stage in the pectoral muscle identification: a mdb067, b extracted ROI, c segmented boundaries, d edge image, e pectoral muscle identification by the proposed method (red), f ground truth (white).
Fig 6.
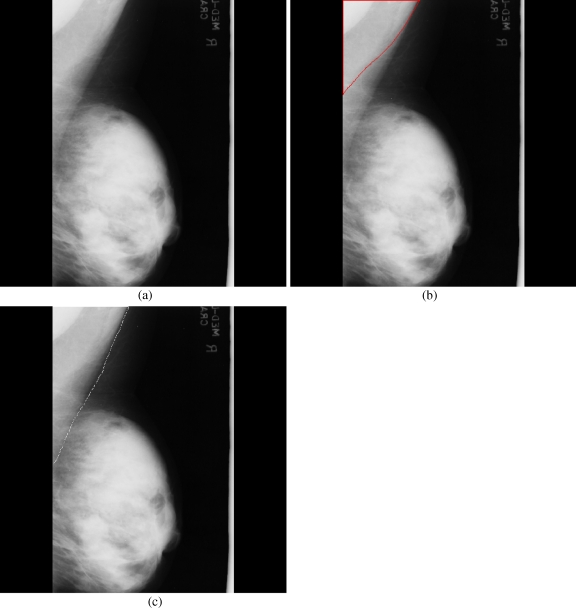
Results obtained for each stage in the pectoral muscle identification: a mdb074, b extracted ROI, c segmented boundaries, d edge image, e pectoral muscle identification by the proposed method (red), f ground truth (white).
Fig 7.
Results obtained for each stage in the pectoral muscle identification: a mdb077, b extracted ROI, c segmented boundaries, d edge image, e pectoral muscle identification by the proposed method (red), f ground truth (white).
Table 1.
Segmentation Performance Analysis by Area Normalized Error
| Hough transforma | Gabor waveletsa | AP algorithmb | MST algorithmb | Proposed method | |
|---|---|---|---|---|---|
| FPm | 0.0198 | 0.0058 | 0.0371 | 0.0255 | 0.0064 |
| FNm | 0.2519 | 0.0577 | 0.0595 | 0.1168 | 0.0558 |
| FP < 0.05 and FN < 0.05 | 10 | 45 | 50 | 40 | 43 |
| min(FP, FN) < 0.05 and 0.05 < max(FP, FN) < 0.10 | 0 | 0 | 18 | 20 | 19 |
| min(FP, FN) < 0.05 and max(FP, FN) > 0.10 | 0 | 0 | 11 | 18 | 22 |
| 0.05 < FP < 0.10 and 0.05 < FN < 0.10 | 8 | 22 | 0 | 0 | 0 |
| 0.05 < min(FP, FN) < 0.10 and max(FP, FN) > 0.10 | 0 | 0 | 0 | 1 | 0 |
| FP > 0.10 and FN > 0.10 | 66 | 17 | 5 | 3 | 0 |
The first two rows report the mean FN and FP values. The next six rows report the distribution of FP and FN values. For all methods except the MST algorithm, the values were reported for 84 mammograms
aValues for the Hough transform and Gabor wavelets were previously reported by Ferrari et al.13
bValues for the adaptive pyramid and minimum spanning tree algorithm were previously reported by Fei ma et al.17 For the MST algorithm, the values were reported for 82 mammograms as the method did not identify the pectoral muscle in two mammograms
In terms of FPm, the performance of the proposed method is comparable to the method based on Gabor wavelets and surpasses the Hough transform, AP and MST algorithm. The FNm value of the proposed method is comparable to Gabor wavelets and adaptive pyramid, and these methods perform better than the Hough transform and MST algorithm.
As we move from top to bottom in the error distribution (FN and FP values), the error range gradually increases in some way such that the third row indicates the lowest error range and the last row indicates the highest error range. For the proposed method, all the images distributed within the first three rows of error distribution indicate that the method has lower error with respect to the number of images among all the compared methods. For AP and MST algorithm, except for a few images, other images are distributed in the first three rows of error distribution. This shows that these two methods are comparable and have lower error in term of number of images when compared to the Hough transform and Gabor wavelet. Even though the method based on Gabor wavelets has lower mean error, the distribution of many images in the highest error range makes it inferior, with respect to the number of images with lower error, when compared to the Gabor wavelet, MST, and proposed method. The proposed method produces results in such a way that any one of the error values (FP and FN) may be greater than 0.05, but not both. This shows the superior consistency of this proposed method when compared to all existing methods including Gabor wavelets in producing good-quality results.
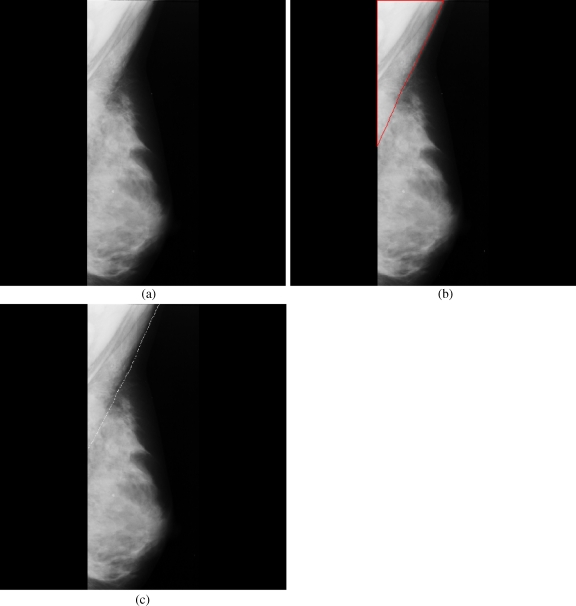
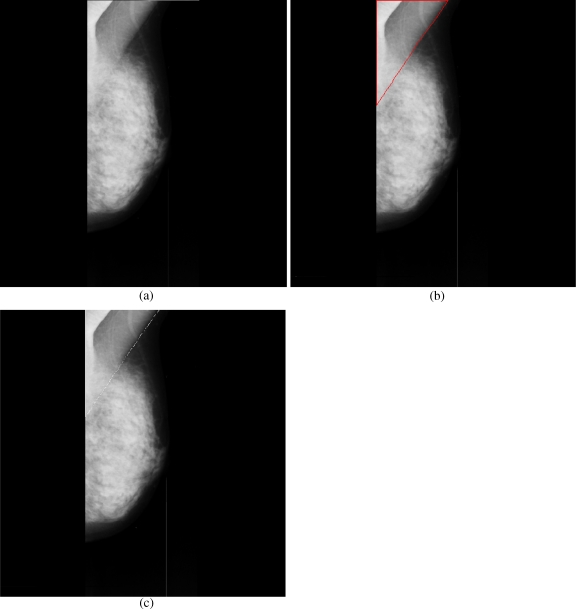
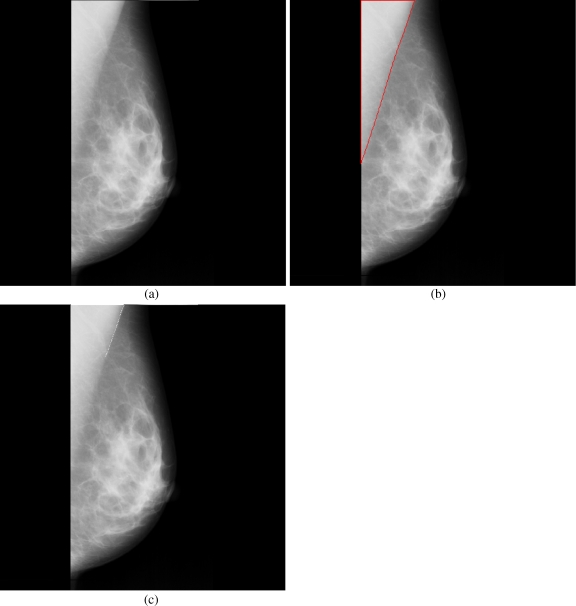
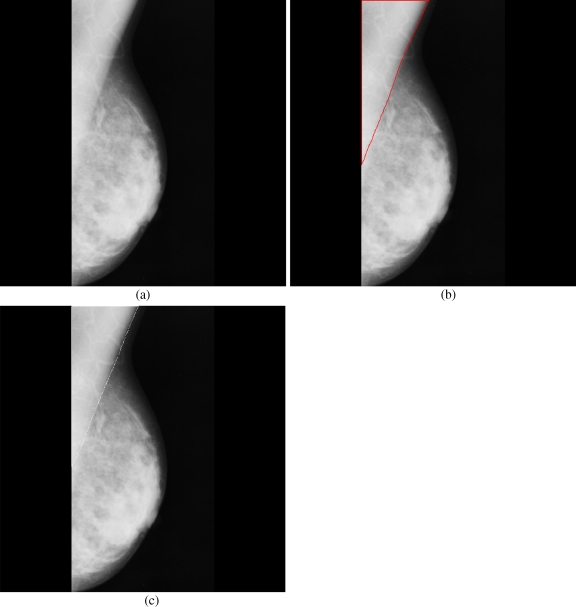
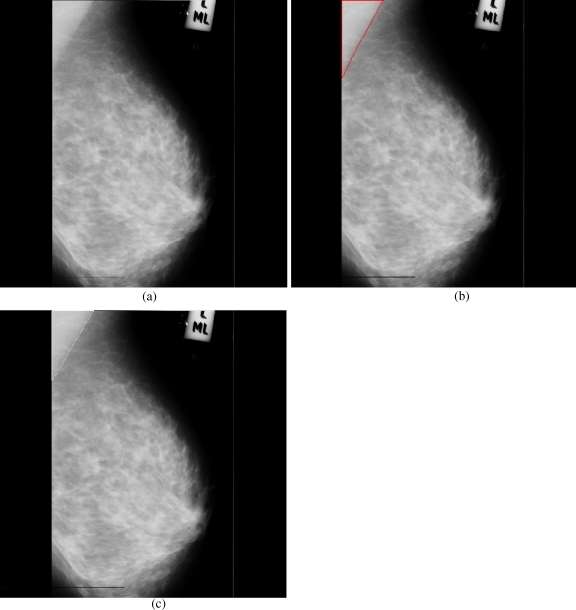
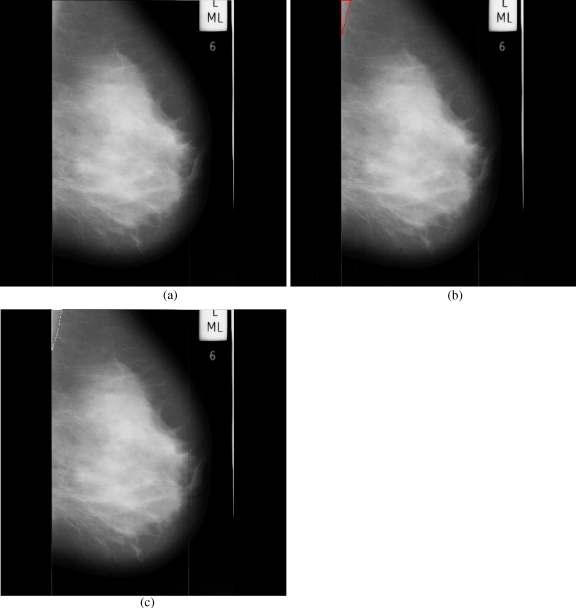
Among a few mammograms where strong pseudo boundaries are seen, the method missed out the accurate identification of the pectoral muscle in one mammogram (Fig. 8); however, it produced acceptable results in other images (for instance, Figs. 9 and 10). The superior performance of the algorithm may be seen in successfully identifying the pectoral muscle in the mammogram given in Figure 11, where the ground truth appears to be incomplete. A few complicated mammograms where the dense tissues appear near the pectoral muscle did not show significant differences between the ground truth and the method identified pectoral muscle (Figs. 12 and 13). Moreover, in a few images where the size of the pectoral muscle is very small, the method found out the pectoral boundary with adequate precision (Fig. 14).
Fig 8.
Pseudo boundaries accepted: a mdb068, b pectoral muscle identification by the proposed method (red), c ground truth (white).
Fig 9.
Pseudo boundaries ignored: a mdb034, b pectoral muscle identification by the proposed method (red), c ground truth (white).
Fig 10.
Pseudo boundaries ignored: a mdb039, b pectoral muscle identification by the proposed method (red), c ground truth (white).
Fig 11.
Incomplete ground truth: a mdb055, b pectoral muscle identification by the proposed method (red), c ground truth (white).
Fig 12.
Ignored dense tissues: a mdb124, b pectoral muscle identification by the proposed method (red), c ground truth (white).
Fig 13.
Ignored dense tissues: a mdb129, b pectoral muscle identification by the proposed method (red), c ground truth (white).
Fig 14.
Identified small volume pectoral muscle: a mdb109, b pectoral muscle identification by the proposed method (red), c ground truth (white).
Conclusion
A new method to identify the pectoral muscle in MLO mammograms is presented in this paper. This method uses a proposed graph-cut-based image segmentation technique and Bezier curve for the identification of the pectoral muscle in mammograms. The developed method was tested on 84 MLO mammograms obtained from the mammographic image analysis society database. The manually drawn pectoral muscle boundaries of these mammograms by an experienced radiologist were used as ground truth for validation and comparison. A quantitative analysis of the obtained results computed the mean false positive and false negative rates, respectively, as 0.64% and 5.58%. The validation results clearly demonstrate that the performance of the proposed work is better than the existing graph-theory-based methods (AP and MST algorithm) which are meant for the pectoral muscle identification. The accuracy of this method is comparable to the method based on Gabor wavelets. However, with respect to the number of the images with small errors, the proposed method outperforms existing methods including Gabor wavelets. As a graph-theory-based method, the test results obtained for the proposed method are very much promising, and the proposed method could be used as a preprocessing step in computer-aided diagnosis applications. The proposed method uses low level image features and a few anatomical constraints to identify the pectoral muscle. However, the accuracy of the proposed method could further be improved by incorporating high level image features and anatomical constraints.
Acknowledgement
The authors wish to thank the anonymous reviewers for their important corrections and suggestions that have been included in the text. The authors would like to thank Rangayyan RM for providing a set of mammograms with radiologist drawn pectoral muscle boundaries. The authors would also like to thank Vimal SP, of BITS Pilani, for the useful discussions with him.
Appendix
The merge criterion can be expanded as two conditions as
 |
16a |
 |
16b |
 |
17a |
 |
17b |
Let  . Now, Eqs. 17a and 17b can be written as
 |
18a |
 |
18b |
For the merge criterion to be true, any one of these conditions in Eqs. 18a and 18b must be satisfied. If the two regions, R1 and R2, are homogeneous, then the non-homogeneity measures  become small; hence, any one of these conditions is more likely to be satisfied. However, if the regions are not homogeneous, then the non-homogeneity measure values become high and also, the values are further enhanced by the multiplicative factor, the size of the region; hence, both these conditions are not satisfied.
Contributor Information
K. Santle Camilus, Phone: +91-989-5035995, FAX: +91-495-2287250, Email: camilus@nitc.ac.in.
V. K. Govindan, Email: vkg@nitc.ac.in
P. S. Sathidevi, Email: sathi@nitc.ac.in
References
- 1.Cancer facts and figures 2005. Atlanta: American Cancer Society; 2005. [Google Scholar]
- 2.Eklund GW, Cardenosa G, Parsons W. Assessing adequacy of mammographic image quality. Radiology. 1994;190(2):297–307. doi: 10.1148/radiology.190.2.8284372. [DOI] [PubMed] [Google Scholar]
- 3.Zhou C, Hadjiiski LM, Paramagul C, Sahiner B, Chan H-P, Wei J. Computerized pectoral muscle identification on MLO-view mammograms for CAD applications. Proc of the SPIE. 2005;5747:852–857. doi: 10.1117/12.595693. [DOI] [Google Scholar]
- 4.Kwok SM, Chandrasekhar R, Attikiouzel Y, Rickard MT. Automatic pectoral muscle segmentation on mediolateral oblique view mammograms. IEEE Trans Med Imaging. 2004;23(9):1129–1140. doi: 10.1109/TMI.2004.830529. [DOI] [PubMed] [Google Scholar]
- 5.Ferrari RJ, Rangayyan RM, Desautels JEL, Borges RA, Frère AF. Automatic identification of the pectoral muscle in mammograms. IEEE Trans Med Imaging. 2004;23(2):232–245. doi: 10.1109/TMI.2003.823062. [DOI] [PubMed] [Google Scholar]
- 6.Suckling J, Dance DR, Moskovic E, Lewis DJ, Blacker SG. Segmentation of mammograms using multiple linked self-organizing neural networks. Med Phys. 1995;22(2):145–152. doi: 10.1118/1.597464. [DOI] [PubMed] [Google Scholar]
- 7.Masek M, Chandrasekhar R, Desilva CJS, and Attikiouzel Y: Spatially based application of the minimum cross-entropy thresholding algorithm to segment the pectoral muscle in mammograms, The Seventh Australian and New Zealand Intelligent Information Systems Conference, Nov. 18–21. 101–106, 2001
- 8.Brink AD, Pendock NE. Minimum cross entropy threshold selection. Pattern Recogn. 1996;27(1):179–188. doi: 10.1016/0031-3203(95)00066-6. [DOI] [Google Scholar]
- 9.Kwok SM, Chandrasekhar R, and Attikiouzel Y: Automatic pectoral muscle segmentation on mammograms by straight line estimation and cliff detection. The Seventh Australian New Zealand Intelligent information Systems Conference, Perth, Western Australia, Nov. 18–21. 2001
- 10.Karssemeijer N. Automated classification of parenchymal patterns in mammograms. Phys Med Biol. 1998;43(2):365–378. doi: 10.1088/0031-9155/43/2/011. [DOI] [PubMed] [Google Scholar]
- 11.Ferrari RJ, Rangayyan RM, Desautels JEL, and Frere AF: Segmentation of mammograms: Identification of the skin-air boundary, pectoral muscle, and fibro-glandular disc. In IWDM 2000: Proc. 5th Int. Workshop Digital Mammography. 573–579, June 2001
- 12.Yam M, Brady M, Highnam R, Behrenbruch C, English R, Kita Y. Three-dimensional reconstruction of microcalcification clusters from two mammographic views. IEEE Trans Med Imaging. 2001;20:479–489. doi: 10.1109/42.929614. [DOI] [PubMed] [Google Scholar]
- 13.Aylward SR, Hemminger BM, Pisano ED. Mixture modeling for digital mammogram display and analysis. In Digital Mammography. Comput Imaging Vis. 1998;13:305–312. [Google Scholar]
- 14.Weidong X, and Shunren X: A model based algorithm to segment the pectoral muscle in mammograms. IEEE Int. Conf. Neural Networks & Signal Processing, Nanjing, China, Dec.14–17. 1163–1169, 2003
- 15.Raba D, Oliver A, Martí J, Peracaula M, Espunya J. Breast segmentation with pectoral muscle suppression on digital mammograms. Lect Notes Comp Sci. 2005;3523:471–478. [Google Scholar]
- 16.Bajger M, Ma F, Bottema MJ: Minimum spanning trees and active contours for identification of the pectoral muscle in screening mammograms. Digital Image Computing: Techniques and Applications conference. 47–53, 2005
- 17.Ma F, Bajger M, Bottema MJ: Extracting the pectoral muscle in screening mammograms using a graph pyramid. APRS workshop on digital image computing, University of Queensland. 39–42, 2005
- 18.Ma F, Bajger M, Slavotinek JP, Bottema MJ. Two graph theory based methods for identifying the pectoral muscle in mammograms. Pattern Recogn. 2007;40:2592–2602. doi: 10.1016/j.patcog.2006.12.011. [DOI] [Google Scholar]
- 19.Bassett LW, Hirbawi IA, Debruhl N, Hayes MK. Mammographic positioning: Evaluation from the view box. Radiology. 1993;188:803–806. doi: 10.1148/radiology.188.3.8351351. [DOI] [PubMed] [Google Scholar]
- 20.Chandrasekhar R, Kwok SM, and Attikiouzel Y: Automatic evaluation of mammographic adequacy and quality on the mediolateral oblique view. In Digital Mammography: IWDM 2002: Proc. 6th Int. Workshop Digital Mammography, Bremen, Germany, June 22–25. 182–186, 2002
- 21.Tucker AB. Computer science handbook. 2. Boca Raton: CRC; 2004. [Google Scholar]
- 22.Suckling J, Parker J, Dance DR, Astley S, Hutt I, Boggis CRM, Ricketts I, Stamatakis E, Cerneaz N, Kok SL, Taylor P, Betal D, Savage J. The Mammographic Image Analysis Society Digital Mammogram Database. Excerpta Medica International Congress Series. 1994;1069:375–378. [Google Scholar]
- 23.Cormen TH, Leiserson CE, Rivest RL, Stein C. Introduction to algorithms. 2. Boston: MIT; 2001. [Google Scholar]
- 24.Loudon K. Mastering algorithms with C. Sebastopol: O'Reilly; 1999. [Google Scholar]


