Abstract
Recently, several types of post-processing image filter which was designed to reduce noise allowing a corresponding dose reduction in CT images have been proposed and these were reported to be useful for noise reduction of CT images of adult patients. However, these have not been reported on adaptation for pediatric patients. Because they are not very effective with small (<20 cm) display fields of view, they could not be used for pediatric (e.g., premature babies and infants) body CT images. In order to solve this restriction, we have developed a new noise reduction filter algorithm which can be applicable for pediatric body CT images. This algorithm is based on a three-dimensional post processing, in which output pixel values are calculated by multi-directional, one-dimensional median filters on original volumetric datasets. The processed directions were selected except in in-plane (axial plane) direction, and consequently the in-plane spatial resolution was not affected by the filter. Also, in other directions, the spatial resolutions including slice thickness were almost maintained due to a characteristic of non-linear filtering of the median filter. From the results of phantom studies, the proposed algorithm could reduce standard deviation values as a noise index by up to 30% without affecting the spatial resolution of all directions, and therefore, contrast-to-noise ratio was improved by up to 30%. This newly developed filter algorithm will be useful for the diagnosis and radiation dose reduction of pediatric body CT images.
Key words: Computed tomography (CT), pediatric, noise reduction, image processing, radiation dose, spatial resolution
Introduction
Due to technical advances in multidetector computed tomography (MDCT), such as much higher table speed, higher rotation speed, and thinner slices, it has become possible to scan a wide range with a thin slice thickness during a single breath-hold and also to scan the same anatomical region repeatedly at short intervals. Such techniques have yielded higher image quality and improved the ability of diagnosis in CT examinations.1,2 In infants and children, high image quality has also been obtained and this has given established and invaluable image information for evaluation of different disorders.3 Therefore, this has led to an increase in the number of CT examinations. Although many technologies for CT have been improved, the radiation dose has not yet been reduced substantially. Indeed, the radiation dose has increased more by acquiring high-quality volume data with thin slice thickness. The radiation dose in CT examinations remains a major concern, especially in pediatric patients, because of the potential carcinogenic effects of relatively low levels of ionizing radiation exposure.4–6 In the future, the collective medical radiation dose in the pediatric population will increase with increases in the number of CT examinations. Therefore, to reduce the exposure dose, the introduction of effective de-noising image filters, which permit the exposure dose to be minimized, is very important, and realization of such filters is required in practical clinical fields.
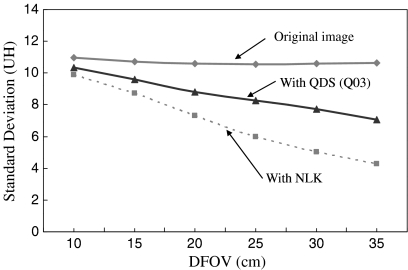
Recently, several types of post-processing image filter, which was designed to reduce noise allowing a corresponding dose reduction in CT images, have been proposed, and it was reported that these were useful for noise reduction in CT images of adult patients.7,9–12 However, these have not been reported on adaptation for pediatric patients. For example, a filter algorithm proposed in Ref. 7 is weighted local averaging based on neighbor linking (NLK) which was aimed to selectively reduce image noise in low-contrast regions preserving high-contrast regions, and a filter processing application provided with commercially available CT systems by Toshiba called “Quantum Denoising Software (QDS)” is currently utilized in actual CT examinations.10,11 QDS is an adaptive noise reduction filter that works on reconstructed image data by preferentially smoothing areas with uniform density while preserving the edge information of the image. Figure 1 shows the noise reduction performance with NLK and QDS. The results showed changes in amounts of noise calculated by standard deviation value (SD) against the display FOV (DFOV) size for image of a cylindrical uniformity phantom with a diameter of 20 cm. The images with different DFOV size were reconstructed from the same raw data of the phantom. It was clear that both NLK and QDS were not effective in small-diameter DFOV of less than approximately 15 cm. Because they are not very effective with small (<15 cm) display fields of view (DFOV), they could not be used for pediatric (e.g., premature babies and infants) body CT images.
Fig 1.
Graph showing the standard deviation (SD) values in original images and images processed with the Quantum Denoising Software (QDS) and weighted local averaging based on neighbor linking (NLK). QDS is implemented in current CT systems by Toshiba, and NLK was proposed in Ref. 7. Q03 for QDS is a parameter for pediatric body exclusive use. The QDS and NLK process is not effective in small (<15 cm) display FOV (DFOV) corresponding to the pediatric body.
The present study was performed to develop a new noise reduction filter algorithm to enable dose reduction in pediatric CT images with small DFOV. This algorithm was based on three-dimensional (3D) post-processing using a specific combination of multidirectional one-dimensional (1D) median filters. We processed images obtained with a performance test phantom using the developed algorithm, and evaluated the basic physical performance of our algorithm. The effectiveness of clinical pediatric body CT images of several clinical cases was then evaluated by quantitative analysis and visual evaluation.
Materials and Methods
Properties of Nominal Median Filter and Review of Median-Based Method
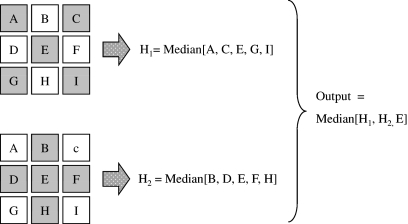
Representative post-processing noise reduction filters are classified as linear and non-linear types, and these can be adapted for CT images.7 Noise in CT images is primarily due to quantum noise inherent in photon detection and electronic noise,8 and the noise contains a broad range of frequency components. Therefore, simple linear type noise reduction filters, such as some types of averaging filter,13 are effective because the high-frequency components can be reduced by the filter. However, such averaging filters provide smoothing effects not only on noise elements but also on the edges of anatomical structures that consist of high-frequency signals. As a result, the image suffers from blurring caused by unclear edges. Median filter is the best-known non-linear filter based on order statistics.8,14,15 It operates in a manner similar to the averaging filter except that each target pixel is replaced by the median rather than the average of pixels in the analysis window. The median filter is commonly used due to its better ability to preserve edges than averaging filters, while still effectively reducing noise. That is, the median filter can operate effectively on the images to maintain the resolution in regions near the edges. However, the median filter is not always effective for reducing image noise, depending on the properties of the original images, such as the resolution and amount of noise. Nodes and Gallagher reported that the resolution (or texture) of original images was smeared by median filters.15 Figure 2 shows an original image of a resolution test phantom and images processed by two different median filter processing techniques. As shown in Figure 2b, a simple two-dimensional (2D) median filter resulted in significant reduction of the resolution. These defects led to the development of the hybrid median filter, which is a multiple-step pixel value-ranking algorithm.16,17 The details of hybrid median filter algorithm are shown in Figure 3. This filter calculates three values for a target pixel, which consisted of two median values (H1 and H2) from two different arrangements with “x” and “+”shape in five neighbor pixels centered on the target pixel and the pixel value of the target pixel itself. The output value for the target pixel is the median value calculated from these three values. Although the processed image with the hybrid median filter could reduce the negative influence of the simple median filter on the spatial resolution (Fig. 2c, white arrowheads), the spatial resolution was inferior to that of the original image.
Fig 2.
Comparison of an original image (a) and processed images (b, c) by two different median filters. The original image with DFOV of 30 cm was obtained using a spatial resolution phantom (Catphan CTP-528). The original image was processed by a simple 2D median filter (b) with a 3 × 3 pixel mask composition and a 2D hybrid median filter (c). The SD values of the background were 5.04 HU (a), 3.04 HU (b), and 3.82 HU (c).
Fig 3.
A 3 × 3 pixel set and calculation procedure for obtaining output value for the 2D hybrid median filter algorithm. One median value H1 is calculated from five neighbor pixels forming an “x” shape (A, C, E, G, I), and another median value H2 is calculated from neighbor pixels forming a “+” shape (B, D, E, F, H). The output value is calculated by the median of H1, H2, and E.
We developed a new algorithm that employs many more arrangements across the target pixel than the hybrid median filter and a new calculation between the values from the arrangements to preserve the spatial resolution of original images. The filter could mostly maintain the spatial resolution, while achieving improved noise reduction. The details of the new algorithm are described in the next section.
New Filter Algorithm
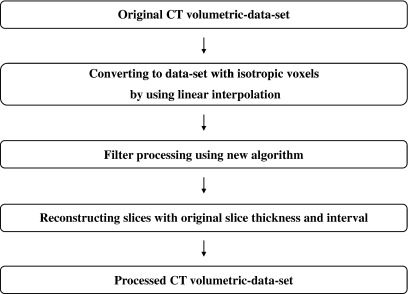
Riederer and Harpen reported that noise in CT images results mainly from the Poisson distribution of photon statistics.18,19 Thus, the image noise patterns differ between slice images in z-direction, because the noise is randomly distributed in spatial position. On the other hand, human organs have relatively large structures as compared with thin slice thickness and small slice interval provided by recent MDCT. We have exploited this property, and have developed a new three-dimensional filter algorithm that can utilize CT volumetric datasets efficiently for pediatric body images. Our new algorithm of the noise reduction filter is based on a 3D median filter using a 3 × 3 × 3 voxel mask. The output values from this algorithm are calculated by weighted averaging of 1D median values along various 3D directions centered the target voxel. Figure 4 shows an outline of the image processing procedure using the new algorithm. First, isotropic volume data were created from an original CT volumetric dataset by linear interpolation. Second, filter processing by the new algorithm was applied to these isotropic data. Finally, the slice interval and slice thickness of the original image were recovered by an appropriate sampling interval and averaging in the z-direction.
Fig 4.
Outline of the image processing procedure using the new algorithm.
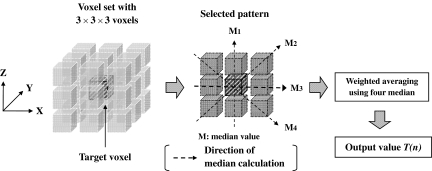
The following section describes the details of filter processing for each target voxel. The voxel mask for each target voxel consisted of the target voxel and 26 neighboring voxels. As shown in Figure 5, in a selected 3 × 3 voxel plane (pattern) centered on the target voxel, four-direction median values (M1, M2, M3, M4) were calculated from the pattern and then an output value T(n) (n = pattern number) for the pattern was calculated by the following equation:
 |
1 |
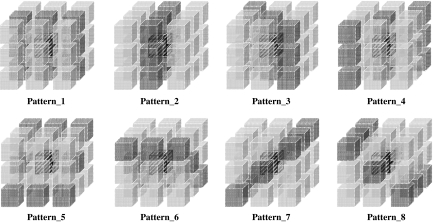
where Mmin and Mmax are minimal and maximal values in the four medians values, respectively, and Mother1 and Mother2 denote the other two median values. The weighting factors in Eq. (1) were chosen from various settings in our preliminary studies to obtain the best performance between noise reduction and preservation of spatial resolution. The eight selected patterns shown in Figure 6 were used in the algorithm, and the final output values corresponding to the target voxel were obtained by averaging of the eight T(n) values calculated from the respective patterns. Note that we deselected only the x–y plane in selecting patterns to preserve the spatial resolution of the x–y plane as far as possible.
Fig 5.
A 3 × 3 × 3 voxel set and calculation procedure for obtaining output value for a selected pattern in the voxel set. The output values were calculated for the eight patterns shown in Figure 6.
Fig 6.
The eight patterns employed for calculating an output value corresponding to a target voxel. The final output value was obtained by averaging the eight temporal values from these patterns.
Measurement of the SD Value and Noise Power Spectrum (NPS)
Using the image uniformity module of a Catphan phantom (CTP-500; Phantom Laboratory, Salem, NY, USA), we evaluated the SD and noise power spectrum (NPS) of the images processed with and without the proposed algorithm. A CT scanner (Asteion super 4; Toshiba Medical Systems, Tokyo, Japan) was employed for the evaluation. The scan was performed at 120 kV, 187 mA s, beam pitch of 0.938, scan FOV (SFOV) of 400 mm, slice thickness and interval of 2.0 mm, detector configuration of 2.0 mm, and reconstruction filter algorithm of FC10. We assessed the SD and NPS in various sizes of DFOVs (10, 15, 20, 25, 30, and 35 cm) from the same raw data for the slice of CTP-500. The averaged SD values were obtained from six SD values of rectangular regions of interest (ROI) with 40 × 256 pixels at different locations in the y-direction. The NPS were calculated by fast Fourier transform (FFT) of a one-dimensional noise profile with 256 data obtained by numerical slit (1 × 20 pixels) scanning in the x-direction. The final NPS result for one image was obtained by averaging ten NPS results at different y-locations.20
Measurement of the Contrast-to-Noise Ratio (CNR)
Using the low-contrast module with 2.0% contrast (CTP-401 module) in the Catphan phantom, we evaluated the CNR of the images processed with and without the proposed algorithm. The CT scanner used was a Bright Speed Elite 16 (GE Healthcare, Hino, Japan). The CNR were calculated as follows: (ROIo − ROIb) / SDb, where ROIo and ROIb are the CT values of the low-contrast object with diameter of 10 mm and background ROI and SDb is the SD of the background.21 The scan parameters were 120 kV, 180 mA s, beam pitch of 0.938, SFOV of 500 mm, slice thickness and interval of 1.25 mm, DFOV of 10 cm, detector configuration of 1.25 mm, and reconstruction filter algorithm of Standard.
Effect on Spatial Resolution
Using a high-contrast resolution module (CTP-528) in the Catphan phantom, we compared maximal distinguishable spatial frequency of the original and processed images. Most of post-processing non-linear filter algorithms for noise reduction are aimed to selectively reduce image noise of low-contrast regions, and simultaneously preserve the high-contrast regions. This is because high-frequency reduction is inevitable in the noise reduction processing and the high-frequency reduction in the low-contrast regions can be accepted by observers on average. From these view points, we considered that the high-contrast phantom was effective for our algorithm to evaluate the high-frequency preservation. The scan was performed at 120 kV, 180 mA s, beam pitch of 0.938, SFOV of 500 mm, slice thickness of 1.25 mm, DFOV of 10 cm, detector configuration of 1.25 mm and reconstruction filter algorithm of Standard. The CT scanner used was Bright Speed Elite 16.
Measurement of the Profile Curve of z-axis
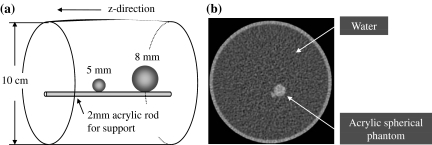
We evaluated the performance of edge preservation in the proposed algorithm by testing edge intensity and edge profile in the z-direction using two acrylic spherical phantoms 5 and 8 mm in diameter placed into the water (Fig. 7). The respective CT values of the two objects were both about 120 HU. The areas of the ROI were set to 4 and 12 mm2 for 5 and 8 mm spheres, respectively. For quantitative evaluation for the edge profiles, we examined the full width at half maximum (FWHM) values of the respective profiles. The phantom was scanned with parameters of 120 kV, 8 mA s, beam pitch of 0.938, SFOV of 500 mm, slice thickness and interval of 1.25 mm, DFOV of 10 cm, detector configuration of 1.25 mm, and reconstruction filter algorithm of Standard. The CT scanner used was Bright Speed Elite 16.
Fig 7.
Design of acrylic spherical phantom for evaluating edge preservation performance in the z-direction. a Design illustration. b Axial image of the phantom.
Evaluation of Clinical Abdomen and Lung Images
We evaluated the efficacy of the proposed algorithm in three clinical cases in infants. The images for all cases were obtained with the Bright Speed Elite 16 CT scanner.
Case 1 was a 2-week-old boy, and abdominal images and lung contrast-enhanced images were obtained at arterial phase. The images were obtained with scanning parameters of 120 kV, 45 mA s, beam pitch of 1.375, SFOV of 500 mm, slice thickness and interval of 1.25 mm, DFOV of 12 cm, detector configuration of 1.25 mm, and reconstruction filter algorithm of Standard.
Case 2 was a 4-month-old boy, and abdominal contrast-enhanced images were obtained in portal phase. The scan parameters were 120 kV, 80 mA s, beam pitch of 1.375, SFOV of 500 mm, slice thickness and interval of 1.25 mm, DFOV of 16 cm, detector configuration of 1.25 mm, and reconstruction filter algorithm of Standard.
Case 3 was an abdominal non-enhanced image from an 18-month-old boy. With this case, to examine the efficacy of the proposed algorithm for dose-reduced images, we created a simulated 30% dose-reduced image by using dedicated reconstruction software from GE Healthcare. The software achieves conversion from an original image to a simulated dose reduction image by raw-data attenuation and addition of Gaussian noise. The advantage of using this software was that the dose-reduced images were obtained without exposing the patient twice (scanning). The image was obtained with scanning parameters of 120 kV, 95 mA s, beam pitch of 1.375, SFOV of 500 mm, slice thickness and interval of 1.25 mm, DFOV of 18 cm, detector configuration of 1.25 mm, and reconstruction filter algorithm of Standard. We processed the simulated dose reduction image using the proposed algorithm, and compared the processed image with the original image.
Evaluations of physical measurements (SD value and/or CNR) and visual image observation were made to compare the original images with the processed images for respective cases.
Visual Evaluation of Clinical Abdomen Images
Clinical images of five patients were visually evaluated by comparing their original images with processed images, according to visibility of the peripheral branches of the portal vein. Table 1 represents the sex and ages of the patients, respective scan, and reconstruction parameters. The comparison was based on the rating system developed by Tanikake et al.22 and Uchida et al.23
Table 1.
Patients’ Data and Respective Scan and Reconstruction Parameters for the Visual Comparative Evaluation Using Clinical Abdomen Images
| Data | Patient 1 | Patient 2 | Patient 3 | Patient 4 | Patient 5 |
|---|---|---|---|---|---|
| Sex (M/F) | M | M | M | M | M |
| Age | 11 months | 12 months | 4 months | 2 weeks | 11 months |
| Slice thickness / interval (mm) | 2.5 / 2.5 | 1.25 / 1.25 | 1.25 / 1.25 | 1.25 / 1.25 | 1.25 / 1.25 |
| DFOV (cm) | 19 | 18 | 16 | 12 | 20 |
| kV | 120 | 120 | 120 | 120 | 120 |
| Tube current (mA) | 99 | 99 | 134 | 89 | 79 |
| Rotation speed (s) | 0.5 | 0.5 | 0.6 | 0.5 | 0.5 |
| Convolution filter algorithm | Standard | Standard | Standard | Standard | Standard |
The visibility of each object was graded on a four-level scale by each observer: grade 3.0 was assigned when the sub-subsegmental level of peripheral branches was visible, providing very useful information prior to interventional radiology; grade 2.0 was assigned when the sub-subsegmental level was not visible and all of the subsegmental portal vein branches were visible; grade 1.0 was assigned when some of the subsegmental portal vein branches were not visible and grade 0 was assigned when all of the subsegmental portal vein branches were not visible. The evaluation was performed by five radiologists with 7–15 years’ experience, who had not been given any information about the patients. The observers read 100 images per one patient (original image set with 50 continuous images and its processed images). The averaged scores for the original and processed images were calculated, and the statistical comparison between the two groups was performed by using Wilcoxon signed-rank test (SPSS ver. 11.5 J; SPSS Japan Inc., Tokyo, Japan).
Results
SD Values and NPS
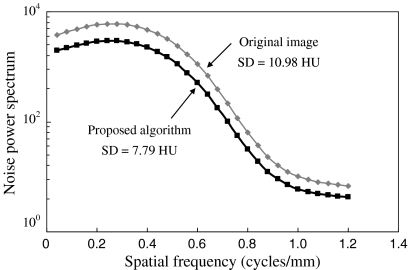
Table 2 shows the SD values in the original images, images processed with QDS, images processed with NLK and images processed with the proposed algorithm. The SD value was reduced by approximately 30% by the proposed algorithm, and was effective in all DFOV. Figure 8 shows the NPS in the original image and image processed with the proposed algorithm with DFOV of 10 cm. The NPS was reduced in all spatial frequency as compared with that of the original image.
Table 2.
Comparison of SD of Original Image and Image Processed by the QDS, the NLK and the Proposed Algorithm for Various DFOV
| Standard deviation (HU) | ||||
|---|---|---|---|---|
| DFOV (cm) algorithm | Original image | QDS | NLK | Proposed |
| 10 | 10.98 | 10.34 | 9.91 | 7.79 |
| 15 | 10.70 | 9.60 | 8.74 | 7.53 |
| 20 | 10.57 | 8.80 | 7.32 | 7.32 |
| 25 | 10.53 | 8.28 | 5.97 | 7.10 |
| 30 | 10.59 | 7.74 | 5.04 | 7.05 |
| 35 | 10.64 | 7.08 | 4.29 | 7.06 |
Fig 8.
SD values and NPS in original images and images processed with the proposed algorithm.
CNR
The results of CNR measurement in the original images and the images processed with the proposed algorithm were 1.98 and 2.79, respectively. The CNR value was improved up to approximately 30% by the proposed algorithm. The contrast values of the original image and the processed image were 23.34 HU and 22.82 HU, respectively. The CT value of original image was not affected by the proposed algorithm.
Spatial Resolution
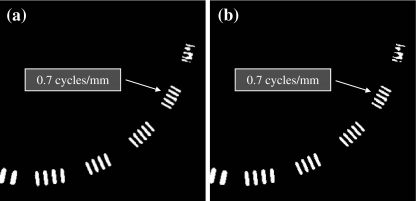
Figure 9 shows a comparison of the spatial resolution images. As shown in the figure, the maximum distinguishable frequency of 0.7 cycles/mm for the original image was not changed by the proposed algorithm.
Fig 9.
Comparison of the spatial resolution images. a Original image. b Image processed with the proposed algorithm.
Profile Curve of the z-axis
Figure 10 shows the z-directional profile curves of the spherical objects with diameters of 5 and 8 mm for the original images and the processed images. The profile curves of the original images and processed images were almost equivalent. Resultant FWHM values for the original images were 5.44 and 8.11 mm for 5 and 8 mm spheres, respectively. FWHM values for processed images were 5.45 and 8.08 mm, respectively. The FWHM values for the two spheres were not mostly affected by the proposed algorithm.
Fig 10.
Comparison of z-direction profiles across the spherical objects with sizes of a 5 and b 8 mm.
Clinical Cases
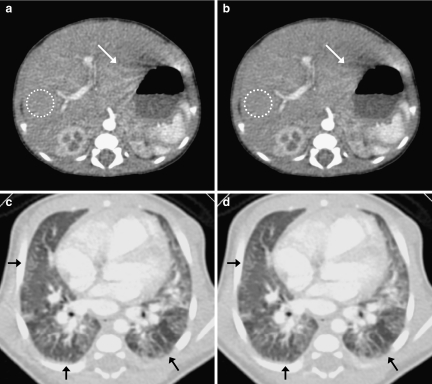
Figure 11 shows a comparison of the original and processed images for case 1. The SD values of ROI in the liver (white circles) were (a) 8.58 HU and (b) 6.67 HU, respectively. With the proposed algorithm, the noise was reduced significantly, and an artifact appearing near the stomach edge was reduced (white arrows). As evidence of edge preservation, the peripheral structures in the lung image were maintained (black arrows).
Fig 11.
Results of clinical case 1. a, c Original images. b, d Image processed with the proposed algorithm.
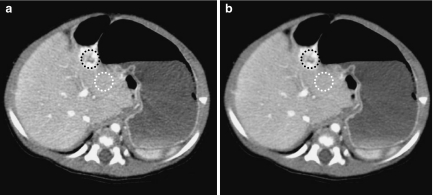
Figure 12 shows a comparison of images for case 2. The mean CT values in an enhanced lesion (black circles) were (a) 128.83 HU in the original image and (b) 129.11 HU in the processed image. The mean CT values and SD values of a ROI in the liver (white circles) were (a) 111.12 HU, 9.85 HU and (b) 110.88 HU, 7.13 HU, respectively. The CNR values calculated from ROI at an enhanced lesion and background ROI in the liver were (a) 1.80 and (b) 2.56. The CNR value was significantly improved by the proposed algorithm.
Fig 12.
Comparison of original and processed images for clinical case 2. a Original image. b Image processed with the proposed algorithm.
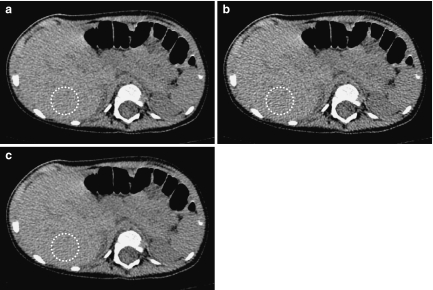
Figure 13 shows a comparison of an original image, the simulated 30% dose-reduced image, and the processed image of the simulated dose reduction image for case 3. The SD values in the liver (white circles) were (a) 18.98 HU in the original image, (b) 23.24 HU in the simulated 30% dose-reduced image, and (c) 19.06 HU in the simulated 30% dose-reduced image processed with proposed algorithm. With the proposed algorithm, we found that the appearance of the processed image became equivalent to that of the original image.
Fig 13.
Comparison of original image, simulated 30% dose-reduced image, and processed simulated image for clinical case 3. a Original image. b Simulated 30% dose reduction image. c Processed image of the dose reduction image.
Visual Evaluation of Clinical Abdomen Images
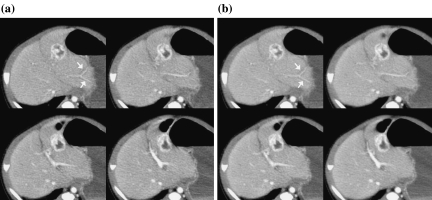
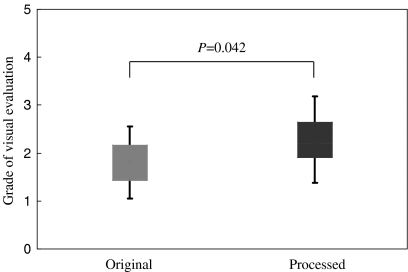
The results of the visual evaluation of the peripheral portal vein branches in clinical abdomen images are summarized in Table 3. The visibility of the portal vein was clearly improved by the proposed algorithm (Fig. 14). The averaged scores of the processed images for all patients were higher than those of the original images. There was significant difference between the results of two groups (P = 0.042) (Fig. 15).
Table 3.
Results of the Visual Evaluation of the Peripheral Portal Vein Branches in Clinical Abdomen Images
| Averaged score | ||
|---|---|---|
| Patient no. | Original | Processed |
| Patient 1 | 2.2 ± 0.4 | 3.0 |
| Patient 2 | 1.0 | 1.4 ± 0.5 |
| Patient 3 | 2.6 ± 0.5 | 3.0 |
| Patient 4 | 2.2 ± 0.4 | 2.8 ± 0.4 |
| Patient 5 | 1.0 | 1.2 ± 0.4 |
Averaged grades for respective patients are indicated. The averaged scores of the processed images for all patients were higher than those of the original images. Value: mean ± SD
Fig 14.
a Original and b processed images for a 4-month-old boy (patient 3 in Table 3). The images are abdominal contrast-enhanced images obtained in portal vein phase. These images were rated as grade 3.0 because the sub-subsegmental level of the peripheral portal vein branches are clearly depicted (white arrows).
Fig 15.
Results of the statistical comparison between the original and processed images. There was significant difference between the results of two groups (P = 0.042).
Discussion
The proposed algorithm was assessed by physical evaluation using phantoms and clinical images, and visual evaluation of the clinical images. Using the algorithm, the SD values could be reduced by approximately 30%, and the NPS was reduced in all spatial frequencies, as compared with the original image. The unchanged the maximum distinguishable frequency on the resolution phantom image showed that the x–y spatial resolution of the processed image was almost loss-free. We utilized the 3D isotropic data with 3 × 3 × 3 voxels rather than only 2D (slice) data that were employed in the QDS and the hybrid median filter. Therefore, we were concerned about the broadening of the slice profile. However, the mostly unchanged z-profiles and FWHM values showed that the proposed algorithm did not affect the spatial resolution in the z-direction (slice thickness). Okumura et al. reported that the QDS decreased the NPS only at high spatial frequencies,10 and according to our measurement results for the QDS, the reduction of SD values in small DFOV was less than 6% (original image = 10.98 HU; image processed with QDS = 10.34 HU). In addition, the NLK algorithm was also not effective to small DFOV (original image = 10.98 HU; image processed with NLK = 9.91 HU).
In contrast, our algorithm realized the noise reduction over a wide frequency range and the effectiveness for small DFOV, and these clearly indicated that the algorithm had advantages over the QDS and the NLK, in that the algorithm would be effective for lesions of various sizes.
We considered that the main reason for this improvement was that our algorithm used multidirectional median filtering centered on the target voxel and excluded directions in the axial plane from the median calculations. It was suggested that the four 1D median calculations in a pattern (plane with 3 × 3 voxels) and their integration worked to effectively derive the features of the median filtering (noise reduction and edge preservation), and the averaging over the eight selected patterns in the 3D isotropic data contributed to intensify the noise reduction preserving the edge. The NPS improvement and the preservation of the spatial resolution and slice thickness led directly to improvement (approximately 30%) of the signal-to-noise ratio, which was confirmed by the CNR values. These findings suggest that the proposed algorithm can improve the detectability of low-contrast lesions in clinical images such as subtle lesions in liver images. That is, these results indicated that the proposed algorithm will be able to decrease the dose without changing the image quality.
In clinical case 1, the amount of noise was significantly reduced without any change in the edge appearance at the borders of the respective organs. Therefore, the visibility of vessel shapes and other low-contrast structures showed obvious improvement. Clinical case 2 was effective to demonstrate the improvement of image quality by the algorithm, and the CNR values calculated from the images supported the improvement. In clinical case 3, the quality of the processed simulated dose reduction image became equivalent to that of the original image. This indicated that the algorithm worked properly to reduce X-ray photon noise itself because the noise in the dose reduction image was generated by theoretical and basic simulation of dose reduction. The SD value reduction rates of the case 1, 2, and 3 were 22%, 28%, and 18%, respectively. Since, in the case 3, the SD value of the simulated 30% dose-reduced image was restored to that of the original image, these results suggested that the proposed algorithm can reduce radiation dose at least 30% for pediatric CT examination. The images of all cases were acquired by average exposure parameters used in many clinical settings. Therefore, we considered that the SD value reduction obtained in this study were practical. However, since the possible dose reduction rate depends on patient’s size, convolution kernel, tube voltage, etc., we need to further investigation using more clinical cases.
The visibility of the portal vein was improved between original images and images processed with our filter algorithm in all cases. The statistical comparisons results of the two groups differences were statistically significant at P = 0.042.
Laurence et al. evaluated the noise reduction effect and maintenance of resolution using various types of linear and non-linear image filter, and reported that applying non-linear filters on CT images may improve the quality of CT images better than using current linear filters.7 Michelle and Cheryl applied seven types of image filter and three types of pixel mask (3 × 3, 5 × 5 and 7 × 7) to the images with DFOV of 40 cm, and reported that they were effective in reduction of radiation dose of CT images8. However, they also described the necessity of further evaluation of appropriate conditions because the spatial resolution was decreased by these image filters.7,8 In contrast, the proposed algorithm was excellent in that it could be applied to small DFOV and did not affect the spatial resolution and slice thickness. These features would yield a successful effect in improving image quality or decreasing radiation dose given to pediatric patients.
The proposed algorithm consisted of only linear slice interpolation, median calculation, and weighted averaging, and thus its computational load was not heavy for modern computers. In fact, the actual calculation times of 200 images with a slice thickness of 1.25 mm and DFOV of 10 cm were about 150 s on a 2.4 GHz Intel Core 2 Duo processor. Therefore, we considered that the algorithm will be able to be implemented easily on modern computers and will be effective in practical application for CT dose reduction.
Conclusions
We have developed a 3D noise reduction filter algorithm that can be effectively adapted to pediatric body CT images, and evaluated this algorithm in detail. The results of phantom studies indicated that the proposed algorithm could reduce SD by approximately 30% without affecting the spatial resolution of not only the x–y plane but also the z-direction. Therefore, the algorithm improved the CNR by approximately 30%, and the low-contrast visibility was improved markedly even when the display DFOV was small. In clinical images, the radiation dose could be reduced by 30% without affecting the sharpness of small structures as well as in the phantom studies. We concluded that this newly developed filter algorithm will be effective for more accurate diagnosis and radiation dose reduction of pediatric body CT images.
References
- 1.Flohr TG, Schaller S, Stierstorfer K, Bruder H, Ohnesorge BM, Schoepf UJ. Multi-detector row CT systems and image reconstruction techniques. Radiology. 2005;235:756–773. doi: 10.1148/radiol.2353040037. [DOI] [PubMed] [Google Scholar]
- 2.Puqliese F, Weustink AC, Van Mieqhem C, Alberghina F, Otsuka M, Meijboom WB, Van Pelt N, Mollet NR, Cademartiri F, Krestin GP, Hunink MG, de Feyter PJ: Dual-source coronary computed tomography angiography for detecting in-stent restenosis. Heart Sep 19, 2007 [DOI] [PubMed]
- 3.Frush DP, Donnelly LF. Helical CT in children: technical considerations and body applications. Radiology. 1998;209:37–48. doi: 10.1148/radiology.209.1.9769810. [DOI] [PubMed] [Google Scholar]
- 4.Brenner DJ. Estimating cancer risks from the pediatric CT: going from the qualitative to the quantitative. Pediatr Radiol. 2002;32:228–231. doi: 10.1007/s00247-002-0671-1. [DOI] [PubMed] [Google Scholar]
- 5.Brenner DJ, Elliston CD, Hall EJ, Berdon WE. Estimates of the cancer risks from pediatric CT radiation are not merely theoretical. Comment on point/counterpoint: in X-ray computed tomography, technique factors should be selected appropriate to patient size against the proposition (letter) Med Phys. 2001;28:2387–2388. doi: 10.1118/1.1415074. [DOI] [PubMed] [Google Scholar]
- 6.Brody AS, Frush DP, Huda W, Robelt LB. Radiation risk to children from computed tomography. Pediatrics. 2007;120:677–682. doi: 10.1542/peds.2007-1910. [DOI] [PubMed] [Google Scholar]
- 7.Laurence K, Yair S, Solange A. Nonlinear filters applied on computerized axial tomography: theory and phantom images. Med Phys. 1992;19(4):1057–1064. doi: 10.1118/1.596824. [DOI] [PubMed] [Google Scholar]
- 8.Michelle H, Cheryl D. Image filtering for improved dose resolution in CT polymer gel dosimetry. Med Phys. 2004;31:39–49. doi: 10.1118/1.1633106. [DOI] [PubMed] [Google Scholar]
- 9.Kalra MK, Maher MM, Blake MA, Lucey BC, Karau K, Toth TL, Avinash G, Halpern E, Saini S. Detection and characterization of lesions on low-radiation-dose abdominal CT images postprocessed with noise reduction filters. Radiology. 2004;232:791–797. doi: 10.1148/radiol.2323031563. [DOI] [PubMed] [Google Scholar]
- 10.Okumura M, Ota T, Tsukagoshi S, Katada K. New method of evaluating edge-preserving adaptive filters for computed tomography (CT): digital phantom method. Nippon Hoshasen Gijutsu Gakkai Zasshi. 2006;62(7):971–978. doi: 10.6009/jjrt.62.971. [DOI] [PubMed] [Google Scholar]
- 11.Sasaki T, Sasaki M, Hanari T, Gakumazawa H, Noshi Y, Okumura M. Improvement in image quality of noncontrast head images in multidetector-row CT by volume helical scanning with a three-dimensional denoising filter. Radiat Med. 2007;25:368–372. doi: 10.1007/s11604-007-0145-3. [DOI] [PubMed] [Google Scholar]
- 12.Funama Y, Awai K, Miyazaki O, Nakayama Y, Goto T, Omi Y, Shimonobo T, Liu D, Yamashita Y, Hori S. Improvement of low-contrast detectability in low-dose hepatic multidetector computed tomography using a novel adaptive filter: evaluation with a computer-simulated liver including tumors. Invest Radiol. 2006;41(1):1–7. doi: 10.1097/01.rli.0000188026.20172.5d. [DOI] [PubMed] [Google Scholar]
- 13.McDonnel MJ. Box-filtering techniques. Comput Graph Image Process. 1981;17:65–70. doi: 10.1016/S0146-664X(81)80009-3. [DOI] [Google Scholar]
- 14.Itoh K, Ichioka Y, Minami T. Nearest-neighbor median filter. Appl Opt. 1988;27(16):3445–3450. doi: 10.1364/AO.27.003445. [DOI] [PubMed] [Google Scholar]
- 15.Nodes TA, Gallagher NC. The output distribution of median type filters. IEEE Trans Commun. 1984;32(5):532–541. doi: 10.1109/TCOM.1984.1096099. [DOI] [Google Scholar]
- 16.Optical Microscopy Primer, Digital Image Processing. Available at http://micro.magnet.fsu.edu/primer/java/digitalimaging/processing/medianfilter/index.html. Accessed 29 May 2008
- 17.Image J, Image Processing and Analysis in Java. Available at http://rsb.info.nih.gov/ij/plugins/hybrid2dmedian.html. Accessed 12 March 2009
- 18.Riederer SJ, Pelc NJ, Chesler DA. The noise power spectrum in computed X-ray tomography. Phys Med Biol. 1978;23(3):446–454. doi: 10.1088/0031-9155/23/3/008. [DOI] [PubMed] [Google Scholar]
- 19.Harpen MD. A computer simulation of wavelet noise reduction in computed tomography. Med Phys. 1999;26(8):1600–1606. doi: 10.1118/1.598654. [DOI] [PubMed] [Google Scholar]
- 20.Ichikawa K. Fundamentals and applications of image evaluation in digital age—image evaluation in computed tomography. Nippon Hoshasen Gijutsu Gakkai Zasshi. 2002;58(1):37–40. doi: 10.6009/jjrt.kj00003111340. [DOI] [PubMed] [Google Scholar]
- 21.Verdun FR, Denys A, Valley JF, Schnyder P, Meuli RA. Detection of low-contrast objects: experimental comparison of single- and multi-detector row CT with a phantom. Radiology. 2002;223:426–431. doi: 10.1148/radiol.2232010810. [DOI] [PubMed] [Google Scholar]
- 22.Tanikake M, Shimizu T, Narabayashi I, Matsuki M, Masuda K, Yamamoto K, Uesugi Y, Yoshikawa S. Three-dimensional CT angiography of the hepatic artery: use of multi-detector raw helical CT and a contrast agent. Radiology. 2003;227:883–889. doi: 10.1148/radiol.2273011964. [DOI] [PubMed] [Google Scholar]
- 23.Uchida M, Ishibashi M, Abe T, Nishimura H, Hayabuchi N. Three-dimensional imaging of liver tumors using helical CT during intravenous injection of contrast medium. J Comput Assist Tomogr. 1999;23:435–440. doi: 10.1097/00004728-199905000-00019. [DOI] [PubMed] [Google Scholar]


