Abstract
Intracranial aneurysms represent a significant cause of morbidity and mortality. While the risk factors for aneurysm formation are known, the detection of aneurysms remains challenging. Magnetic resonance angiography (MRA) has recently emerged as a useful non-invasive method for aneurysm detection. However, even for experienced neuroradiologists, the sensitivity to small (<5 mm) aneurysms in MRA images is poor, on the order of 30~60% in recent, large series. We describe a fully automated computer-aided detection (CAD) scheme for detecting aneurysms on 3D time-of-flight (TOF) MRA images. The scheme locates points of interest (POIs) on individual MRA datasets by combining two complementary techniques. The first technique segments the intracranial arteries automatically and finds POIs from the segmented vessels. The second technique identifies POIs directly from the raw, unsegmented image dataset. This latter technique is useful in cases of incomplete segmentation. Following a series of feature calculations, a small fraction of POIs are retained as candidate aneurysms from the collected POIs according to predetermined rules. The CAD scheme was evaluated on 287 datasets containing 147 aneurysms that were verified with digital subtraction angiography, the accepted standard of reference for aneurysm detection. For two different operating points, the CAD scheme achieved a sensitivity of 80% (71% for aneurysms less than 5 mm) with three mean false positives per case, and 95% (91% for aneurysms less than 5 mm) with nine mean false positives per case. In conclusion, the CAD scheme showed good accuracy and may have application in improving the sensitivity of aneurysm detection on MR images.
Key words: Computer-aided detection (CAD), magnetic resonance angiography (MRA), intracranial aneurysm, aneurysm detection
Introduction
Intracranial aneurysms predispose to intracranial hemorrhage and are a significant cause of morbidity and mortality. The standard of reference for intracranial aneurysm detection is digital subtraction angiography (DSA), but this technique is associated with risk of neurologic complications. Three-dimensional time-of-flight magnetic resonance angiography (3D TOF MRA hereafter referred to as MRA) has recently emerged as a useful, widely applied, non-invasive screening method for aneurysm detection. A typical MRA dataset usually contains more than 100 images, making it very time-consuming and labor-intensive for radiologists to detect aneurysms. Furthermore, small aneurysms may be missed by radiologists, especially if only traditional maximum-intensity projection (MIP) views are used1,2. This poor sensitivity results from the presence of overlapping vessels that may obscure small aneurysms on MIP images. Using only MIPs from MRA datasets, even experienced radiologists have a sensitivity to small (<5 mm) aneurysms of only 50%1,3. White et al., in the largest, recent case series,4 reported a sensitivity of only 35% for small aneurysm detection by radiologists with MRA.
To assist radiologists in detecting intracranial aneurysms from MRA, computer-aided detection (CAD) algorithms have been studied,5–7 and have demonstrated the ability to improve radiologists’ performance for detection of intracranial aneurysms on MRA8. However, prior CAD algorithms either were not fully automatic, or could not detect small or some fusiform type of aneurysms. Complete automation of CAD algorithms represents an important consideration for successful integration into the time-sensitive workflow of modern radiology practices. In addition, previous series evaluating CAD for aneurysm detection did not include DSA as a standard of reference, and thus the true accuracy of the CAD remains unknown.
We therefore aimed to formulate a new, fully automated CAD scheme that would detect aneurysms of different shapes and sizes, and to evaluate the CAD scheme on a large series of MRA datasets which had aneurysms verified by DSA.
Methods
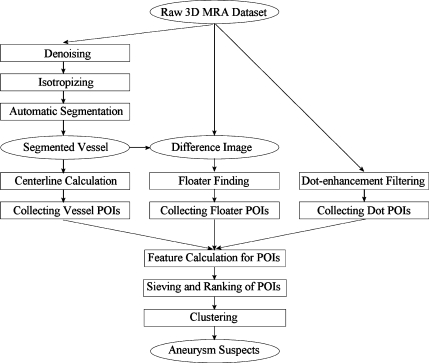
The overall workflow of our CAD scheme (Fig. 1) was as follows: First, different kinds of points of interest (POIs) were collected using multiple techniques, as described below. Second, a small set of suspicious POIs were then chosen from the whole POI set by applying a series of sieving rules. Each suspicious POI was assigned a probability score, indicating the likelihood of it representing a true aneurysm. All suspicious POIs were then ranked in descending order of probability. Finally, clusters of suspicious POIs were combined to eliminate overlapping detections. The final clustered suspicious POIs were used to generate aneurysm suspects in descending order of probability score.
Fig 1.
The flowchart of the algorithm for the CAD of aneurysms.
POI Collection
We collected initial POIs from both segmented vessels and raw images, which can be further detailed and categorized into three methods: (1) by segmenting the vessels in the raw image and collecting the POIs from the segmented vessels. The POIs collected in this way were called vessel POIs; (2) by subtracting the segmented vessels from the raw image and collecting the POIs from the difference image. The POIs collected in this way were called floater POIs; (3) by applying a dot-enhancement filter to the raw image and collecting POIs from the filtered images. The POIs collected in this way were called dot POIs.
In the first method, a mean smoothing filter was first applied to the raw 3D MRA dataset to denoise the images. The resulting 3D MRA dataset was interpolated to isotropic voxels. An automatic segmentation algorithm was then applied, resulting in a binary 3D image containing segmented arterial vessels. The automatic segmentation algorithm was based on the global thresholding and region-growing scheme. It included two core aspects—both done automatically: finding a “best” threshold, and finding a series of seed points that initiate the region-growing algorithm. The segmentation algorithm generated one single or multiple separate 3D regions, each of which represented a group of connected vessels. For each of the 3D regions, internal holes were filled first based on the contours found in each slice. Then, the centerlines of the 3D region were calculated using a 3D-thinning algorithm9. The raster representation of all the 3D-thinned vessels were then transformed into a collection of vector representations called trunks. The two ends of each trunk are either a bifurcation point or a terminal point. Along each trunk, the radius of the vessel at each trunk point was calculated based on the inner tangent sphere testing method, as described below. Trunk-level features, like length, minimum radius, maximum radius, average radius, were also calculated for every trunk.
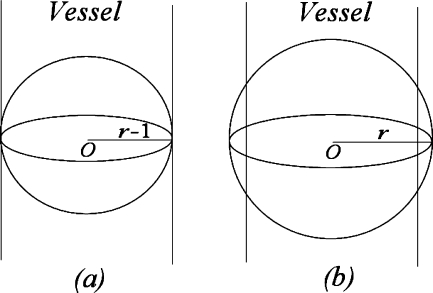
The idea of the inner tangent sphere testing method is as follows (Fig. 2): we use a series of test spheres centered at the trunk point to test the radius of the vessel at that trunk point. Ideally speaking, suppose the radius of the vessel at the trunk point is r − 1, if we use a sphere with radius not greater than r − 1, then the ratio of the overlapped volume over the volume of the sphere will be 1 (Fig. 2(a)); if the test sphere reaches radius r, this ratio will become (Fig. 2(b))
 |
1 |
Fig 2.
Inner tangent sphere testing method for vessel radius calculation. Ideally speaking, a when using a sphere with radius not greater than that of the vessel, the overlapped volume is the same as the volume of the sphere; b when using a sphere with radius greater than that of the vessel, the overlapped volume is less than the volume of the sphere.
So, to estimate the radius of a vessel at a specific trunk point, we set the radius of the test sphere, denoted by r, initially to 1, and the increment step size for r also to 1, and iteratively calculate the ratio of the overlapped volume over the volume of the sphere. If the actual ratio is less than the theoretical ratio(r), we can quantify the radius as r − 1, and stop the iteration.
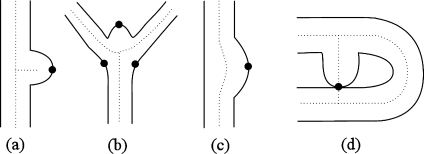
Four types of vessel POIs were then collected (Fig. 3): (a) short branch, (b) bifurcation, (c) local maximum, and (d) cyclic short trunk. Among these four types of POIs, the first three come from the surface of vessels, and the last one comes from the centerline of the vessels. All four types of POIs were obtained by analyzing features of trunks. A short branch POI is a surface point at which the extension of a short trunk intersects the vessel surface; a bifurcation POI is a surface point around a vessel bifurcation at which the extension of a bifurcation trunk intersects the vessel surface; a local maximum POI is a point on the vessel surface near which the radii of the vessel increase abnormally; a cyclic short trunk POI is a representative point on a trunk abnormally short-circuited between trunks. The representative point was chosen as the one at which the vessel was thinnest.
Fig 3.
Four types of vessel POIs.
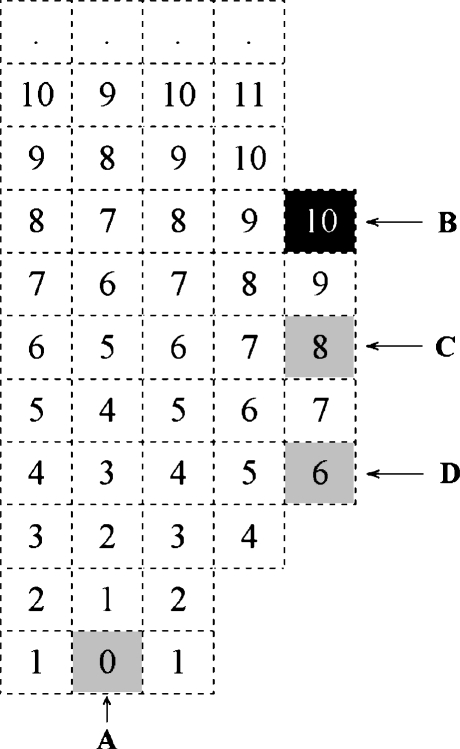
Two methods were used to detect the abnormal change in the radii of vessels: one utilized a single point-seeded DT (distance transformation) algorithm that generates a single point-seeded field (SS-field)10 in a 3D region. For each of the separated 3D regions, we generated the SS-field by choosing one of the points (voxels) with the lowest vertical (the most inferior) position as the seed point and using the <1–2–3> metric10 as the coding scheme. Any point that had a distance value not less than those of all its 26 vertex neighbors was collected as a POI. A sample result of this method applied to a 2D object is shown in Figure 4, where A is chosen as the seed, the numbers inside boxes are the SS-field, and B is a successfully collected POI.
Fig 4.
SS-field and POI collection.
We determined that even if the DT method generated many useful POIs, it still could miss useful ones. As shown in Figure 4, points C and D are potential POIs that would be useful to collect. In fact, point C is the most valuable POI amongst B, C, and D, but in this case point, C was missed. In view of such potentially valuable POIs being left out by this method, we included radius fitting (RF) as a complementary method.
The idea of RF is to fit the radii of a vessel at local trunk points with a one-variable quadratic function:  , where x is the point index relative to the evaluating trunk point, and y is the radius corresponding to x. Suppose we evaluate trunk point P with the vessel radius r at that point. The local trunk points are P’s adjacent points, and the number of local trunk points on each side is set to min(r/2, 2). By using a least-square fitting, we get the coefficients a, b, and c. Thus, we can obtain the radius of curvature of the curve: ρ = 1/(2|a|). If 1 < ρ < 4r, we collect the point P as a local maximum POI.
The RF method and the DT method are complementary to each other. The DT method is very useful in finding distal points of vessels, while the RF method is obviously not good at this. Also, the RF method can find few important points that the DT method may miss. For example, the RF method can successfully collect the point C in Figure 4 as a POI. Ideally, it will be a representation of B, C, and D. Using only one of them may result in loss of some useful POIs, which in turn will cause failure to detect the aneurysm.
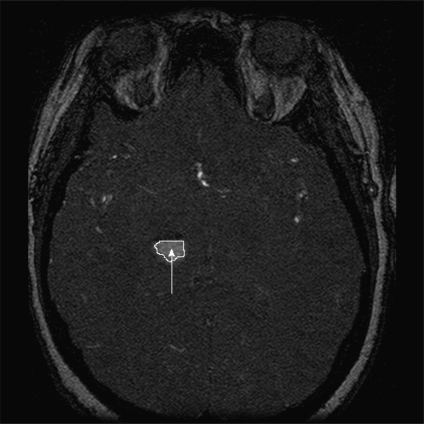
In the second method of collecting POIs, a difference image obtained by subtracting the segmented vessels from the raw image was used to identify floater POIs. The floater POIs were collected by first finding abnormal 2D regions in the difference image, and then checking the volume and dimension of the corresponding 3D regions. A 2D region in the difference image was considered abnormal if the area of that region (based on the intensity threshold found before) was greater than the expected average area of the crossing section of intracranial vessels, which we set to πr2, where r = 2 mm. Starting from the center of the 2D abnormal region and the intensity threshold we found before, we ran the region-growing algorithm to get the 3D abnormal region. If the volume of the 3D region exceeded one-eighth the volume of the surrounding cubic, we collected the center of the 3D region as a floater POI. Figure 5 gives an example of this kind of POI.
Fig 5.
Example of a floater POI in a MRA slice.
The last method employed to collect POIs used a multiscale 3D dot-enhancement filter11 applied to the raw image, resulting in a dotness image and a scale image with maximum responses. The dotness image was then normalized by the scale image on a voxel basis, resulting in a new image that we called the dotness companion image:
 |
2 |
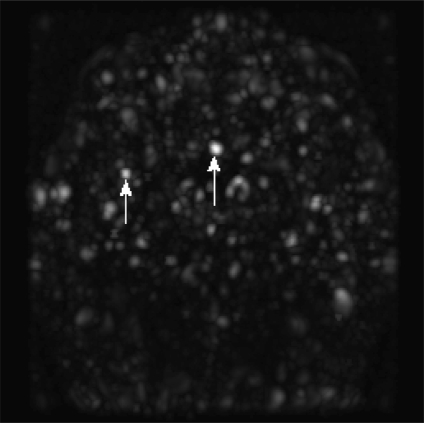
For each MRA case, four dot POIs were typically collected. This was done as follows: find the point(s) in the dotness companion image with the maximum intensity; perform region-growing from that point, with its intensity as the threshold; collect the center point of each resulting 3D region as a dot POI. If the number of dot POIs was less than four, we decreased the threshold by 0.1 and collected all those points with intensity not less than the current threshold as new seeds, and performed region-growing again. This was repeated until we found at least four dot POIs. Figure 6 gives two examples of dot POIs rendered using MIP and the dotness companion image.
Fig 6.
Examples of dot POI in a MIPed dotness companion image.
Extracting Features
We next reduced the number of POIs (‘sieve’) using features of the POIs, selecting only suspicious POIs as aneurysm candidates. These features were also used to assign the probability for a POI to indicate an aneurysm. With the exception of type and position, which were common features of all POIs, unique feature sets were extracted for each kind of POI. For vessel POIs of type (d) and dot POIs, type and position were the only features extracted; for floater POIs, the dimension of the originating 3D region was computed; for vessel POIs of types (a)–(c), which represented most part of the POIs, we had more features extracted:
-
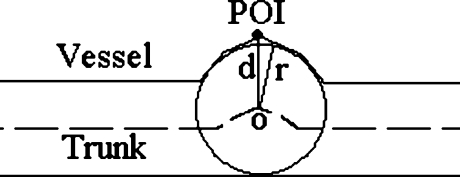
Distance to the trunk
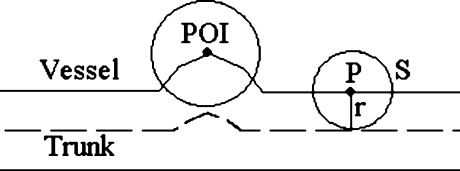
The Euclidian distance from a POI point to the trunk, denoted as d, as shown in Figure 7.
-
Radius of the vessel
The radius of the vessel at the nearest point in the trunk, denoted as r, as shown in Figure 7.
-
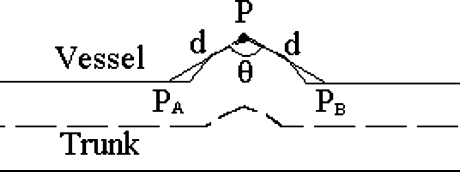
Planeness
Suppose P is a POI point. T is a point set containing those points at vessel surface whose Euclidian distance to P is d, the distance to the trunk. The planeness of the vessel at P is defined as
as shown in Figure 8.
3 -
Cylinder surfaceness (CS)
Suppose P is a point in a cylinder of radius r and infinite length, and S is a sphere of radius r centered at P. The CS at P is defined as:
where Vsphere is the volume of sphere S and Voverlap is the volume of the overlapped part of vessel and sphere S. For any point on the cylinder, its CS is a constant CSC, independent of radius r. However, if P is at a swelling surface of the cylinder, like the POI in Figure 9, its CS will be less than 1.
4 
-
Gaussian and mean curvatures
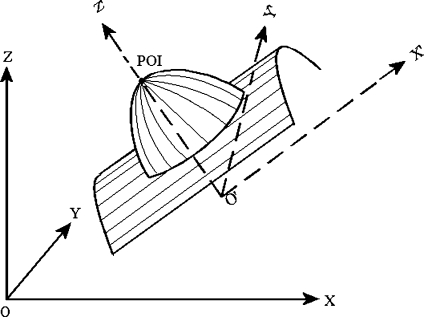
Gaussian curvature (K) and mean curvatures (H) of a vessel surface at a POI were calculated from a fitting quadratic surface of the vessel surface. As shown in Figure 10, we first transformed the coordinates system from XYZ to X′Y′Z′, whose origin O′ is the trunk point nearest to POI, and whose Z′ axis is in the direction of . Then, we used a quadratic surface
5 to fit the local vessel surface around the POI, where any points on the vessel surface with distance not greater than the vessel radius at O′ are considered to be local vessel surface. In this way, K and H could be calculated as:
6 -
Shape index (SI)12.
Based on the aforementioned quadratic surface fitting, SI can be calculated as:
where k1 and k2 are two principal curvatures. Note that 0 < SI < 1, and the nearer SI is to 1, the more likely a POI locates on the surface of a sphere, which indicates a suspicious POI of aneurysm.
7
Fig 7.
Distance to the trunk (d) and radius of the vessel (r).
Fig 8.
Planeness calculation.
Fig 9.
Cylinder surfaceness calculation.
Fig 10.
Gaussian and mean curvatures calculation.
Sieving POIs
Among the collected POIs, most POIs were not due to true aneurysms, but rather represented curves or bifurcations. To sieve suspicious POIs from those collected POIs, a series of empirically determined rules based on the calculated features were applied sequentially. The most important ones were as follows:
For any POI, if it is located too low (below 1/8 of total image height) or too high (above 7/8 of total image height), remove it;
If a POI has a small radius of vessel (less than 1 mm), remove it;
If a local maximum POI locates in a vertically low position (below 2/5 of total image height) and near a leaf trunk, remove it;
If a vessel POI is near a long trunk (longer than four times the maximum radius of the trunk), and the planeness is less than −0.9 (−0.8 for local maximum POI), remove it;
-
For a local maximum or bifurcation vessel POI, define a tolerance function of radius r:

8 If cylinder surfaceness, CS, satisfies CS/CSC > λ(r), remove it;
For a local maximum or bifurcation vessel POI, if K and H does not satisfy H < 0 and K > 0 (we need to keep elliptical concave points, see HK classification rule13 in Table 1), remove it;
For a local maximum or bifurcation vessel POI, if SI < 0.99, remove it;
For a floater POI, if it is located too far from the center (beyond the cubic region centered at the image center and sized 3/4 of the raw image in each dimension), remove it;
For a dot POI, if it is located within the segmented image, remove it.
Table 1.
HK Classification
| K < 0 | K = 0 | K > 0 | |
|---|---|---|---|
| H < 0 | Hyperbolic concave | Cylindrical concave | Elliptical concave |
| H = 0 | Hyperbolic symmetric | Planner | Impossible |
| H > 0 | Hyperbolic convex | Cylindrical convex | Elliptical convex |
Assigning Probability
The above sieving rules removed the majority (about 99% in our experiment) of POIs, reducing the number of POIs from several thousand to approximately one dozen. A probability value, ranging from 0 to 1, and representing the likelihood of being a true aneurysm, was assigned to each of the remaining suspicious POIs. With the probability assigned, POIs were ranked and further clustered to reduce the output magnitude. The clustering algorithm first grouped POIs according to the distances between them and the radii of vessels near them: if the Euclidian distance between two POIs was not greater than two times of the maximum of the two radii near them, the two POIs were in the same group. Then, the clustering algorithm chose a POI with highest probability (if the probability were the same, we chose the one with bigger radius) from each group.
For vessel POIs of types (a)–(c), the probability was calculated according to four factors, each of which except the last one was measured in mm:
-
s: size of the aneurysm suspect
We estimated the size of the aneurysm suspect as
where H(σ) is the mean curvature calculated based on different scale σ.
9 dt: distance to the trunk
r: radius of the vessel
-
dc: distance to the center of image, normalized by the distance from any corner of the 3D image to the center of the image.
The probability p of POI was then calculated as
where
10 
11 
12 
13
where, sadj and radj were all derived using linear interpolations with empirical boundary conditions. For sadj, the boundary conditions were: if s = 1, sadj = 1/3; if s = 10/3, sadj = 1. For radj, the boundary conditions were: if r = 1, radj = 2/3; if r = 10/3, radj = 1.
14 For all other type of POIs, the probability was calculated according to dc only. So we set padjust = 1 and used the same probability formula as above.
Experimental Results
After IRB approval, we identified 287 MRA studies in 222 patients who had undergone intracranial DSA to confirm the presence or absence of aneurysms. Studies with coiled aneurysms were excluded. The chosen studies were then annotated by a radiologist to identify the aneurysm(s) with confirmation by a neuroradiologist in equivocal cases. This person had access to reports and DSA images to increase confidence of findings. A total of 147 ground truth aneurysms were identified in 92 studies, including all the three types (saccular, bifurcation, and fusiform), and with sizes ranging from 1 to 31 mm. These 147 ground truth lesions included 55 small (<5 mm diameter) and 92 large (≥5 mm diameter) aneurysms.
We executed the algorithm on each of the 287 studies, and computed the number of true positives (TP) as those where POIs were within 10 mm of the annotated aneurysm location. False positives (FP) were all the POIs more than 10 mm far away from the annotated aneurysm. Since the purpose of the CAD scheme was to highlight suspected regions for review by a radiologist, we did not require exact overlap of the CAD output with the true aneurysm, and accepted the CAD output if it was close to (within 10 mm) of the annotated true aneurysm.
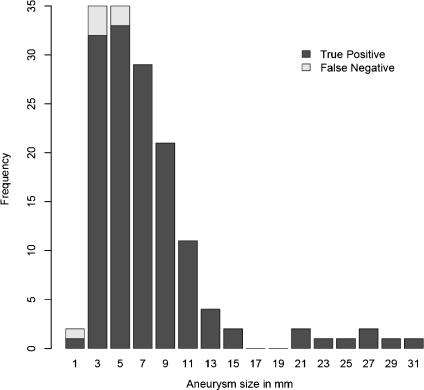
In our test, when no constraint was set to the output, 141 aneurysms were successfully detected, with 96% sensitivity and 11.6 FPs per study. A histogram of aneurysm size and detection rate is given in Figure 11. We noted that in Figure 11, two missing false-negative detections in the size 5-mm column were actually 4.3 mm and 5.2 mm. Therefore, among the total six missing aneurysms, five were small. The detection rate for small aneurysms is thus (55 − 5) / 55 ≈ 91%. We found similar sensitivity for all types of aneurysms, including saccular, bifurcation, and fusiform types. This can be seen from the fact that although we missed a small amount of aneurysms that are all of saccular type, we still succeeded in detecting most of the saccular aneurysms, as well as all bifurcation and fusiform ones.
Fig 11.
Histogram of aneurysm size and detection rate.
To adjust the confidence level to the results, thresholding on either the probability or the maximum number of candidate POIs can be used. That is, if we set different limits to the probability of output (lower limit) or the number of POIs (upper limit), we get different sensitivities and FP rates. For example, if we set 13 as the output number limit, we achieve 95% sensitivity and nine FPs per study; if the output number limit was set to 8, we obtained 93% sensitivity and 6.5 FPs per study. Figure 12 gives the two FROC (free-response receiver operating characteristic) curves of our test results, corresponding to the two different thresholding methods. Sensitivities for small aneurysms are also given in Figure 12. We can see that thresholding on the maximum output number is better than on the probability, for both all aneurysms and small aneurysms. For example, when we have three FPs per study, we get about 80% sensitivity for all aneurysms and 71% for small aneurysms if thresholding on maximum output number, but only 65% and 40% sensitivity, respectively, if thresholding on probability.
Fig 12.
The FROC curves of the test results.
Discussion
Detection of intracranial aneurysms is an important task. Rupture of unknown aneurysms with subsequent intracranial hemorrhage is a significant cause of morbidity and mortality in young adults. The role of screening has been debated, but is generally accepted for high-risk populations such as those with a strong family history of intracranial aneurysm, or those with pre-disposing conditions like polycystic kidney disease. The value of screening is directly related to the accuracy. If many positive cases are missed, the value is low. If there are many false positives, the value is also low if the confirmatory test has a high cost in terms of monetary cost and potential morbidity. Increasing the accuracy of a test makes it more amenable to screening a broader population. From that perspective, improving the accuracy of screening for intracranial aneurysms using MRA is an important development. Furthermore, the number of intracranial MRA exams for all suspected pathologies, including stroke, neurologic dysfunction, and others, is extremely large, and each of these exams should be assessed for potential aneurysm.
There have been other works that reported on algorithms to assist in detection of intracranial aneurysms. Arimura et al.5 described a CAD scheme for detection of aneurysms from MRA images based on the selective enhancement filter for dots and some false-positive removal rules. Their method was reported to have a high sensitivity and low false-positive rate, but the rules used to eliminate the false positives were derived from only a small number of aneurysms, and may therefore have limited application for other unknown cases. Also, their scheme was only evaluated by a few cases from a single MR scanner. Hasanori et al.6 reported a simple CAD method for aneurysm detection from MRA. Their method first segmented the intracranial vessels, examined the vessel diameter from the corresponding cerebrovasular areas, and then reviewed the characteristic values to detect aneurysms. Their method was able to detect large saccular and fusiform aneurysms, but could not detect small aneurysms. In addition, the method was not fully automatic. Kobashi et al.7 proposed a method based on subtracting the assumed normal arteries from the segmented arteries, and a case-reasoning database. Only validated by a small number of cases, their method was unable to identify fusiform aneurysms that occurred because of dilation of a vessel in the direction perpendicular to the long axis with the same radius.
According to the experimental results, the sensitivity of our CAD scheme for aneurysm was excellent. Indeed, even using the CAD without human input, sensitivities were substantially higher than previous reports (e.g., a sensitivity range of 69∼99% was reported by Miller14). Furthermore, and potentially more significant, is that for small aneurysms, the sensitivity of our CAD scheme can be up to 91%, which is much higher than the reported sensitivity of 35∼56% by human detection.1,3,4
Although the CAD scheme we developed can help radiologists detect aneurysms, it is not a substitute for radiologist interpretation. MRA datasets contain a large amount of information, are subject to image artifacts, and contain pathology that is not only limited to aneurysm detection. Therefore, we suggest that such CAD schemes be used to assist radiologists in highlighting areas of interest that may deserve a second look (akin to a ‘second read’ targeted at aneurysm detection.) The detection results of our CAD scheme can be integrated into image-viewing tools and displayed in multiple ways, including 2D slice-based ROI highlighting and 3D vessel-based ROI annotation. Radiologists can then make final decisions as to whether true pathology exists, taking into account other factors such as patient history, machine variability, and other co-existing pathology. By limiting the number of detections, radiologists can adjust the confidence level of the CAD output. Since a probability to be an aneurysm is assigned to each aneurysm candidate, radiologists can also adjust the confidence level by thresholding on the probability. While there are false positives in the detection, the number is very manageable (we believe less than ten false positives per case is acceptable) and an efficient user interface can make reviewing that number of candidates a quick task.
One key feature of our CAD scheme is that it is fully automated. This is important because it means there is no operator variability in results, and it can be applied to screening centers where high-level operator expertise may be difficult to obtain. We also note that the algorithm is computationally reasonable. The median execution time was 8 CPU minutes with a maximum of 27 CPU minutes on a desktop computer. This means that it can be inserted into the workflow of a typical radiology department with little impact.
Some limitations that we recognize are that we specifically exclude studies with clipped or coiled aneurysms. This patient group is at an elevated risk for other aneurysms, and so it is important to have high detection rates for them as well. We excluded these studies because of the possible confounding effects of the artifacts produced by the devices. Informally, we note that this does not appear to be a problem, as the devices typically cause loss of signal in the local area. Therefore, the ability to detect remote aneurysms should be unaffected. We also suspect that we might have low sensitivity to aneurysms nearby, as well as for recurrence/residual aneurysms.
Our study also included a mix of 1.5 and 3 T studies from several manufacturers. However, we did not look at the specific effect of field strength or vendor to know if there was a difference—we wished to have a general algorithm, and not optimize it for specific types of data.
Conclusion
We have developed a fully automatic CAD scheme that can detect all types of intracranial aneurysms of different sizes from 3D MRA images, with high accuracy and an adjustable and acceptable FP rate. We believe that this CAD scheme holds promise for assisting radiologists in the detection of aneurysms in MRA examinations.
Contributor Information
Xiaojiang Yang, Email: yang.xiaojiang@mayo.edu.
Daniel J. Blezek, Email: blezek.daniel@mayo.edu
Lionel T. E. Cheng, Email: chenglionel@hotmail.com
William J. Ryan, Email: ryan.william@mayo.edu
David F. Kallmes, Email: kallmes.david@mayo.edu
Bradley J. Erickson, Phone: +1-507-2846238, FAX: +1-507-2660884, Email: bje@mayo.edu
References
- 1.Kraft JK, Bradey N, Newman PK. Intracranial aneurysm: seen and unseen. J Neurol Neurosurg Psychiatry. 2003;74:1431–1431. doi: 10.1136/jnnp.74.10.1431. [DOI] [PMC free article] [PubMed] [Google Scholar]
- 2.Wardlaw JM, White PM. The detection and management of unruptured intracranial aneurysms. Brain. 2000;123(2):205–221. doi: 10.1093/brain/123.2.205. [DOI] [PubMed] [Google Scholar]
- 3.Korogi Y, Takahashi M, Mabuchi N, Nakagawa T, Fujiwara S, Horikawa Y, Miki H, O’Uchi T, Shiga H, Shiokawa Y, Watabe T, Furuse M. Intracranial aneurysms: diagnostic accuracy of MR angiography with evaluation of maximum intensity projection and source images. Radiology. 1996;199:199–207. doi: 10.1148/radiology.199.1.8633146. [DOI] [PubMed] [Google Scholar]
- 4.White PM, Teasdale EM, Wardlaw JM, Easton V. Intracranial aneurysms: CT angiography and MR angiography for detection prospective blinded comparison in a large patient cohort. Radiology. 2001;219:739–749. doi: 10.1148/radiology.219.3.r01ma16739. [DOI] [PubMed] [Google Scholar]
- 5.Arimura H, Li Q, Korogi Y, Hirai T, Abe H, Yamashita Y, Katsuragawa S, Ikeda R, Doi K. Automated computerized scheme for detection of unruptured intracranial aneurysms in three dimensional magnetic resonance angiography. Acad Radiol. 2004;11:1093–1104. doi: 10.1016/j.acra.2004.07.011. [DOI] [PubMed] [Google Scholar]
- 6.Hayashi H, Oshima Y, Tada H, Ozawa Y: Available at http://www.yokogawa.com/rd/pdf/TR/rd-tr-r00039-008.pdf. Accessed 27 May, 2009
- 7.Syoji K, Katsuya K, Yutaka H. Computer-aided diagnosis of intracranial aneurysms in MRA images with case-based reasoning. IEICE Trans Inf Syst. 2006;E89-D:340–350. doi: 10.1093/ietisy/e89-d.1.340. [DOI] [Google Scholar]
- 8.Hirai T, Korogi Y, Arimura H, Katsuragawa S, Kitajima M, Yamura M, Yamashita Y, Doi K. Intracranial aneurysms at MR angiography: effect of computer-aided diagnosis on radiologists’ detection performance. Radiology. 2005;237(2):605–610. doi: 10.1148/radiol.2372041734. [DOI] [PubMed] [Google Scholar]
- 9.Ta-Chih L, Rangasami LK, Chong-Nam C. Building skeleton models via 3-D medial surface/axis thinning algorithms. CVGIP: Graph Models Image Process. 1994;56:462–478. doi: 10.1006/cgip.1994.1042. [DOI] [Google Scholar]
- 10.Zhou Y, Arthur WT. Efficient skeletonization of volumetric objects. IEEE Trans Vis Comput Graph. 1999;5(3):196–209. doi: 10.1109/2945.795212. [DOI] [PMC free article] [PubMed] [Google Scholar]
- 11.Li Q, Arimura H, Doi K. Selective enhancement filters for lung nodules intracranial aneurysms, and breast microcalcifications. Int Congr Ser. 2004;1268:929–934. doi: 10.1016/j.ics.2004.03.372. [DOI] [Google Scholar]
- 12.Jan JK. Solid Shape. Cambridge, Massachusetts: MIT Press; 1990. [Google Scholar]
- 13.Alessandro C, Claudio C, Raimondo S. 3D face detection using curvature analysis. Pattern Recogn. 2006;39:444–455. doi: 10.1016/j.patcog.2005.09.009. [DOI] [Google Scholar]
- 14.Miller JC: Available at http://www.mghradrounds.org/index.php?src=gendocs&link=2008_january. Accessed 2 June, 2009.


