Abstract
Color blending is a popular display method for functional and anatomic image fusion. The underlay image is typically displayed in grayscale, and the overlay image is displayed in pseudo colors. This pixel-level fusion provides too much information for reviewers to analyze quickly and effectively and clutters the display. To improve the fusion image reviewing speed and reduce the information clutter, a pixel-feature hybrid fusion method is proposed and tested for PET/CT images. Segments of the colormap are selectively masked to have a few discrete colors, and pixels displayed in the masked colors are made transparent. The colormap thus creates a false contouring effect on overlay images and allows the underlay to show through to give contours an anatomic context. The PET standardized uptake value (SUV) is used to control where colormap segments are masked. Examples show that SUV features can be extracted and blended with CT image instantaneously for viewing and diagnosis, and the non-feature part of the PET image is transparent. The proposed pixel-feature hybrid fusion highlights PET SUV features on CT images and reduces display clutters. It is easy to implement and can be used as complementarily to existing pixel-level fusion methods.
Key words: Image fusion, pixel-level fusion, feature-level fusion, pixel-feature hybrid fusion
Introduction
Image fusion display, where the registered images are presented as a single combined image, is an indispensable tool in clinical setting.1 Many image fusion methods have been proposed,2,3 and a few visualization methods for registered datasets are also recently reported.4 Most of the fusion methods are effective for grayscale intra-modality image fusion.3 For inter-modality fusion in general, and functional and anatomic medical image fusion in particular, the overlay display remains the most popular fusion method. In the overlay display, an anatomic image such as computed tomography (CT) is typically displayed in grayscale as underlay and a functional image such as positron emission tomography (PET) is displayed in pseudo color as overlay. The underlay and overlay are blended together with an adjustable transparency. That is, the resultant image is a weighted average of underlay and overlay images, the weight based on the transparency value, α, customarily called alpha value. The alpha value ranges between 0 and 1 inclusive. A weight equal to α is applied to the underlay, whereas the weight applied to overlay is 1 − α. This is one of 12 image composition methods using the alpha values.5
The image overlay does not discard any information. It is hard for the user to assimilate the fused information quickly and effectively. This paper thus discusses a pixel-feature hybrid fusion method that overlays key features of the functional image on anatomic underlay image.
Design Consideration
Image fusion can have different hierarchical levels: pixel, feature, and decision levels. In the pixel-level fusion, the pixel values are combined. This level of fusion does not discard any information. However, it makes it hard for the user to extract and consume the fused information. The feature-level fusion extracts features from both images and then fuses them. It reduces the information available in the source images but makes it easy for the user to consume the fusion result. In the case of decision-level fusion, the decisions are made independently then fused by, e.g., a voting system. A multi-modality computer-aided diagnosis system would work like a decision-level fusion device.
The aforementioned image overlay is a typical pixel-level fusion. It makes all raw information available; thus, it may not be easy for a clinician to derive a decision quickly. In order for the fused image information to be understood quickly and effectively, features on the images to be fused can be extracted prior to fusion. However, it takes considerable computing power to extract features from both images. Moreover, it requires a comprehensive study on what features to extract in each image for effective viewing and diagnosis. Furthermore, even if proper features are extracted from images, one may not have enough contextual information to spatially relate features to anatomy.
This paper thus proposes a pixel-feature hybrid fusion in which features of functional images are extracted and overlaid on top of anatomic images. It aims to aid the viewing and diagnosis of PET/CT images by extracting the standardized uptake value (SUV)-related features, from the PET images, and presenting them on the CT anatomic context. SUV measurement plays a significant role in PET image viewing and diagnosis,6 so regions above a SUV threshold or multiple SUV iso-contours are extracted and treated as key features. Non-feature image pixels are made transparent, so most of the underlay will show through. The visual appearance of the display improves, the fused information can be assessed quickly, and anatomic context reference for the extracted features is clearly presented.
Regions or SUV iso-contours can be segmented using segmentation algorithms. However, the segmentation is computationally expensive. Moreover, if multiple iso-contours are to be displayed or when the SUV thresholds change, the segmentation algorithm will be executed multiple times. Some of the segmentation algorithms are not very computationally expensive, and real-time performance can be achieved on high-end computers. It is becoming common to deploy viewing applications on an application server, and the user may access them from a thin client.7 In this deployment scenario, it might not be possible to achieve real-time segmentation on the thin client side as frequently, the client is a low-end PC. It is certainly possible to segment images on the powerful server side. In the course of user interactions, the round-trip time reduces the system responsiveness. Therefore, a simple and fast segmentation (on the client side) is favored.
The pixel-feature hybrid fusion does not employ any expensive algorithms to extract the SUV features. Rather, it extracts the features through a simple and fast colormap manipulation. Thus, the resulting image display is instantaneous. The conventional colormaps and the modified colormaps can coexist in the same application, or a single colormap may be modified to have different behavior. Therefore, the pixel-feature hybrid fusion method can be considered as a complementary tool to the popular color overlay fusion or other pixel-level fusion, such as frequency encoding method.2 To the best of our knowledge, there is no report yet on feature-level or pixel-feature hybrid fusion methods for multi-modality medical image fusion, particularly PET/CT fusion.
Although this paper does not concern image registration, the latter constitutes a requirement for image fusion. Registration is the process to bring two images into the same coordinate system, and fusion is the (display) process to combine information from two images. Even in the case of PET and CT images acquired on the same system, misregistration may still occur as those images are frequently acquired in tandem, and/or the acquisition time spans are different for the two acquisitions (CT is much quicker); therefore, patient motion could be involved. If the images are not well registered, image features can be overlaid in a wrong anatomic context, which gives a false impression and could lead to misinterpretation. Prior to employing any image fusion method, the user should ensure that the images to be fused are registered.
Description of the Methods
Colormaps for Feature Extraction
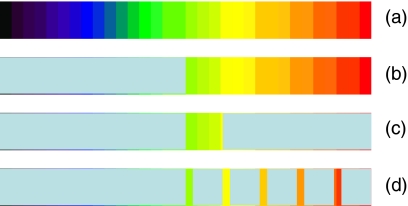
Colormaps are frequently used to display functional images such as PET or single photo emission computer tomography (SPECT). To have a false contouring effect, colormaps should have a few readily discernable colors.8 The pixel-feature fusion method starts with existing colormaps that a physician may use to view the overlay image and introduces some modifications to them. The method is schematically shown in Figure 1.
Fig 1.
Colormaps with contouring effects: a an original colormap, b a colormap to segment out the image where the SUV is above a threshold, c a colormap to segment out the image where the SUV is within a given SUV range, and d a colormap to segment out the image where the SUV is within multiple given SUV ranges.
Figure 1a shows an original colormap for overlay display. When an image is displayed as a traditional overlay, the alpha value is changed uniformly for all overlay pixels displayed in those colors. In Figure 1b, however, the lower half of the colormap is replaced with a single color designated as the KeyColor. This color is special, as overlay pixels displayed in that color will be transparent, independent of the alpha value for the overlay color blending. If the whole colormap is linearly mapped to SUV between 0 and 5, then pixels whose SUV is less than 2.5 are transparent when (b) is used. Note that for 18F-FDG, SUV of 2.5 is an appropriate threshold that may separate certain benign and malignant lesions.6 The upper part of the colormap is used as a typical colormap, and when the pixels are mapped to those colors, the pixels are color blended with the underlay, using the same user adjustable alpha value.
The following pseudo code shows how the images are fused in the presence of the KeyColor:
![]()
It is assumed that img1 (underlay, CT for example) and img2 (overlay, PET for example) have the same width and height. If the KeyColor is not present, the statement in the “else” block is always executed, which is the conventional image overlay (i.e., the resultant image is a weighted average of underlay and overlay). As each color has R, G, and B components, that “else” block statement works on the individual color channel. Note how the KeyColor makes the portion of the overlay transparent, which is particularly useful when colormaps in Figure 1b–d are employed. In that case, only the underlay portion is shown.
Figure 1c is similar to Figure 1b except that the colors on the higher end are also made transparent. If the colormap corresponds to SUV from 0 to 5, then with colormap 1(c), the pixels whose SUV values are between 2.5 and 3.0 will be displayed and blended with the underlay. Outside the 2.5 to 3 SUV range, the pixels are transparent due to the KeyColor; thus, the underlay will be shown completely.
Figure 1d is an extension to 1(c) where multiple SUV ranges are introduced. The colors are relatively the same within each SUV range. Hence, different SUV iso-contours can be displayed in different colors. For the case in 1(d), pixels whose SUV measurements are in narrow bands around SUV of 2.5, 3.0, 3.5, 4.0, and 4.5 will be displayed and blended with the underlay. All other overlay pixels will be transparent due to the KeyColor, and the CT pixels underneath will show through.
Patient Images
The new colormaps, described in this paper, were applied to PET/CT datasets, which were acquired on a hybrid instrument (Philips GEMINI 16 GXL). The CT was acquired using reduced technique (120 kV, 40 mAs) and used for 18F-FDG PET attenuation correction during the three-dimensional image reconstruction. These images demonstrate increased accumulation of radiopharmaceutical in liver lesions. Expected increased activity is seen in the heart and bladder.
Results
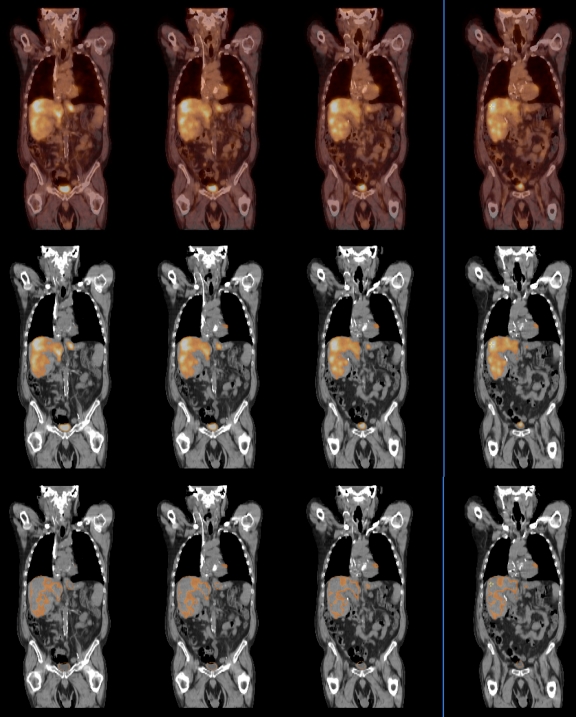
In Figure 2, the CT and PET coronal images are shown, in grayscale and pseudo colors, respectively. The whole PET colormap is mapped to SUV between 0 and 4. The transparency of the overlay is 50%, which can be changed interactively. In the top row, the PET image is displayed using the conventional colormap. In the middle row, a colormap similar to Figure 1b is used, where pixels whose SUV are higher than 2 are shown. Unlike the top row, the background CT is completely shown. The threshold of 2 can be customized to individual needs, as many factors influence SUV measurement.6 A lower threshold value can be used to compensate for a partial volume artifact. With colormaps similar to Figure 1b, one can quickly assess the lesions and their extent. The bottom row overlays the PET image where the SUV is within the range from 2 to 2.5. By doing that, a good portion of the liver is shown from the CT images. On the middle and bottom rows, the overall transparency of the PET overlay can still be adjusted interactively, as in the top row.
Fig 2.
Top row shows the PET/CT image fusion using a conventional colormap. In the middle row, the colormap similar to Figure 1b is used for the PET, where pixels whose SUV are higher than 2 are blended with CT. In the bottom row, SUV in the range from 2 to 2.5 are blended with CT.
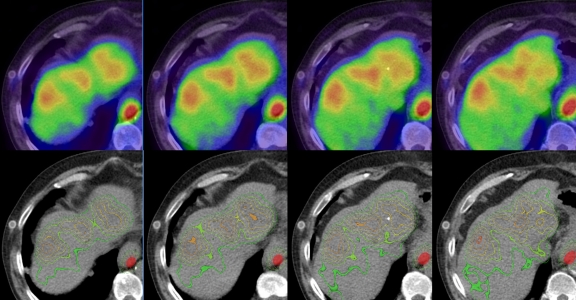
Figure 3 shows the axial view of the patient liver with different colormaps. In the top row, the image fusion is done using the conventional colormap, with an alpha value of 50%. The colormap of the PET is mapped linearly to SUV from 0 to 4. The CT liver underlay image is not well seen. On the bottom row, with a colormap similar to Figure 1d, the iso-contours at SUV of 2.0, 2.5, 3.0, 3.5, and 4.0 are overlaid on top of the CT image (the outside contours correspond to smaller SUV values). A narrow SUV band of 0.02 was chosen. The SUV iso-contours have distinctive colors, which allow one to see the lesion extent quickly based on different SUV threshold. A good portion of the CT liver underlay image is shown for anatomic reference. The SUV values, as well as the sizes of SUV band, are chosen for illustration and it is not necessary that they be evenly spaced.
Fig 3.
Top row shows the PET/CT fusion using a conventional colormap. Bottom row uses a colormap similar to Figure 1d for the PET, where the iso-contours around SUV of 2, 2.5, 3, 3.5, and 4 are displayed in distinctive colors.
The same colormap can also be applied to the PET image alone, as shown in Figure 4. Color can normally convey the SUV measurement information. However, when the PET is displayed in grayscale, it is not easy to see the SUV and its distribution, due to the limitation of our visual system. The same SUV iso-contours can be overlaid on the grayscale PET images, where the iso-contours are color coded. This is done in the same way as PET/CT fusion, through the colormap manipulation. The images shown in Figure 4 are actually fused from the same PET images.
Fig 4.
Similar SUV iso-contours in Figure 3 are overlaid on the PET images.
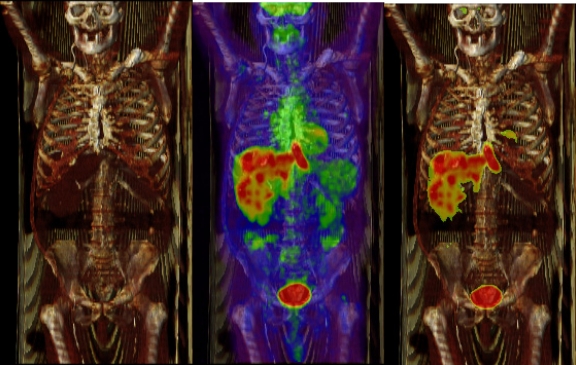
The examples shown so far correspond to two-dimensional fused images. The pixel-feature hybrid fusion method works similarly in three-dimensional fused datasets, as shown in Figure 5. The left image in Figure 5 is the direct volume rendering of the CT study. In the middle image, the PET study is rendered as a maximum intensity projection and overlaid on top of the volume rendered CT, with a transparency of 50%. The colormap used by the PET is the same as in Figure 1a and is linearly mapped to SUV from 0 to 4. Clearly, the anatomic context of the underlying CT is partially blocked by the PET overlay. In the right image, however, a colormap similar to Figure 1b is used and most of the anatomic context is visible. The increased accumulation of radiopharmaceutical in liver lesions is apparent, and normal physiological uptake in heart and bladder is also evident.
Fig 5.
The left image shows direct volume rendering of the CT. The middle image is the fusion of maximum intensity projection of PET and direct volume rendered CT. A conventional colormap similar to Figure 1a is used for PET and the colormap is linearly mapped to SUV from 0 to 4. The right image is similarly rendered as the middle image, except a colormap similar to Figure 1b is used to expose the underline anatomic context.
Discussion and Conclusion
Some viewing software packages can optionally make areas in the functional image totally transparent where the activity is low. This is not effective in the situation where the overlay image areas have a high activity and the underlay areas have a low intensity. In that circumstance, the underlay is visually blocked by the overlay. With the pixel-feature hybrid fusion method, this restriction does not apply, as any part of the colormap can be made transparent. In particular, both the high-end and low-end of the colormap, or multiple segments of the colormap, can be transparent. The pixel-feature hybrid fusion, however, may be regarded as an extension to and generalization of this specific method. As it is unlikely that extracted features will take up all pixels in a given area, the visual occlusions will not happen in our pixel-feature hybrid fusion. By changing the window/level, an effect similar to that shown in the middle row of Figure 2 can be achieved. With that approach, the color representation of the overlay changes and the relation between colors and SUV varies as a consequence. With the pixel-feature hybrid fusion, however, the overlay color representation of the non-transparent portion, and the relation between colors and SUV stay the same.
The false contouring effect can be achieved by either setting the window/level or using a colormap with a few distinctive colors. When setting the window/level to achieve the false contouring effect, both ends falling outside the window/level are set to some color. If those colors are not completely transparent, the underlay image is dimmed, and the anatomic context information is not easy to discern. The color representation of the overlay image is also changed globally, and one can only have one contour at a time. In contrast, the KeyColor in the pixel-feature hybrid fusion allows the underlay image to show through; thus, the contours are visualized within the anatomic context. Multiple contours are automatically generated as long as a colormap similar to Figure 1d is used. Toggling between colormaps as in Figure 1a, d allows the overlay to persist, with the non-contour area alternating in the display. When a colormap with a few discrete colors is used, a similar false contouring effect can be achieved. There are a few important differences, however. The contour lines are very thick, and there is no gap between contours. It is consequently hard to see the underlying anatomic context, in particular, when saturated colors are used. Each contour corresponds to a wide SUV range. For example, if 10 discrete colors are used in the colormap, and the full colormap is mapped to SUV from 0 to 4, the SUV range for each color contour is 0.4. With the pixel-feature hybrid fusion, the SUV range can be very narrow (in the example, that range is 0.02). Application of a colormap to an image may lead to a distorted impression. The visual system will detect a change in color readily, when in reality, only a small change in intensity is present. Application of contours as an overlay to the image gives an advantageous combined representation.
It is worthwhile to point out that the false contouring display effect is not the contour set as used in radiation treatment planning. The contours displayed on the images certainly can guide operators to manually draw regions of interests, which can then be saved as DICOM objects that are used for treatment planning.
SUV measurements are used to specify where the colormap segments are replaced with the KeyColor. This is the natural choice for PET images and used to illustrate the idea of pixel-feature hybrid fusion. This does not make the method only applicable to PET images, however, as we could just use the pixel raw value to specify the segments. We, therefore, expect that hybrid fusion method is also applicable to other modalities such as SPECT/CT, positron emission mammography, and PET/magnetic resonance imaging (MRI). The SUV-based thresholding is nevertheless a simplistic approach to extract features. Some sophisticated features, for example, geometric features such as a gradient, can be extracted and overlaid on CT images as well, with increased computational cost. Those features can also be used along with the SUV features discussed here.
The fusion implementation in the presence of the KeyColor discussed in “Colormaps for Feature Extraction” is just one of a few possible realizations. Color can also be represented as RGBA (for red, green, blue, and alpha).9 As an alternative, alpha values can be considered directly when defining the colormaps. The alpha value associated with the KeyColor can be fixed and will not change, while the alpha value associated with other colors is adjusted interactively.
Interactively changing the position and size of each segment in a colormap as in Figure 1d is challenging, but not impossible. They could be changed at runtime with a combination of numerical key and mouse manipulation. A presentation similar to Figure 1d can also be displayed, and the user can adjust the location of the dividing lines. The position and size can also be preconfigured and applied to any conventional colormap as we did for this study. The conventional colormap and modified colormap can coexist and be toggled through at run time.
In summary, a pixel-feature hybrid fusion for PET-CT fusion display is proposed and tested, in which PET SUV features are extracted and overlaid on top of the anatomic CT images, and non-feature areas are made transparent to show the anatomic context of those features. Feature extraction is done through colormap manipulation to avoid the computationally expensive algorithmic segmentation. Therefore, the results are instantaneous. The proposed pixel-feature hybrid fusion is easy to implement, can co-exist with conventional pixel-level fusion methods, and can be used as a complementary fusion tool.
Acknowledgements
The authors would like to thank Sanjay Gopal for stimulating discussions and reviewers for constructive comments and suggestions. Kaichun Wang implemented the image fusion algorithm in the presence of the KeyColor discussed in “Colormaps for Feature Extraction”.
References
- 1.Hutton BF, Braun M, Thurfjell L, Lau DYH. Image registration: an essential tool for nuclear medicine. Eur J Nucl Med. 2002;29:559–577. doi: 10.1007/s00259-001-0700-6. [DOI] [PubMed] [Google Scholar]
- 2.Quarantelli M, Alfano B, Larobina M, Tedeschi E, Brunetti A, Covelli EM, Ciarmiello A, Mainolfi C, Salvatore M. Frequency encoding for simultaneous display of multimodality images. J Nucl Med. 1999;40:442–447. [PubMed] [Google Scholar]
- 3.Laliberte F, Gagnon L, Sheng Y. Registration and fusion of retinal images – An evaluation study. IEEE Trans Med Imag. 2003;22:661–673. doi: 10.1109/TMI.2003.812263. [DOI] [PubMed] [Google Scholar]
- 4.Kim J, Cai W, Eberl S, Feng D. Real-time volume rendering visualization of dual-modality PET/CT images with interactive fuzzy thresholding segmentation. IEEE Trans Infor Technol Biomed. 2007;11:161–169. doi: 10.1109/TITB.2006.875669. [DOI] [PubMed] [Google Scholar]
- 5.Foley JD, Dam A, Feiner SK, Hughes JF. Computer Graphics: Principles and Practice. 2. Boston: Addison-Wesley; 1996. [Google Scholar]
- 6.Thie JA. Understanding the standardized uptake value, its methods, and implications for usage. J Nucl Med. 2004;45:1431–1434. [PubMed] [Google Scholar]
- 7.Armbrust M, Fox A, Griffith R, Joseph AD, Katz R, Konwinski A, Lee G, Patterson D, Rabkin A, Stoica I, Zaharia M: Above the clouds: A Berkeley view of cloud computing, Feb. 2009 (available at http://www.eecs.berkeley.edu/Pubs/TechRpts/2009/EECS-2009-28.html, accessed Nov. 2009).
- 8.Gonzalez RC, Woods RE. Digital Image Processing. Boston: Addison-Wesley; 1992. [Google Scholar]
- 9.Woo M, Neider J, Davis T, Shreiner D. OpenGL Programming Guide. 3. Boston: Addison-Wesley; 1999. [Google Scholar]


