Abstract
OBJECTIVE
Activation of the nuclear hormone receptor peroxisome proliferator–activated receptor (PPAR)-δ has been shown to improve insulin resistance, adiposity, and plasma HDL levels. Several studies have reported that activation of PPARδ is atheroprotective; however, the role of PPARδ in renal function remains unclear. Here, we report the renoprotective effects of PPARδ activation in a model of streptozotocin-induced diabetic nephropathy.
RESEARCH DESIGN AND METHODS
Eight-week-old male C57BL/6 mice were divided into three groups: 1) nondiabetic control mice, 2) diabetic mice, and 3) diabetic mice treated with the PPARδ agonist GW0742 (1 mg/kg/day). GW0742 was administered by gavage for 8 weeks after inducing diabetes.
RESULTS
GW0742 decreased urinary albumin excretion without altering blood glucose levels. Macrophage infiltration, mesangial matrix accumulation, and type IV collagen deposition were substantially attenuated by GW0742. The gene expression of inflammatory mediators in the kidney cortex, such as monocyte chemoattractant protein-1 (MCP-1) and osteopontin (OPN), was also suppressed. In vitro studies demonstrated that PPARδ activation increased the expression of anti-inflammatory corepressor B-cell lymphoma-6, which subsequently suppressed MCP-1 and OPN expression.
CONCLUSIONS
These findings uncover a previously unrecognized mechanism for the renoprotective effects of PPARδ agonists and support the concept that PPARδ agonists may offer a novel therapeutic approach for the treatment of diabetic nephropathy.
The increasing prevalence of diabetic nephropathy worldwide is a major societal issue because of the enormous expense associated with kidney replacement therapy (1). The pathogenesis of diabetic nephropathy is complex and involves multiple pathways that lead to kidney injury, including the polyol pathway (2), protein kinase C (3), advanced glycation end products (4), and transforming growth factor (TGF)-β (5). In addition, inflammation is now recognized to play an important role in the development of diabetic nephropathy (6,7). In this condition, the accumulation of macrophages and increased expression of cell adhesion molecules are observed in renal biopsy specimens from patients with diabetic nephropathy (8). We have demonstrated that inflammation in diabetic nephropathy can be ameliorated by inhibiting macrophage infiltration in intercellular adhesion molecule-1 (ICAM-1) and macrophage scavenger receptor-A (SR-A) knockout mice (9,10). Therefore, inflammation could be a major therapeutic target of diabetic nephropathy.
There is an increasing body of evidence suggesting that a subfamily of nuclear hormone receptor transcription factors, namely the peroxisome proliferator–activated receptors (PPARs) (PPARγ, PPARα, and PPARδ), may play important roles in the pathogenesis of metabolic syndrome, obesity, and diabetes (11). PPARs are also implicated in many renal pathophysiological conditions, including diabetic nephropathy and glomerulosclerosis (12). Synthetic PPARγ and PPARα agonists, such as thiazolidinediones and fibrates, improve the glycemic control in type 2 diabetic patients and lower the serum triglyceride levels in hyperlipidemic patients. In addition, we and other investigators have reported that PPARγ and PPARα agonists are also beneficial in diabetic nephropathy (13–15). Although atheroprotective effects of PPARδ agonists have been reported (16,17), there are no reports regarding the effects of PPARδ agonists on diabetic nephropathy.
The purpose of the current study was to investigate the hypothesis that activation of PPARδ prevents the development of diabetic nephropathy by inhibiting inflammatory processes, including chemokine/cytokine expression and macrophage infiltration.
RESEARCH DESIGN AND METHODS
Experimental protocol.
Male C57BL/6J mice were purchased from Charles River (Yokohama, Japan). Eight-week-old mice were divided into three groups: 1) nondiabetic control mice (control; n = 6), 2) streptozotocin (STZ)–induced diabetic mice (DM; n = 7), and 3) diabetic mice treated with PPARδ agonist GW0742 (DM+GW0742; n = 7). GW0742 mice were purchased from Sigma-Aldrich (Tokyo, Japan). Diabetes was induced by peritoneal injection of 200 mg/kg STZ (Sigma-Aldrich) in citrate buffer (pH 4.5). Blood glucose was measured by the glucose oxidase method at 3 and 7 days after STZ injection, and only mice with blood glucose concentrations >16 mmol/L were used in the study. Mice in the control group were injected with citrate buffer. The DM+GW0742 group received 1 mg/kg/day of GW0742 by gavage for 8 weeks. All mice had free access to standard diet and tap water. All procedures were performed according to the Guidelines for Animal Experiments at Okayama University Medical School, Japanese Government Animal Protection and Management Law (No. 105), and Japanese Government Notification on Feeding and Safekeeping of Animals (No. 6). Mice were killed at 8 weeks after inducing diabetes. The kidneys were removed, weighed, and fixed in 10% formalin for periodic acid–methenamine silver (PAM) staining, and parts of the remaining tissues were embedded in optimal cutting temperature compound (Sakura Finetechnical, Tokyo, Japan) and frozen immediately in acetone cooled on dry ice. Other tissues were snap-frozen in liquid nitrogen and stored at −80°C.
Metabolic data.
We measured body weight, blood pressure, hemoglobin A1c (HbA1c), 24-h urinary albumin excretion (UAE), and creatinine clearance at 0, 4, and 8 weeks. Blood pressure was measured using the tail-cuff method (Softron, Tokyo, Japan). HbA1c was measured using the high-pressure liquid chromatography method, and serum creatinine was measured using the enzymatic method. Urine was collected for 24 h, with each mouse individually housed in a metabolic cage and provided with food and water ad libitum. Urinary albumin concentration was measured as previously described (9). Creatinine was measured enzymatically, and creatinine clearance was calculated.
Light microscopy.
PAM-stained sections were analyzed. To evaluate glomerular size, we examined 10 randomly selected glomeruli in the cortex per animal under high magnification (×400) at 8 weeks after induction of diabetes. The area of the glomerular tuft and the mesangial matrix index (MMI) were measured using Lumina Vision software (Mitani Corporation, Tokyo, Japan). MMI was defined as the PAM-positive area in the tuft area, calculated using the following formula: MMI = (PAM positive area)/(tuft area). The results are expressed as means ± SE (per μm2 for tuft area; arbitrary units for MMI).
Immunoperoxidase staining.
Immunoperoxidase staining was performed as previously described (9). Briefly, fresh frozen sections were cut to 4 μm thick using a cryostat. To evaluate macrophage infiltration, we applied a rat anti-mouse monocyte/macrophage (F4/80) monoclonal antibody (Abcam, Tokyo, Japan), followed by biotin-labeled goat antirat IgG antibody (Jackson Immunoresearch Laboratories, West Grove, PA). The avidin-biotin coupling reaction was performed on sections using a Vectastain Elite kit (Vector Laboratories, Burlingame, CA). We examined 10 glomeruli per animal and counted the number of F4/80-positive cells. The mean number of positive cells per glomerulus and interstitial tissue (number per mm2) were used for the estimation. To evaluate PPARδ and Bcl-6 expression, PPARδ rabbit polyclonal antibody (Affinity BioReagents, Golden, CO) and Bcl-6 rabbit polyclonal antibody (Santa Cruz Biotechnology, Santa Cruz, CA) were applied, followed by biotin-labeled donkey anti-rabbit IgG antibody (Jackson Immunoresearch Laboratories).
Immunofluorescent staining.
Immunofluorescent staining was performed as previously described (9). To clarify the differences in mesangial matrix proteins, we used rabbit anti-type IV collagen antibody (Millipore, Temecula, CA), followed by Alexa Fluor 488 goat anti-rabbit IgG (Invitrogen, Carlsbad, CA). Fluorescence pictures were obtained using a fluorescence microscope (BX51; Olympus, Tokyo, Japan). The type IV collagen immunofluorescence intensity was quantified as previously described (9). Briefly, using Lumina Vision software (Mitani Corporation), the intensity of expression on the images was calculated using the formula, x (density) × positive area (μm2). The positive area of type IV collagen in each glomerulus was estimated as the ratio to the mean area of the glomerulus. Ten glomeruli per animal were evaluated.
Quantitative analysis of renal cortex gene expression.
The RNA from the renal cortex was isolated 8 weeks after treatment using an RNeasy Mini Kit (Qiagen, Valencia, CA). Single-strand cDNA was synthesized from the extracted RNA using a RT-PCR kit (Perkin Elmer, Foster City, CA). To evaluate the mRNA expression of PPARδ, CD14, CD11c, monocyte chemoattractant protein (MCP)-1, chemokine CC motif receptor 2 (CCR2), TGF-β, tumor necrosis factor (TNF)-α, osteopontin (OPN), and ICAM-1 in the renal cortex, quantitative RT-PCR (qRT-PCR) was performed using StepOnePlus (Applied Biosystems, Tokyo, Japan) and FastStart SYBR Premix Ex Taq II (Takara Bio, Otsu, Japan). The primers were purchased from Takara Bio. Each sample was analyzed in triplicate and normalized for GAPDH mRNA expression.
Cell culture and treatment.
RAW 264.7 murine macrophages were cultured in Dulbecco’s modified Eagle’s medium supplemented with 1,000 mg/L d-glucose, 10% FBS, 100 units/mL penicillin, 100 mg/mL streptomycin, and 2 mmol/L l-glutamine. For ligand treatment, cells were serum-starved by culture in 0.5% FBS for 24 h. After pretreatment with GW0742 (10 μmol/L) for 24 h, the cells were stimulated with 4,500 mg/L d-glucose (high glucose) for 24 h. Individual experiments were repeated at least three times with different lots or preparation of cells.
Quantitative analysis of gene expression in RAW macrophages.
Total RNA was prepared from cells using an RNeasy Mini Kit (Qiagen) as described above. B-cell lymphoma-6 (Bcl-6), MCP-1, and OPN mRNA expression in RAW macrophages was measured using qRT-PCR, as described above.
Immunoprecipitation and Western blotting.
Bcl-6 and PPARδ protein expression levels were determined by Western blotting. To examine the interactions between PPARδ and Bcl-6, the nuclear protein fraction was isolated from RAW macrophages using a Nuclear Extract Kit (Active Motif, Carlsbad, CA). The nuclear protein was immunoprecipitated with an anti-PPARδ antibody (Affinity BioReagents) for 1.5 h at 4°C. The nuclear protein–antibody complex was then incubated with magnetized Protein G Dynabeads (Invitrogen) for 45 min at room temperature. After washing the beads, the bound proteins were eluted and resolved by SDS-PAGE. Protein was transferred to nitrocellulose membranes and blocked in 20 mmol/L Tris-HCl (pH 7.6) containing 150 mmol/L NaCl, 0.1% Tween-20, and 5% (wt/vol) nonfat dried milk. The blots were then incubated with anti-PPARδ antibody (Affinity BioReagents) and anti–Bcl-6 antibody (Santa Cruz Biotechnology). The immunoblots were hybridized with anti-TATA binding protein antibody (Abcam) to monitor equivalent loading in different lanes. All experiments were repeated at least three times.
Statistical analysis.
All values are means ± SE. Statistically significant differences between groups were examined using one-way ANOVA followed by Scheffé test. A P value <0.05 was considered statistically significant.
RESULTS
Metabolic data and time course of changes in UAE.
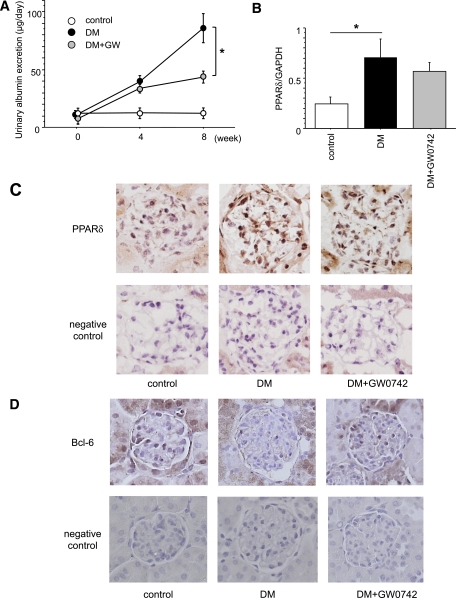
The UAE progressively increased in diabetic mice during the study (Fig. 1A). However, GW0742 treatment significantly reduced the mean UAE (86.09 ± 12.67 μg/day) compared with the DM group at 8 weeks after inducing diabetes (40.91 ± 3.94 μg/day; P < 0.01). The other metabolic data are summarized in Table 1. Eight weeks after inducing diabetes, there were no significant differences in systolic blood pressure between the three groups. HbA1c, kidney weight, and relative kidney weight were significantly higher in the DM group than in the control group. There was no significant difference in HbA1c, kidney weight, and relative kidney weight between the DM and the DM+GW0742 groups. Body weight was lower in both the DM and the DM+GW0742 groups than in the control, but was higher in the DM+GW0742 than in the DM group. There were no significant differences in creatinine clearance or triglyceride levels between the three groups.
FIG. 1.
Time course of changes in UAE and PPARδ mRNA and protein expression in the kidneys. A: The UAE increased progressively in the untreated diabetic (DM) group during the 8-week observation period after the induction of diabetes. GW0742 treatment (DM+GW0742) significantly reduced UAE at 8 weeks compared with the DM group. Control, nondiabetic control mice. Data are means ± SE. *P < 0.01 for DM vs. DM+GW0742. B: Renal PPARδ mRNA expression was significantly increased in the DM group compared with the control group. Data are means ± SE. *P < 0.05. C: Localization of renal PPARδ protein expression by immunohistochemistry. PPARδ protein expression was predominantly localized in the glomeruli of the DM and DM+GW0742 groups. Original magnification ×400. D: Localization of renal Bcl-6 protein expression by immunohistochemistry. Bcl-6 protein was mainly expressed in the glomeruli of the control group, but its expression was suppressed in the DM group. The expression of Bcl-6 recovered in the DM+GW0742 groups compared with the DM group. Original magnification ×400. (A high-quality digital representation of this figure is available in the online issue.)
TABLE 1.
Metabolic data at 8 weeks after inducing diabetes
| Control | DM | DM+GW0742 | |
|---|---|---|---|
| n | 6 | 7 | 7 |
| Systolic blood pressure (mmHg) | 97.8 ± 7.9 | 111.8 ± 4.4 | 110.1 ± 3.5 |
| HbA1c (%) | 4.60 ± 0.04 | 9.75 ± 0.34* | 8.81 ± 0.62* |
| Body weight (g) | 26.75 ± 0.39 | 17.74 ± 1.03* | 20.70 ± 0.41*† |
| Kidney weight (mg) | 283.3 ± 3.3 | 325.7 ± 18.8‡ | 295.7 ± 6.1 |
| Relative kidney weight (mg/g body wt) | 11.82 ± 0.27 | 18.85 ± 1.87* | 15.87 ± 0.57 |
| Creatinine clearance (mL/min) | 249.0 ± 34.8 | 349.5 ± 40.4 | 348.1 ± 44.7 |
| Triglycerides (mg/dL) | 23.6 ± 2.0 | 27.9 ± 7.3 | 21.5 ± 4.8 |
Data are means ± SE.
*P < 0.01 vs. the control group.
†P < 0.01 vs. the DM group.
‡P < 0.05 vs. the control group.
Renal PPARδ and Bcl-6 expression.
We found PPARδ mRNA and protein expression in the kidneys. At 8 weeks, renal PPARδ mRNA expression was significantly greater in the DM group than in the control group (0.71 ± 0.18 vs. 0.24 ± 0.07, respectively; P < 0.05) (Fig. 1B). However, GW0742 treatment did not affect PPARδ mRNA expression in renal tissues. Renal sections immunostained with PPARδ-specific antibodies revealed that PPARδ protein expression was predominantly localized in the glomeruli of DM and DM+GW0742 groups and to a lesser extent in the glomeruli of the control group (Fig. 1C). By contrast, the anti-inflammatory corepressor Bcl-6 was mainly expressed in the glomeruli of the control group, and its expression was suppressed in the DM group. GW0742 treatment recovered the expression of Bcl-6 compared with the DM group (Fig. 1D).
MMI and expression of type IV collagens in the glomeruli.
Representative glomeruli in PAM-stained sections are shown in Fig. 2A. Glomerular hypertrophy and mesangial matrix expansion were observed in the DM group at the end of the 8-week observation period. However, these changes were ameliorated in the DM+GW0742 group compared with DM group (MMI: 9.05 ± 0.30 vs. 12.34 ± 0.49%, respectively; P < 0.001) (Fig. 2B). A similar trend was noted for type IV collagen (Fig. 2C). The type IV collagen–positive area in glomeruli was larger in the DM group than in the control group. This area was markedly reduced in the DM+GW0742 group compared with the DM group (9.57 ± 0.18 vs. 12.33 ± 0.49%, respectively; P < 0.001) (Fig. 2D).
FIG. 2.
PAM staining of kidney sections and the expression of type IV collagen in the kidney. A: Representative glomeruli from control, DM, and DM+GW0742 mice. Glomerular hypertrophy and mesangial matrix expansion were evident in the DM group. GW0742 suppressed the increase in the MMI compared with the DM group. Original magnification ×400. B: MMI in glomeruli. Data are means ± SE. *P < 0.001. C: Type IV collagen was significantly increased in the DM group compared with the control group and was decreased in the DM+GW0742 group compared with the DM group. Original magnification ×400. D: Type IV collagen–positive area in glomeruli. Data are means ± SE. *P < 0.001. (A high-quality digital representation of this figure is available in the online issue.)
Macrophage infiltration in the kidney.
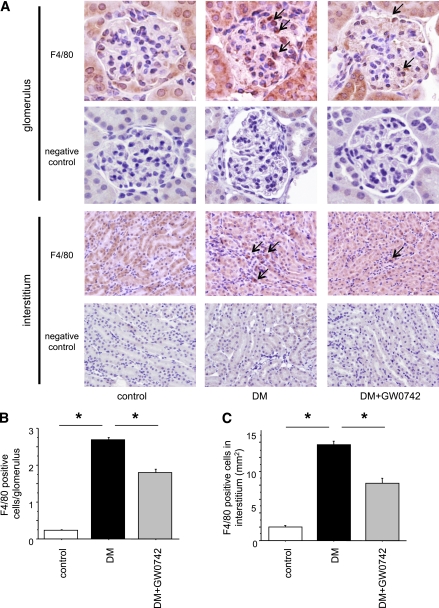
The number of macrophages in the glomeruli was remarkably higher in the DM group than in the control group. Interestingly, macrophage infiltration into the glomeruli was significantly reduced in the DM+GW0742 group compared with the DM group (1.80 ± 0.08 vs. 2.69 ± 0.05, respectively; P < 0.001) (Fig. 3A and B). Similarly, macrophage infiltration into the interstitium was increased in the DM group but was suppressed in the DM+GW0742 group (13.79 ± 0.53 vs. 7.75 ± 0.77, respectively; P < 0.001) (Fig. 3A and C).
FIG. 3.
Macrophage infiltration into the kidney. A: Macrophage (arrows) infiltration into glomeruli and interstitium was remarkable in the DM group and was suppressed in the DM+GW0742 group. Original magnification ×400. B: The number of intraglomerular macrophages. Data are means ± SE. *P < 0.001. C: The number of macrophages in interstitium. Data are means ± SE. *P < 0.001. (A high-quality digital representation of this figure is available in the online issue.)
Macrophage and inflammatory gene expression in the renal cortex.
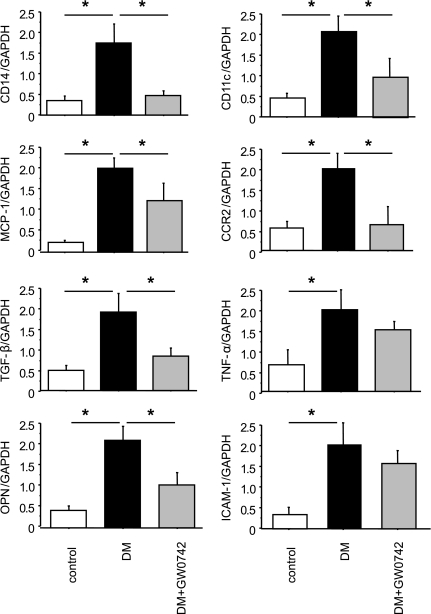
qRT-PCR analyses of kidney tissue demonstrated that the expression of two macrophage marker genes, CD14 and CD11c, was increased in the DM group and that GW0742 treatment markedly reduced the expression of these genes (Fig. 4). CD14 is a marker for all macrophages, and CD11c is specific for the M1 subtype of macrophages. Similarly, the induction of diabetes increased the renal expression of several proinflammatory and proatherogenic genes, including MCP-1, TGF-β, OPN, TNF-α, and ICAM-1. Although GW0742 decreased the expression of MCP-1, TGF-β, and OPN, it did not affect TNF-α or ICAM-1 (Fig. 4). Of note, MCP-1, a key chemokine involved in macrophage recruitment, plays a significant role in diabetic nephropathy because the absence of MCP-1 significantly reduces diabetic renal injury (18,19). Similarly, OPN is also a critical inflammatory cytokine involved in diabetic nephropathy (20,21). Collectively, these data indicate that the PPARδ agonist GW0742 inhibits diabetes–induced macrophage recruitment and inflammatory gene expression in the kidney.
FIG. 4.
PPARδ activation suppresses diabetes–induced renal inflammation and macrophage infiltration. Quantitative RT-PCR analysis of the expression of two macrophage markers (CD14 and CD11c) shows that GW0742 inhibited diabetes–induced macrophage infiltration into the kidney. Similarly, GW0742 suppressed MCP-1, CCR-2, TGF-β, and OPN mRNA levels in the kidney. mRNA levels are normalized to GAPDH. Data are means ± SE. *P < 0.05.
PPARδ and Bcl-6 expression in RAW macrophages.
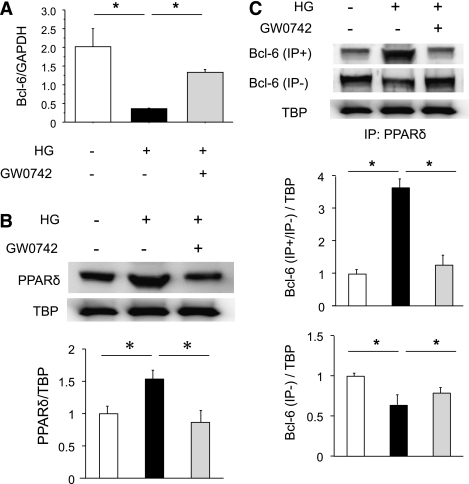
PPARδ has been demonstrated to directly affect the anti-inflammatory transcriptional repressor Bcl-6. PPARδ agonists increase free Bcl-6 in macrophages, suppressing MCP-1 transcription and decreasing macrophage infiltration (22). To investigate the regulation of renal inflammatory pathways by diabetes and PPARδ, and the roles of Bcl-6 and PPARδ in these processes, we performed in vitro studies using RAW macrophages. qRT-PCR analyses revealed that the high-glucose medium strongly inhibited Bcl-6 expression in RAW macrophages and that GW0742 treatment significantly attenuated this inhibition in macrophages (Fig. 5A). We found that macrophages exposed to high glucose had an increase in nuclear PPARδ protein and that pretreatment with GW0742 completely abolished this effect (Fig. 5B). Western blot analyses of total and PPARδ-bound Bcl-6 in macrophage nuclear extracts revealed that high glucose tended to suppress total Bcl-6 but markedly increased PPARδ–Bcl-6 complexes and that GW0742 pretreatment decreased PPARδ–Bcl-6 binding (Fig. 5C). These data indicate that high glucose can increase nuclear PPARδ–Bcl-6 binding, limiting the amount of free Bcl-6 available to repress the expression of inflammatory genes normally suppressed by Bcl-6.
FIG. 5.
High glucose suppresses Bcl-6 expression in RAW macrophages. A: mRNA isolated from macrophages was analyzed by quantitative RT-PCR. Bcl-6 expression was normalized to GAPDH. Data are means ± SE. *P < 0.05. B: High glucose increases and GW0742 decreases macrophage PPARδ protein expression. PPARδ expression was normalized to that of TBP. Data are means ± SE. *P < 0.05. C: Bcl-6 protein expression and PPARδ–Bcl-6 interaction in macrophages in response to high glucose and/or GW0742. The Bcl-6–PPARδ interaction was analyzed by Western blotting of total and PPARδ-bound Bcl-6 in macrophage nuclear proteins after pull-down assays. Bcl-6 expression was normalized to that of TBP. Data are means ± SE. *P < 0.05.
Inflammatory gene expression in RAW macrophages.
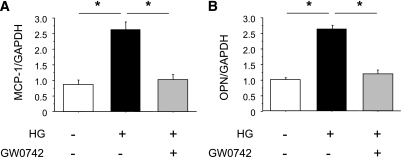
To further investigate the role of PPARδ activation in inflammatory processes, we examined the effects of GW0742 on inflammatory gene expression in macrophages. Consistent with the changes in free Bcl-6, high glucose–stimulated MCP-1 expression, which is regulated by Bcl-6, was attenuated by GW0742 (Fig. 6A). The expression of OPN, a macrophage chemokine, was also increased by exposure to high glucose and suppressed by GW0742 (Fig. 6B).
FIG. 6.
GW0742 suppresses MCP-1 (A) and OPN (B) mRNA expression in RAW macrophages. mRNA isolated from macrophages was analyzed by quantitative RT-PCR. MCP-1 and OPN expression was normalized to GAPDH. Data are means ± SE. *P < 0.05.
DISCUSSION
In the current study, we demonstrated that the PPARδ agonist GW0742 ameliorated albuminuria, glomerular mesangial expansion, and type IV collagen accumulation without affecting blood glucose levels in STZ–induced diabetic mice. GW0742 treatment markedly decreased macrophage infiltration in diabetic kidney and the expression of inflammatory genes, including MCP-1, TGF-β, and OPN. Furthermore, in vitro studies with RAW macrophages revealed that high glucose suppressed the expression of free Bcl-6, which was associated with increased expression of MCP-1 and OPN, and that GW0742 reversed these effects. Our findings suggest that the activation of PPARδ has an anti-inflammatory effect in diabetic kidneys and prevents the development of nephropathy, independently of blood glucose levels.
The nuclear receptor transcription factors PPARγ, PPARα, and PPARδ are critical in regulating insulin sensitivity, adipogenesis, lipid metabolism, and inflammation (11). All three PPAR isoforms have been proposed as therapeutic targets for the treatment of metabolic syndrome, dyslipidemia, and diabetes (11). Several recent clinical studies have provided evidence that thiazolidinedione, PPARγ agonists, and fibrates, PPARα agonists, confer a renoprotective effect in patients with type 2 diabetes (23–25). Experimental studies have also shown beneficial effects of PPARγ agonists on renal injury in type 1 and type 2 diabetic animal models, and multiple mechanisms seem to be involved (26,27). We previously demonstrated that the PPARγ agonist pioglitazone ameliorates diabetic nephropathy by inhibiting cell cycle–dependent hypertrophy of podocytes by reducing Bcl-2 and p27Kip1 protein levels (13) and by suppressing ICAM-1 expression and macrophage infiltration by inhibiting nuclear factor-κB activation in endothelial cells (14). PPARα agonists also have renoprotective effects by reducing TGF-β and plasminogen activator inhibitor-1 expression in mesangial cells (15). However, unlike PPARγ and PPARα, little is known about the therapeutic potential of PPARδ agonists in diabetic nephropathy.
Many studies have proposed an important role of inflammatory processes in the pathogenesis of diabetic nephropathy (6,7). We previously reported macrophage infiltration and increased expression of leukocyte adhesion molecules in the kidneys of patients with diabetic nephropathy in addition to mesangial matrix expansion and interstitial fibrosis (8). We have also described the importance of ICAM-1–dependent infiltration of macrophages into the kidney in the pathogenesis of diabetic nephropathy in a series of studies (9,28). Furthermore, we have demonstrated that SR-A–deficient mice are protected from renal injury after induction of diabetes by inhibiting macrophage migration into diabetic kidneys (10). Other studies have reported that the chemokine MCP-1 plays an important role in the pathogenesis of diabetic nephropathy (29). The importance of MCP-1 in the early development of diabetic nephropathy has been determined using animal models incorporating genetically deficient mice or therapeutic blockade of the MCP-1 receptor CCR2 (18,19,30). In the current study, MCP-1 expression in the kidney was increased in diabetic mice and suppressed by the administration of GW0742. PPARδ activation has been suggested to reduce MCP-1 and subsequently reduces the number of recruited macrophages in diabetic glomeruli and interstitium.
In this study, we found that diabetes significantly increased PPARδ expression in the kidney, and that high glucose increased PPARδ expression in cultured RAW macrophages. In contrast to our observations, Yu et al. (31) reported a decrease in PPARδ gene and protein expression in the myocardium of diabetic rats. On the other hand, several investigators observed an increase in PPARδ expression in the lung (32), diaphragm (33), and aorta (16) in diabetic animals. Taken together, these results suggest that PPARδ expression in the diabetic state differs between individual tissues and may depend on the balance between the two major fuel utilization pathways (i.e., glucose vs. fatty acid metabolism and their cross-talk) (33). The mechanisms by which high glucose increases the expression of PPARδ remain unclear, and further studies are needed.
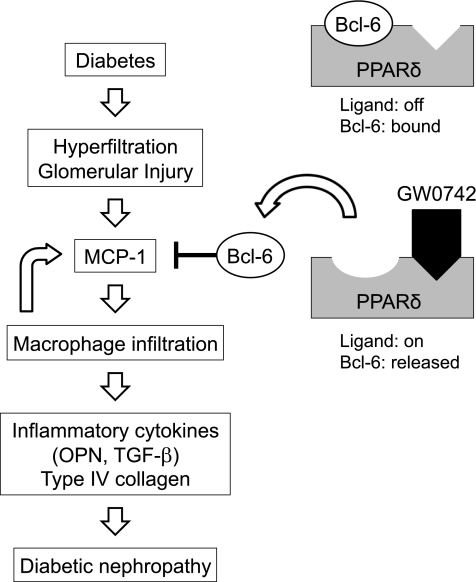
Unliganded PPARδ, which binds to the anti-inflammatory transcriptional repressor Bcl-6, reduces the amount of free Bcl-6 available to suppress MCP-1 transcription, thus increasing MCP-1 expression (22). We showed that administration of the PPARδ agonist GW0742 substantially attenuated STZ–induced diabetic nephropathy without altering the blood glucose level and increased the renal expression of Bcl-6, which was associated with suppression of MCP-1 gene expression in the kidney. We have searched for the PPRE in the promoter region of Bcl-6, but have been unable to locate any PPRE sites. Thus, we speculate that activation of PPARδ may induce other transcriptional factors, which induce Bcl-6 gene expression. Moreover, immunoprecipitation and Western blotting revealed that high glucose increased the PPARδ–Bcl-6 complex, reducing the amount of free Bcl-6 in cultured macrophages. Activation of PPARδ by GW0742 decreased PPARδ–Bcl-6 binding and increased the amount of free Bcl-6, which consecutively decreased MCP-1 expression in macrophages. Based on these in vivo and in vitro data, inhibition of MCP-1 expression by PPARδ agonists is likely mediated through increased expression of Bcl-6 (Fig. 7).
FIG. 7.
Schematic diagram showing the mechanisms involved in the renoprotective effects of PPARδ in diabetic nephropathy. The anti-inflammatory transcriptional repressor Bcl-6 represses the expression of MCP-1. PPARδ activation by GW0742 releases Bcl-6, which is associated with suppression of MCP-1, to attenuate macrophage infiltration, inflammatory gene expression, and type IV collagen accumulation in the kidney.
OPN acts as a chemokine and as a proinflammatory cytokine (34). We previously demonstrated that OPN expression was increased in diabetic kidneys and suppressed by SR-A deficiency (10). Other studies have shown that OPN is expressed in renal resident cells and is regarded as a key molecule in the pathogenesis of diabetic nephropathy (20,21). In this study, consistent with the changes in MCP-1 expression, high glucose–induced OPN expression in macrophages was attenuated by GW0742. Therefore, inhibition of OPN expression by PPARδ agonists may contribute, at least in part, to the beneficial renal effects of PPARδ agonists in diabetic nephropathy.
In conclusion, the data presented in this study indicate that PPARδ activation attenuates high glucose–induced expression of MCP-1 and OPN by increasing the anti-inflammatory repressor Bcl-6 in macrophages. The PPARδ agonist GW0742 shows renoprotective effects through its anti-inflammatory activity by inhibiting MCP-1 expression and macrophage infiltration in the diabetic kidney. Because MCP-1 is a key component in the inflammatory response and the recruitment of monocytes/macrophages into the diabetic kidney, inhibition of MCP-1 expression by PPARδ agonist could provide a potential therapeutic target in human diabetic nephropathy.
ACKNOWLEDGMENTS
This study was supported in part by a Grant-in-Aid for Young Scientists (B) from the Ministry of Education, Culture, Sports, Science, and Technology, Japan, to D.O. (21790813). This work was supported by the Takeda Science Foundation and the Naito Foundation. No other potential conflicts of interest relevant to this article were reported.
Y.M. conducted the research and contributed to discussion. D.O. wrote the manuscript, conducted research, and contributed to discussion. J.W. contributed to discussion and reviewed and edited the manuscript. N.Y. conducted research. K.S. contributed to discussion. C.S., H.T., and N.T. conducted research. H.M. contributed to discussion and reviewed and edited the manuscript.
The authors thank Dr. Yasunori Takata (Ehime University, Japan) for helpful discussions.
REFERENCES
- 1.Declèves AE, Sharma K. New pharmacological treatments for improving renal outcomes in diabetes. Nat Rev Nephrol 2010;6:371–380 [DOI] [PubMed] [Google Scholar]
- 2.Dunlop M. Aldose reductase and the role of the polyol pathway in diabetic nephropathy. Kidney Int Suppl 2000;77:S3–S12 [DOI] [PubMed] [Google Scholar]
- 3.Koya D, Jirousek MR, Lin YW, Ishii H, Kuboki K, King GL. Characterization of protein kinase C beta isoform activation on the gene expression of transforming growth factor-beta, extracellular matrix components, and prostanoids in the glomeruli of diabetic rats. J Clin Invest 1997;100:115–126 [DOI] [PMC free article] [PubMed] [Google Scholar]
- 4.Yang CW, Vlassara H, Peten EP, He CJ, Striker GE, Striker LJ. Advanced glycation end products up-regulate gene expression found in diabetic glomerular disease. Proc Natl Acad Sci U S A 1994;91:9436–9440 [DOI] [PMC free article] [PubMed] [Google Scholar]
- 5.Sharma K, Ziyadeh FN. Hyperglycemia and diabetic kidney disease: the case for transforming growth factor-beta as a key mediator. Diabetes 1995;44:1139–1146 [DOI] [PubMed] [Google Scholar]
- 6.Saraheimo M, Teppo AM, Forsblom C, Fagerudd J, Groop PH. Diabetic nephropathy is associated with low-grade inflammation in type 1 diabetic patients. Diabetologia 2003;46:1402–1407 [DOI] [PubMed] [Google Scholar]
- 7.Nelson CL, Karschimkus CS, Dragicevic G, et al. Systemic and vascular inflammation is elevated in early IgA and type 1 diabetic nephropathies and relates to vascular disease risk factors and renal function. Nephrol Dial Transplant 2005;20:2420–2426 [DOI] [PubMed] [Google Scholar]
- 8.Hirata K, Shikata K, Matsuda M, et al. Increased expression of selectins in kidneys of patients with diabetic nephropathy. Diabetologia 1998;41:185–192 [DOI] [PubMed] [Google Scholar]
- 9.Okada S, Shikata K, Matsuda M, et al. Intercellular adhesion molecule-1-deficient mice are resistant against renal injury after induction of diabetes. Diabetes 2003;52:2586–2593 [DOI] [PubMed] [Google Scholar]
- 10.Usui HK, Shikata K, Sasaki M, et al. Macrophage scavenger receptor-a-deficient mice are resistant against diabetic nephropathy through amelioration of microinflammation. Diabetes 2007;56:363–372 [DOI] [PubMed] [Google Scholar]
- 11.Lee CH, Olson P, Evans RM. Minireview: lipid metabolism, metabolic diseases, and peroxisome proliferator-activated receptors. Endocrinology 2003;144:2201–2207 [DOI] [PubMed] [Google Scholar]
- 12.Guan Y. Peroxisome proliferator-activated receptor family and its relationship to renal complications of the metabolic syndrome. J Am Soc Nephrol 2004;15:2801–2815 [DOI] [PubMed] [Google Scholar]
- 13.Okada T, Wada J, Hida K, et al. Thiazolidinediones ameliorate diabetic nephropathy via cell cycle-dependent mechanisms. Diabetes 2006;55:1666–1677 [DOI] [PubMed] [Google Scholar]
- 14.Ohga S, Shikata K, Yozai K, et al. Thiazolidinedione ameliorates renal injury in experimental diabetic rats through anti-inflammatory effects mediated by inhibition of NF-kappaB activation. Am J Physiol Renal Physiol 2007;292:F1141–F1150 [DOI] [PubMed] [Google Scholar]
- 15.Park CW, Zhang Y, Zhang X, et al. PPARalpha agonist fenofibrate improves diabetic nephropathy in db/db mice. Kidney Int 2006;69:1511–1517 [DOI] [PubMed] [Google Scholar]
- 16.Takata Y, Liu J, Yin F, et al. PPARdelta-mediated antiinflammatory mechanisms inhibit angiotensin II-accelerated atherosclerosis. Proc Natl Acad Sci U S A 2008;105:4277–4282 [DOI] [PMC free article] [PubMed] [Google Scholar]
- 17.Barish GD, Atkins AR, Downes M, et al. PPARdelta regulates multiple proinflammatory pathways to suppress atherosclerosis. Proc Natl Acad Sci U S A 2008;105:4271–4276 [DOI] [PMC free article] [PubMed] [Google Scholar]
- 18.Chow FY, Nikolic-Paterson DJ, Ozols E, Atkins RC, Rollin BJ, Tesch GH. Monocyte chemoattractant protein-1 promotes the development of diabetic renal injury in streptozotocin-treated mice. Kidney Int 2006;69:73–80 [DOI] [PubMed] [Google Scholar]
- 19.Chow FY, Nikolic-Paterson DJ, Ma FY, Ozols E, Rollins BJ, Tesch GH. Monocyte chemoattractant protein-1-induced tissue inflammation is critical for the development of renal injury but not type 2 diabetes in obese db/db mice. Diabetologia 2007;50:471–480 [DOI] [PubMed] [Google Scholar]
- 20.Susztak K, Böttinger E, Novetsky A, et al. Molecular profiling of diabetic mouse kidney reveals novel genes linked to glomerular disease. Diabetes 2004;53:784–794 [DOI] [PubMed] [Google Scholar]
- 21.Lorenzen J, Shah R, Biser A, et al. The role of osteopontin in the development of albuminuria. J Am Soc Nephrol 2008;19:884–890 [DOI] [PMC free article] [PubMed] [Google Scholar]
- 22.Lee CH, Chawla A, Urbiztondo N, et al. Transcriptional repression of atherogenic inflammation: modulation by PPARdelta. Science 2003;302:453–457 [DOI] [PubMed] [Google Scholar]
- 23.Iglesias P, Díez JJ. Peroxisome proliferator-activated receptor gamma agonists in renal disease. Eur J Endocrinol 2006;154:613–621 [DOI] [PubMed] [Google Scholar]
- 24.Sarafidis PA, Bakris GL. Protection of the kidney by thiazolidinediones: an assessment from bench to bedside. Kidney Int 2006;70:1223–1233 [DOI] [PubMed] [Google Scholar]
- 25.Fried LF, Orchard TJ, Kasiske BL. Effect of lipid reduction on the progression of renal disease: a meta-analysis. Kidney Int 2001;59:260–269 [DOI] [PubMed] [Google Scholar]
- 26.Isshiki K, Haneda M, Koya D, Maeda S, Sugimoto T, Kikkawa R. Thiazolidinedione compounds ameliorate glomerular dysfunction independent of their insulin-sensitizing action in diabetic rats. Diabetes 2000;49:1022–1032 [DOI] [PubMed] [Google Scholar]
- 27.Nicholas SB, Kawano Y, Wakino S, Collins AR, Hsueh WA. Expression and function of peroxisome proliferator-activated receptor-gamma in mesangial cells. Hypertension 2001;37:722–727 [DOI] [PubMed] [Google Scholar]
- 28.Sugimoto H, Shikata K, Hirata K, et al. Increased expression of intercellular adhesion molecule-1 (ICAM-1) in diabetic rat glomeruli: glomerular hyperfiltration is a potential mechanism of ICAM-1 upregulation. Diabetes 1997;46:2075–2081 [DOI] [PubMed] [Google Scholar]
- 29.Tesch GH. MCP-1/CCL2: a new diagnostic marker and therapeutic target for progressive renal injury in diabetic nephropathy. Am J Physiol Renal Physiol 2008;294:F697–F701 [DOI] [PubMed] [Google Scholar]
- 30.Kanamori H, Matsubara T, Mima A, et al. Inhibition of MCP-1/CCR2 pathway ameliorates the development of diabetic nephropathy. Biochem Biophys Res Commun 2007;360:772–777 [DOI] [PubMed] [Google Scholar]
- 31.Yu BC, Chang CK, Ou HY, Cheng KC, Cheng JT. Decrease of peroxisome proliferator-activated receptor delta expression in cardiomyopathy of streptozotocin-induced diabetic rats. Cardiovasc Res 2008;80:78–87 [DOI] [PubMed] [Google Scholar]
- 32.Huang CJ, Liu IM, Cheng JT. Increase of peroxisome proliferator-activated receptor delta gene expression in the lungs of streptozotocin-induced diabetic rats. Pulm Pharmacol Ther 2007;20:69–74 [DOI] [PubMed] [Google Scholar]
- 33.Salvi N, Guellich A, Michelet P, et al. Upregulation of PPARbeta/delta is associated with structural and functional changes in the type I diabetes rat diaphragm. PLoS ONE 2010;5:e11494. [DOI] [PMC free article] [PubMed] [Google Scholar]
- 34.Denhardt DT, Giachelli CM, Rittling SR. Role of osteopontin in cellular signaling and toxicant injury. Annu Rev Pharmacol Toxicol 2001;41:723–749 [DOI] [PubMed] [Google Scholar]


