Abstract
Arsenic trioxide (ATO) is a well-known inhibitor of cell proliferation. Preclinical and clinical studies showed that ATO has anti-myeloma effects. However, the underlying mechanism remains elusive. In this study, the molecular mechanisms of ATO-induced myeloma apoptosis were explored on four myeloma cell lines of wild-type or mutant p53 status and also on six primary myeloma cells. ATO induced potent inhibition of myeloma cell growth and myeloma cell apoptosis compared with controls. Further investigation showed that ATO downregulated c-Myc and phosphorylated (p)-Rb while upregulating p53, p21Cip1 and p27Kip1 proteins, resulting in G0/G1 or G2/M cell cycle arrest. ATO treatment increased mRNA levels of interferon regulatory factor-1 and TRAIL, as well as protein levels of caspase 8 and cleaved caspase 3, indicating the involvement of the extrinsic apoptotic pathway in the mutated p53 myeloma cells. ATO also activated caspases 3 and 9, indicating involvement of the intrinsic apoptotic pathway in the wild type p53 myeloma cells. More importantly, these molecular changes induced by ATO-treated myeloma cells are very similar to the baseline expression pattern of hyperdiploid myeloma, which has a relative good prognosis with high expression of TRAIL and interferon related genes. Together, our data suggest that ATO induces apoptosis in multiple myeloma through either extrinsic or intrinsic signaling pathway, depending on the p53 genetic background. These observations may be employed as prognostic tools and lead to novel therapies in primary myelomas.
Key words: arsenic trioxide, myeloma, TRAIL, p53, apoptosis, extrinsic signaling pathway, intrinsic signaling pathway
Introduction
The standard treatments for multiple myeloma (MM) patients include high-dose chemotherapy in combination with complimentary autologous stem cell transplantation or bone marrow transplant. However, MM remains largely incurable with current therapeutic strategies.1–5 Clinical outcomes of patients with MM are extremely heterogeneous, with survival ranging from only several months to more than 15 years.4–6 Even with the recent new drugs, such as thalidomide, lenalidomid and bortezomib, most MM patients still relapse with an average survival time of 4–7 years.7 Therefore, development of new treatment to extent patient survival and possibly cure MM is needed.
Arsenic compounds have been applied for over 2000 years in traditional Chinese medicine for the treatment of syphilis, arthritis and psoriasis. Since the 18th century, solutions of arsenic and potassium bicarbonate have been used to treat leukemia until more potent cytotoxic chemotherapies were discovered.8 Arsenic trioxide (ATO) was recently rediscovered as a therapeutic method to treat hematologic cancers, specifically acute promyelocytic leukemia (APL). Like all-trans retinoic acid (ATRA), another typical drug for APL, ATO has been shown to induce differentiation and apoptosis of APL both in vitro and in vivo due to the t(15;17) translocation involving promyelocytic leukemia (PML) protein and PML-retinoic acid receptor α (RARα) protein.9,10 In addition, ATO has been shown to be cytotoxic to cells of ATRA-resistant APL patients, suggesting its effectiveness in cancerous cells lacking the t(15;17) translocation such as MM.11
The purpose of this study was to determine the efficacy of ATO in inducing cell growth inhibition, cell cycle arrest and apoptosis in MM cells. ATO was reported to inactivate the nuclear factor kappa B (NFκB) signaling pathway and to have pro-apoptotic activities by the disruption of mitochondrial inner trans-membrane potential.12 However, the molecular mechanisms of ATO on MM cell growth and apoptosis remain largely unclear. In this study, we demonstrate that tumor necrosis factorrelated apoptosis-inducing ligand (TRAIL) is the key molecule regulating MM cell growth and apoptosis. This discovery was further supported in a subtype of primary myeloma and may lead to a novel therapy.
Results
ATO induces dose- and time-dependent cell growth arrest and decreases cell viability.
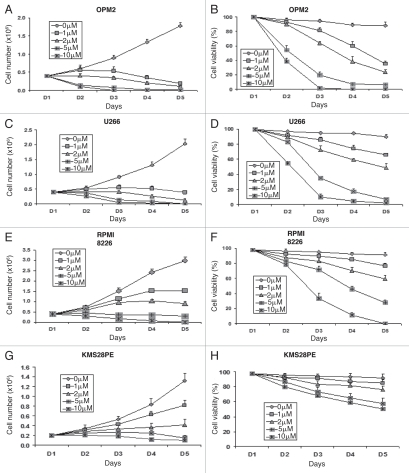
In order to evaluate the effect of ATO on MM, cell proliferation was assessed using a wide variety of concentrations: 0, 1, 2, 5 and 10 µM. ATO greatly inhibited cell proliferation and induced cell apoptosis in all four tested myeloma cell lines: OPM2, U266, RPMI8226 and KMS28PE. Cell growth was dramatically inhibited within 3 days after treatment with 1, 2, 5 and 10 of ATO (Fig. 1A and C, E and H), whereas the control cells continued to grow as expected. The trypan blue exclusion assay showed massive cell death occurring within 4 days in all cells treated with 1, 2, 5 and 10 µM of ATO, while the control cells maintained >95% viability (Fig. 1B and D, F and I).
Figure 1.
ATO induces dose- and time-dependent cell growth arrest and decreases cell viability. MM cell lines were treated with ATO to evaluate the effects of the drug on cell proliferation (A, C, E and H) and cell viability (B, D, F and I) in OPM2 (A and B), U266 (C and D), RPMI8226 (E and F) and KMS28PE (H and I). Total number of cells and cell viability were evaluated every day for 4 days using trypan blue exclusion. Error bars represent standard error of the mean for three independent experiments.
ATO induces myeloma cell apoptosis through either extrinsic or intrinsic signaling pathway.
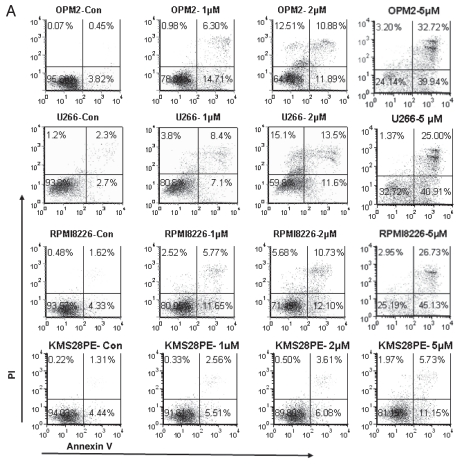
Flow cytometry analysis was performed to detect the percentage of cells undergoing apoptosis by using Annexin V and PI staining. Myeloma cell lines OPM2, U266 and RPMI8226, which have mutant p53 and KMS28PE, which has wild type p53, were incubated with 0, 1, 2 and 5 µM of ATO for 24 hrs. ATO induced relatively strong apoptosis in OPM2, U266 and RPMI8226 myeloma cell lines when compared to controls (p < 0.05) while KMS28PE experienced a more moderate apoptosis (Fig. 2A).
Figure 2.
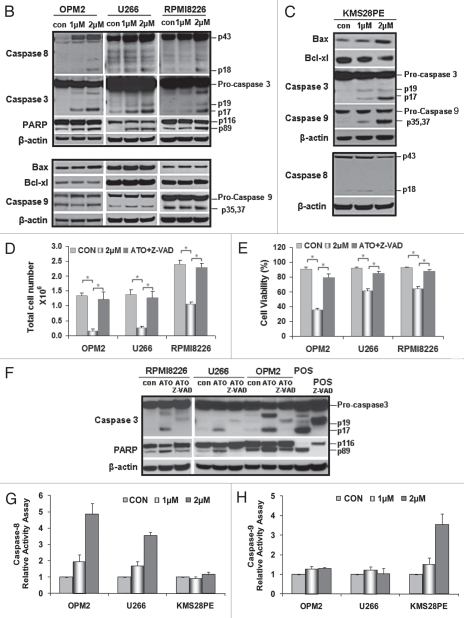
ATO induces myeloma cell apoptosis through an extrinsic or intrinsic signaling pathway. Flow cytometry was performed on fresh cells after drug exposure for 24 hrs and staining with annexin V and PI. (B) The hallmark downstream effectors of apoptosis, PARP, caspase 8 and caspase 3, were evaluated by western blot analysis on whole cell lysate derived from the aliquots of treated plasma cells from all cell lines. All were shown to have an increase in the levels of their cleaved forms after 48 hrs of ATO exposure. However, genes that are considered to play a role in an intracellular apoptotic signaling pathway were also tested for any changes in their protein levels after 48 hrs of treatment. Bax, Bcl-xL and caspase 9 were not activated by ATO in these cell lines with mutant p53. (C) There seems to be an activated intrinsic pathway in KMS28PE cells because related proteins were shown to fluctuate in expressions. Caspase 3 and caspase 9 expressions increased; Bcl-xL decreased in expression. On the other hand, the expression of caspase 8 did not alter, suggesting that the extrinsic signaling pathway was not activated. MM cell lines were treated with a pan-caspase inhibitor for 48 hrs, the inhibitor was able to reverse the effects of ATO on MM growth (D) and MM cell viability (E) for the three cell lines. *p < 0.05. (F) Western blot analysis showed that the cleavage of caspase 3 and PARP were reduced by the pan-caspase inhibitor. Caspase 8 and caspase 9 activity assays were performed in order to further confirm the validity of an extrinsic signaling pathway. (G) Caspase 8 activity increased exponentially as the dosage increased for OPM2 and U266 while it remained unchanged for KMS28PE. (H) On the other hand, there is no difference in the amount of caspase 9 activated ATO-treated cells and the control for OPM2 and U266. The activity of caspase 9 increased drastically with ATO treatment.
To gain insight into the apoptotic mechanisms of ATO in myeloma cells, we explored whether ATO-induced apoptosis was related to caspase activation. Monitoring cleavage of caspases by western blot analysis revealed that ATO enhanced the processing of caspase 3, caspase 8 and PARP in myeloma cells OPM2, U266 and RPMI8226 (Fig. 2B). On the other hand, casepases 3 and 9 were activated in the KMS28PE cells with wild-type p53 while the expression of caspase 8 remained unchanged (Fig. 2C). We also found that there was no detectable change in the expressions of caspase 9, Bax and Bcl-xL in myeloma cell lines OPM2, U266 and RPMI8226 (Fig. 2B) treated with ATO, indicating that an intrinsic apoptotic pathway was not activated. In KMS28PE cells, however, an intrinsic apoptotic pathway was activated because expressions of Bax and caspase 9 increased while the expressions of the pro-survival protein associated with the intrinsic signaling pathway, Bcl-xL, decreased with ATO treatment. This difference in signaling activation was due to the fact that KMS28PE has wild type p53. Taken together, ATO induces myeloma cell apoptosis through either an extrinsic or intrinsic signaling pathway.
The caspase-dependent mechanism of apoptosis was further confirmed by treating ATO-treated cells with the pan-caspase inhibitor Z-VAD-fmk, which significantly decreased the amount of apoptotic cells (Fig. 2D and E) and reduced caspase 3 and PARP protein cleavage (Fig. 2F). This confirms the prominent role that caspases play in the induction of programmed MM cell death. Caspase 8 and caspase 9 relative activity assay were performed and it further demonstrated that an extrinsic signaling pathway was activated in OPM2 and U266. Caspase 8 activity increased exponentially with the increase in dosage while caspase 9 activity remained stagnant (Fig. 2G and H). In KMS28PE, however, caspase 8 activity was not affected by ATO treatment while the activity of caspase 9 increased exponential when ATO was introduced.
IR F-1/TRAI L axis mediates ATO anticancer signaling.
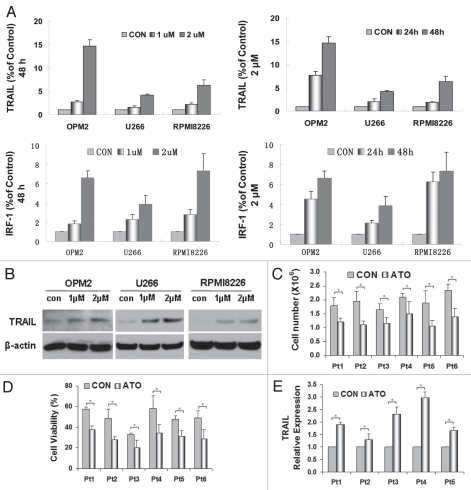
In an attempt to further elucidate the mechanisms through which ATO induced apoptosis, IRF-1 and TRAIL were tested for their mRNA expressions by using real-time PCR. IRF-1 and TRAIL were significantly upregulated by ATO in a time- and dose-dependent manner when compared to controls (Fig. 3A). Consistent with the activation of caspases 3 and 8, the observed upregulation of TRAIL and IRF-1 further indicates that ATO induces the activation of extrinsic apoptotic signaling in the three myeloma cells expressing mutated p53. When the protein expression of TRAIL is tested, the result suggests that TRAIL plays an active role in the induction of ATO-induced apoptosis. TRAIL expressions of OPM2, U266 and RPMI8226 increased as the dosage of ATO increased (Fig. 3B).
Figure 3.
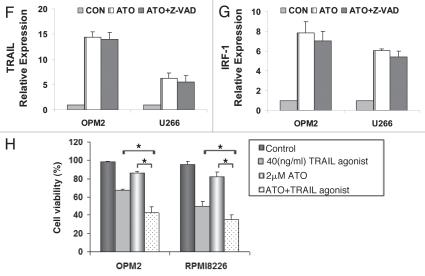
ATO increased gene expression of IRF-1 and TRAIL. (A) RT-PCR was performed to detect the initiation point of ATO-induced apoptotic signaling pathways in myeloma cells of OPM2, U266 and RPMI8226. The control value was set as 100% and other values were calculated in comparison with the control. The gene expression of IRF-1 and TRAIL increased in a dose- and time-dependent manner. (B) Western blot was performed to detect the changes in the protein expressions of TRAIL in the three cell lines after 48 hrs of drug exposure. All were shown to increase as the dosage of ATO increased. The effect of ATO was tested on primary myeloma cells from six patients after addition of 2 µM ATO in 24 hrs. (C) ATO inhibited primary myeloma cell growth and (D) reduced primary myeloma cell viability. (E) TRAIL mRNA expressions is upregulated in primary myeloma cells after ATO treatment, similar to what was observed in myeloma cell lines. After Z-VAD was added, (F) TRAIL and (G) IRF-1 relative gene expressions did not alter significantly when compared to cells treated only with ATO. (H) Recombinant human TRAIL/Apo2L (rhTRAIL) that is the ligand of the TRAIL receptors DR4 and DR5 was proved to have a synergetic effect on MM apoptosis when given in combination with ATO for 24 hrs. ATO and the rhTRAIL protein showed a synergistic effects on cell death (*p < 0.05).
We also tested TRAIL expression in primary myeloma cells with and without ATO treatment. In all six samples, 2 µM of ATO inhibited cell proliferation and induced apoptosis within 24 hrs (Fig. 3C and D). Similar to the results shown in the myeloma cell lines, the TRAIL expression was significantly upregulated in primary myeloma cells (p < 0.05), (Fig. 3E).
We blocked MM cell death with Z-VAD-fmk and performed real-time PCR on TRAIL and IRF-1. As expected, the gene expressions of TRAIL and IRF-1 did not alter that much with the addition of Z-VAD (Fig. 3F and G).
Given the prominent role TRAIL plays in the ATO-induced apoptosis, we investigated whether TRAIL agonists could synergize with ATO in the killing of MM cells. Recombinant human TRAIL/Apo2L that is agonistic to the TRAIL receptors DR4 and DR5 was used. OPM2 and RPMI8226 cells were counted after 24 hrs with ATO, TRAIL agonist and also with both of them combined (Fig. 3H). Cell viability was calculated thereafter and as expected, those cells treated with both ATO and TRAIL agonists exhibited the lowest viability. Combination Index (CI) was calculated using CalcuSyn software. A combination index less than 1 indicates synergy and a combination index greater than 1 indicates antagonism. The index for OPM2 was 0.62 and RPMI8226 has an index of 0.79 (p < 0.05), demonstrating that the usage of ATO and TRAIL agonist together has a synergistic effect.
The ATO-target gene TRAIL signature is of prognostic relevance and uniquely activated in the hyperdiploid subtype of myeloma.
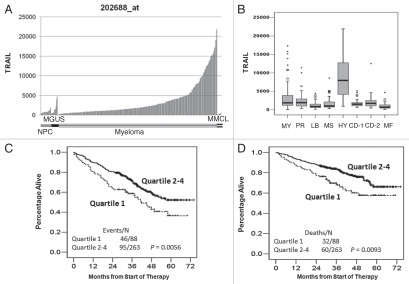
We studied GEP of CD138+ bone marrow plasma cells from 22 healthy individuals (NPC), 44 patients with MGUS, 351 newly diagnosed MM patients and nine myeloma cell lines (MMCLs). When comparing TRAIL expression among these groups, the median signals from NPC, MGUS, MM and MMCL were 758 (range: 427–1,805), 970 (range: 337–4,701), 1815 (range: 59–21,930) and 246 (range: 98–652), respectively. Clearly, NPC had very low or undetectable TRAIL expression, but there was a progressive increase in TRAIL expression in MGUS and the highest expression was observed in MM (p < 0.0001) (Fig. 4A). However, the expression of TRAIL decreased in MMCL when compared to primary myeloma (p < 0.0001).
Figure 4.
TRAIL expression is increased in the hyperdiploid subtype of myeloma and is of good prognostic relevance. (A) Sample groups of NPC (n = 22), MGUS (n = 44), MM (n = 351) and MMCL (n = 9) are shown on bar-view along the x-axis, and the Affymetrix-derived signal is plotted on the y-axis. The expression of TRAIL shows the low expression or undetectable in normal plasma cells and highest in primary myeloma cells. (B) TRAIL is uniquely overexpressed in the hyperdiploid myeloma subtype. Box-plot shows the correlation of the Affymetrix signal (expression level: y-axis) of TRAIL with seven myeloma subgroups and the myeloid subgroup (MY) from the 351 cases (x-axis). Top, bottom and middle lines of each box correspond to the 75th percentile (top quartile), 25th percentile (bottom quartile) and 50th percentile (median), respectively. The whiskers extend from the 10th percentile (bottom decile) and top 90th percentile (top decile). Open circles denote outliers within each group. TRAIL is uniquely overexpressed in the hyperdiploid group (HY) but not in the groups of myeloid (MY), proliferation (PR), low-bone disease (LB), MMSET/FGFR3 (MS), cyclin D1-1 (CD-1), cyclin D1-2 (CD-2) and MAF/MAF-B (MF). High expression levels of TRAIL highly positively correlated with outcome in TT2 MM patients. Samples from 351 patients with newly diagnosed MM on TT2 were divided into two groups based on TRAIL Affymetrix signal being highest 75% (quartile 2∼4) or lowest 25% (quartile 1). Kaplan-Meier showed that the myeloma patients in quartiles 2–4 had a good outcome in both event-free survival (p = 0.0056) (C) and overall survival (p = 0.0093) (D).
We have previously demonstrated that myeloma can be separated into seven distinct molecular subgroups based on global gene expression patterns and another myeloid group.13 We performed a correlation analysis between TRAIL expression and myeloma subtypes. This analysis revealed that TRAIL expression was uniquely elevated in the hyperdiploid myelomas (HY) (Fig. 4B). The HY subtype was associated with a hyperdiploid karyotype in more than 90% of the cases. Genes overexpressed in this group included GNG11, TRAIL, the Wnt signaling antagonists FRZB (sFRP3) and DKK1 and the MIP1-alpha chemokine receptor CCR5. Overexpression of several interferon-induced genes, including OAS2, IFI27 and IFI35, was also characteristic of this group. Myeloma patients in this subgroup showed a favorable event-free survival (EFS) and overall survival (OS).
TRAIL expression in the 351 newly diagnosed MM patients from Total Therapy 2 clinical trial varied from an Affymterix signal output from a low of 59 to a high of 21,930.1 Kaplan-Meier analysis of event-free survival (EFS) and overall survival (OS) using expression level quartiles was used to demonstrate links to outcome. The cases with lower TRAIL expression (quartile 1) were associated with a shorter EFS and OS (Fig. 4C; p = 0.0056; and 4D; p = 0.0093, respectively).
ATO disrupts cell cycle G2/M or G0/G1 checkpoint depending on p53 status.
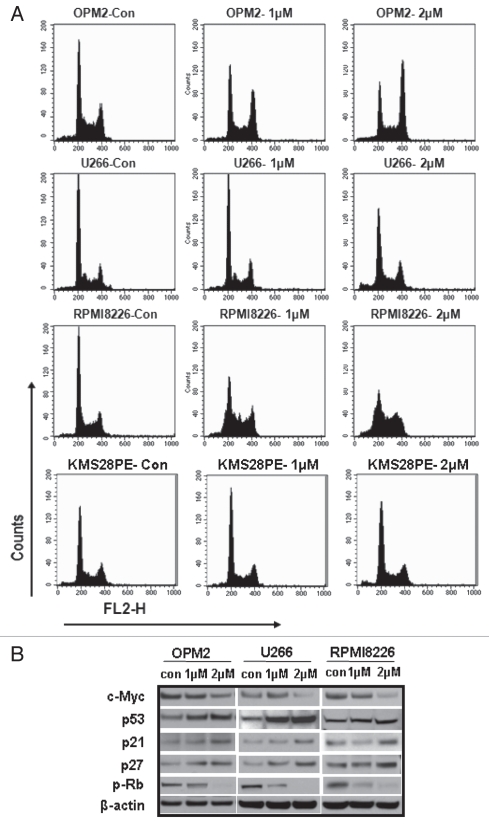
Flow cytometry was performed to monitor cell cycle changes in OPM2, U266, RPMI8226 and KMS28PE cells after 24 hrs of ATO exposure. Figure 5A shows that ATO significantly enhanced G2 to M phase accumulations (p < 0.05) in OPM2, U266 and RPMI8226 cells. ATO deregulated the G2-M transition with a significant increase in the fraction of cells with G2-M DNA content (compared with controls) after incubation with 1 and 2 µM of ATO. When the numerical percentages of each phase in the cell cycle were calculated, the results were clear (Tables 1–4). G2/M phase of U266 and RPMI8226 both increased by over 10%. OPM2 showed a much wider difference between the control and 2 µM-treated cells (from 18.84–50.08%), further validating the existence of the promotion of a G2/M arrest by ATO. It can be noted that ATO also influenced G1/S phase changes in some cell lines, most noticeably in RPMI8226. We assume that this is due to the status of p53 genetic background, such as one p53 mutation or wild-type p53 expressions. KMS28PE had a G0/G1 cell cycle arrest (Fig. 5A) which was mainly due to the p53 wild-type status.
Figure 5.
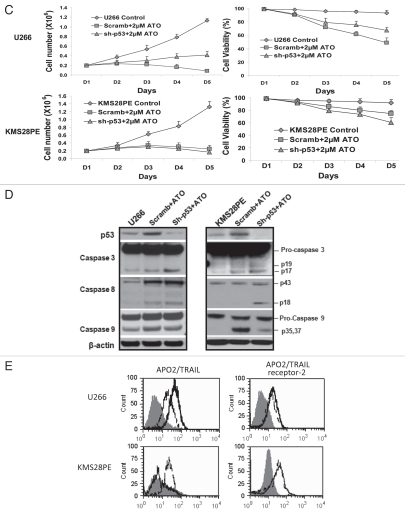
ATO disrupts cell cycle G0/G1 or G2/M checkpoint by activation of the p53 functional circuit. (A) Cell cycle distribution was evaluated by flow cytometry analysis performed after 24 hrs of ATO exposure. As the dose increased, the peak representing G2/M phase increased in width and height for OPM2, U266 and RPMI8226 while there was a G0/G1 arrest for KMS28PE. (B) Western blot analysis showed that the expression of c-Myc was downregulated in myeloma cells by 48 hrs of ATO treatment, whereas the expression of p53 and its down-stream genes was upregulated in OPM2, U266 and RPMI8226 cell lines. (C) p53 expression was silenced in both U266 (Mut p53) and KMS28PE (WT p53) cells using shRNA lentiviral delivery system. ATO induced inhibition of cell growth and viability in both wild type (KMS28PE) and mutated p53 cells (U266) after treatment with 2 µM of ATO (p < 0.05). (D) Western blots showed that p53 expression was downregulated. Caspase 8 was not increased when p53 was silenced for KMS28PE while caspase 9 was activated. (E) APO2/TRAIL and APO2/TRAIL receptor-2 are induced in myeloma cells with mutated p53. U266 (mutated p53) and KMS28PE (wt. p53) were cultured for 48 hours with or without 2 µM of ATO. Cells were stained for surface expression of APO2/TRAIL and APO2/TRAIL receptor-2 as described in the methodology section. Filled histogram = Control; solid thick line = Scramb + ATO; Dashed line = Sh-p53 + ATO. Ten-thousand cells were analyzed. One representative experiment out of three experiments is shown. ATO activated both APO2/TRAIL and APO2/TRAIL receptor-2 in myeloma cells with mutated p53 but only APO2/TRAIL receptor-2 in myeloma cells with wild type p53. When p53 is silenced, myloma cells with wild-type p53 behave the same as those with mutated p53. In this case, both APO2/TRAIL and APO2/TRAIL receptor-2 were activated for both cell lines.
Table 1.
Cell cycle distribution in OPM2
| OPM2 | G0-G1 (%) | S-phase (%) | G2-M (%) |
| 0 µM | 36.9 ± 0.5 | 44.3 ± 2.5 | 18.8 ± 1.7 |
| 1 µM | 28.8 ± 1.6 | 39.5 ± 3.5 | 31.7 ± 0.7 |
| 2 µM | 19.8 ± 0.3 | 30.2 ± 2.4 | 50.1 ± 2.1 |
Table 4.
Cell cycle distribution in KMS28PE
| KMS28PE | G0-G1 (%) | S-phase (%) | G2-M (%) |
| 0 µM | 50.75 ± 2.5 | 34.16 ± 2.8 | 15.09 ± 4.1 |
| 1 µM | 53.01 ± 1.8 | 32.74 ± 4.3 | 14.25 ± 3.2 |
| 2 µM | 63.16 ± 2.0 | 27.96 ± 2.2 | 14.88 ± 2.7 |
To examine the ATO-induced cell signaling pathways, western blot analysis was performed using total cell protein derived from OPM2, U266 and RPMI8226 cells treated with 2 µM ATO for 48 hrs. ATO increased p53 expression and decreased c-Myc expression (Fig. 5B). We further examined the expression of p53 downstream effectors including p21Cip1, p27Kip1 and phosphor-Rb (p-Rb). As shown in Figure 5B, the expressions of p21Cip1 and p27Kip1 were significantly upregulated, whereas the expression of p-Rb was downregulated.
As one of the main tumor-suppressors, p53 plays an important role in both cell cycle arrest and apoptosis, activating genes that halt the cell cycle and also genes whose protein products can cause apoptosis. In order to illustrate such phenomenon and confirm its active role, we silenced p53 while MM cells were exposed to 2 µM of ATO. The resulting curves of cell number and viability showed that there was a visible decrease in the extent of cell death due to ATO, but not the same as those of the mock-infected control (Fig. 5C). We performed western blots on proteins related to both intracellular and extracellular apoptotic activation (Fig. 5D). In KMS28PE cells with wildtype p53, caspase 9 was activated as expected, but when p53 was silenced, caspase 8 expression increased. For U266, caspase 8 was induced for scramb + ATO as expected. Flow cytometry was used to detect the expressions of TRAIL and TRAIL receptor 2. The TRAIL and TRAIL receptor 2 were activated in the U266 cells with mutant p53, but only TRAIL was activated in the KMS28PE cells with the wild-type p53 (Fig. 5E). Interestingly, the silenced p53 KMS28PE cells showed a similar expression to the mutant p53 U266 cells after ATO treatment. Both expressions of TRAIL and TRAIL receptor 2 increased for KMS28PE cell with p53 silenced. Therefore, it can be assumed that the ATO induced cell apoptosis of wild type p53 KMS28PE cells through the intrinsic pathway with increased activity of caspases 3 and 9 switched to the extrinsic pathway with increased activity of caspases 3 and 8 after p53 silencing.
Discussion
The effects of ATO on MM cells have been investigated in a number of studies and all have shown an ATO-induces myeloma cell apoptosis.11,15–18 Previous studies on the ATO-induced apoptosis of MM cell lines mostly reported a mitochondrial apoptotic signaling pathway through which a reduced mitochondrial transmembrane potential occurred.15–17 Along with upregulations of Bax and caspase 9 and downregulations of Bcl-xL, this apoptotic pathway is considered intrinsic.35 However in this study, Bax, caspase 9 and Bcl-xL protein levels in myeloma cells with mutant p53 remained unchanged after ATO treatment in most of the cell lines. Caspase 8 activation is considered unique to the extrinsic apoptotic pathway while caspase 3 is considered to be the hallmark of apoptosis, whether intrinsic or extrinsic.19 We further found that the ATO induced cell apoptosis of wild-type KMS28PE through the intrinsic pathway with increased activity of caspases 3 and 9. However, it switched to the extrinsic pathway with increased activity of caspases 3 and 8, similar to the U266 with mutated p53, after p53 silencing.38 We are surprised that the extrinsic pathway was the major signaling in ATO induced cell apoptosis in primary myeloma, since p53 mutations are rare and may represent late events in disease progression.3–7 However, MDM2 and MDMX genes have become increasingly prominent as key regulators of p53.36,37 Consistently, overexpression of MDM2 and MDMX were observed in more than 40% of newly diagnosed myelomas using gene expression profile, suggesting the p53 inactivation in these cases (data not shown). Although we do not refute the previous conclusion established by the preponderance of literature, our results suggest that an extrinsic apoptotic signaling pathway is also a possible route for ATO to induce apoptosis. Additionally, caspase activity assays indicate that the extrinsic pathway is the dominant one.
It was interesting to see that similar cell signaling changes exist after ATO treatment of myeloma cells and the HY baseline myeloma subtype. Both have increased expression of TRAIL and interferon related genes. Hyperdiploidy is a distinct genetic entity with a good prognosis and largely devoid of common recurrent immunoglobulin-mediated translocations.20–22 Overexpression of TRAIL and several interferon-induced genes, including OAS2, IFI27 and IFI35, is characteristic of this group. Several recent reports imply a role for TRAIL in the induction of myeloma cell apoptosis. In this regard, it is noteworthy that TRAIL, a TNF superfamily member, ligates two types of receptors: death receptors triggering TRAIL-induced apoptosis (TRAIL R1 and TRAIL R2) and decoy receptors that act as sinks for TRAIL and thus inhibit this pathway (TRAIL R3 and TRAIL R4).23 Binding of TRAIL to the death-promoting receptors TRAIL R1 or TRAIL R2 results in receptor oligomerization and in apoptosis by caspase 3 activation.24
Interferons lead to apoptosis and are signaling molecules with anticancer activity.25 The interferon-induced IRF-1 further induces TRAIL activity.25 In primary myelomas of the HY subtype, the upregulation of TRAIL might be counteracted by a high osteoprotegrin production by bone marrow stromal cells and decreased expression of FAS, APAF1 and BNIP3 compared to normal bone marrow plasma cells.26 However, the activation of TRAIL pathway by ATO might reverse TRAIL inhibition and induce myeloma cell apoptosis, thus benefitting HY myeloma. It is rationale to hypothesize that ATO induced mass production of interferons, initiating the increase in p53 and TRAIL expression and activity that was seen in this study. We predict that a similar mechanism with increased expression and activation of IRF-1, p53 and TRAIL occur in the hyperdiploid myeloma subtype.
Previous studies indicated an intrinsic apoptotic signaling pathway activated and the cell cycle arrest with an increase of the sub G1 fraction.15,18 Our results, in addition, show that ATO can repress c-Myc and activate p53 expression and induce a G2-M cell cycle arrest in the majority of the cell lines used. As a transcription factor, c-Myc was reported to upregulate p53 expression and increase its activity.27 Upon activation, p53 induces increased activity of its downstream effectors such as p21Cip1 and p27Kip1, cyclin dependent kinase inhibitors (CDKIs), that serve as a negative regulators of cell cycle progression.28 These CDKIs are able to inhibit the cyclin E-cdk2 complex, which has the ability to act upon the phosphor-Rb protein.19,28 Hyperphosphorylated Rb1 interacts with E2F family transcription factors, such as E2F1, which serve as critical regulators of the cell cycle progression and promote cell cycle progression.29 By upregulating the activity of p21Cip1 and p27Kip1, Rb1 phosphorylation is inhibited through cyclin E/Cdk2 complexes; this results in inactivation of E2F1 transcription function blocks the advancement of cell cycle into the next phase.30 Such blockage is beneficial in that it keeps the malignant cells from multiplying rapidly and therefore reduces the amount of cells that ATO would have to kill.
The results found in this study identify ATO as a potential treatment for MM patients. Furthermore, they contribute to the understanding of the molecular mechanisms underlying the ATO-induced cell cycle arrest and apoptosis. Although a number of clinical studies have shown a moderate success of administering ATO to MM patients. More studies showed a synergic effect when ATO is administered in combination with other anti-MM drugs, such as bortezomib, the DNA methylation inhibitor 5-azacytidine and melphalan et al.31–34 The findings in this study offer a promising and novel strategy, using ATO to activate TRAIL, in the treatment of myelomas, especially those aggressive myeloma subtypes with low expression of TRAIL, such as MS subgroup with reciprocal translocation (4:14) and MF subgroup with reciprocal translocations (14:16) and (14:20).
Materials and methods
Cell lines and cell culture.
MM cell line OPM2, U266, RPMI8226 and KMS28PE were obtained from American Type Cell Collection (ATCC, Manssas, VA) and were maintained in RPMI1640 medium (Invitrogen, Frederick, MD) supplemented with 10% fetal bovine serum (FBS) (Atlanta Biologicals, Lawrenceville, GA) and 1% penicilin streptomycin-glutamine (Sigma Chemical, St. Louis, MO) in an atmosphere of 5% carbon dioxide at 37°C.
Purification and maintenance of primary myeloma plasma cells.
Plasma cells were obtained from heparinized bone marrow aspirates of patients with active MM during scheduled clinic visits. The institutional review board of the University of Utah School of Medicine approved these research studies and all subjects provided written informed consent approving use of their samples for research purposes. Myeloma plasma cells were isolated with CD138 immunomagnetic bead selection and automated auto-MACs Separator (Miltenyi-Biotec, Auburn, CA). CD38/CD45 flow cytometry determined that purity of plasma cells was routinely 95% or greater. Primary cell cultures were maintained in MarrowMAX Bone Marrow Medium (Invitrogen, Frederick, MD).
Reagent and drug treatment.
ATO was purchased from Sigma Chemical Company (St. Louis, MO). 0.4946 g of ATO was dissolved in 10 ml of 1.0 N NaOH, resulting in a 0.25 mM stock solution. Cell lines were seeded in wells of a 24-well plate with 0.4 × 10⁶ cells per well in 1 ml of medium. Each concentration was performed in triplicate. The ATO was diluted and then added to two wells for each of the following concentrations: 0 (control), 1, 2, 5 and 10 µM. Fresh medium with the correct ATO dosage was changed every 48 hours (hrs). Recombinant Human TRAIL/Apo2L was bought from PeproTech (Rocky Hill, NJ).
Cell proliferation assay.
After each 24 hrs for 4 days, the numbers of viable and dead cells were counted using trypan blue dye exclusion method in order to assay cell growth and viability. The dark blue cells were counted as dead while the unstained ones represented cells that were alive. The counted dead and viable cells of the two wells for each group were averaged to obtain the final number.
Analysis of cell cycle.
Cells treated with 0, 1 and 2 of ATO for 24 hrs were fixed in 75% ethanol and stored overnight in −20°C. The following day, the cells were washed with cold PBS, treated with 100 µg of RNase A (Qiagen, Hilden, Germany) and stained with 50 µg Propidium Iodide (PI) (Roche, Mannheim, Germany). Flow cytometric analysis was performed using a 3-color FACScan and CellQuest software (Becton Dickinson, San Jose, CA). For each sample, 10,000 events were gated. Data analysis was performed using Modfit LT (Verity Software House, Topsham, ME).
Evaluation of apoptosis.
Apoptosis was determined by staining cells with annexin V and PI labeling. The annexin V/PI staining assay was carried out using Vybrant® Apoptosis Assay Kit #3 according to the manufacturer's manual (Invitrogen, Frederick, MD) and was performed on cells incubated with 0, 1, 2 and 5 µM of ATO for 24 hrs.
Gene expression profiling (GEP).
Plasma cell purifications and gene expression profiling, using the Affymetrix U133Plus2.0 microarray, were performed as previously described.13,14 Signal intensities were preprocessed and normalized by GCOS1.1 software (Affymetrix).13,14 GEP of CD138+ bone marrow plasma cells from 22 healthy individuals (NPC), 44 patients with monoclonal gammopathy of undetermined significance (MGUS) and 351 newly diagnosed MM patients were published previously;13,14 and GEP from 9 nine myeloma cell lines were used in this study from the unpublished data of the University of Utah.
Real-time polymerase chain reaction (RT -PCR).
RNA was extracted using the RNeasy Kit (Qiagen, Valencia, CA). First-strand cDNA was synthesized from 1 µg purified RNA using SuperScript III RTS First-Strand cDNA Synthesis Kit (Invitrogen, Carlsbad, CA). After reverse transcription, the samples were diluted with H2O to a final volume of 500 µl. Forward and reverse primers were made by Invitrogen (Frederick, MD) according to each specific gene requested: GAPDH forward: 5′-ATG GGG AAG GTG AAG GTC GG-3′, reverse: 5′-TGG GTG GAA TCA TAT TGG AAC A-3′; interferon regulatory factor-1 (IRF-1) forward: 5′-AGC ACG GCT GGG ACA TCA AC-3′, reverse: 5′-TGC TCT TAG TGT CTC GGC TGG AC-3′; tumor necrosis factor-related apoptosis-inducing ligand (TRAIL, also referred to as Apo2L) forward: 5′-AGT GAG AGA AAG AGG TCC TCA G-3′, reverse: 5′-CCA GAG CCT TTT CAT TCT TGG A-3′. A final mixture of 25 µl for each sample consisted of the following: 12.5 µl of iTrq SYBR Green Supermix (Bio-Rad, Hercules, CA), 1 µl of forward primer, 1 µl of reverse primer, 5 µl of cDNA and 5.5 µl of H2O. RT-PCR was performed on an ABI PRISM 7900 analytical thermal cycler (Applied Biosystems, Foster City, CA) following the manufacturer's recommendations. The amount of IRF-1 or TRAIL in each sample was expressed as a relative value normalized to the sample with lower expression. The experiment was performed in triplicate and the results were expressed as the mean ± the standard error of the mean.
Western blot.
Total cell protein was isolated using Mammalian Cell Extraction Kit provided by BioVision (Mountain View, CA). Equal amounts of protein were separated by electrophoresis on 4–12% sodium dodecyl sulfate-polyacrylamide gels and western blotting was carried out using the western Breeze Chemiluminescent Immunodetection protocol as described (Invitrogen, Frederick, MD). The following primary anti-bodies were used (all were provided from Cell Signal, Danvers, MA): anti-TRAIL, anti-β-Actin, anti-c-Myc, anti-p53, anti-p27Kip1, anti-p21Cip1, anti-p-Rb, anti-caspase 8, anti-cleaved-caspase 3, anti-Bax, anti-Bcl-xL, anti-caspase 9 and anti-PARP. The following secondary anti-bodies were used (Santa Cruz Biotechnology, Santa Cruz, CA): goat anti-mouse IgG and goat anti-rabbit IgG. Additionally, western Blotting Luminol Reagent was purchased from Santa Cruz Biotechnology.
Caspase inhibition assay.
In order to confirm that ATO induced apoptosis through caspase activation, MM cells were treated with Z-VAD-fmk (R&D Systems, Minneapolis, MN), a pan-caspase inhibitor used at 100 µM after 2 µM of ATO was added. Fresh inhibitor was added for 48 hrs. All experiments were performed in triplicate. As positive control for caspase 3 for western blot, myeloma cells were treated with 10 nM of the proteasome inhibitor velcade for 24 hrs.
Caspase activity assay.
Caspase 8 and caspase 9 activities were determined using the Caspase 8 Colorimetric Assay Kit and Caspase 9 Colorimetric Assay Kit according to the manufacturer's directions (R&D systems, Minneapolis, MN). The supernatant obtained from centrifugation of lysed cells was added to the reaction mixture containing dithiothreitol and caspase 8 and 9 substrate and was incubated for 1 hr at 37°C. The absorbance of the chromophore p-nitroanilide was measured at 405 nm. The experiment was performed in triplicate for OPM2 and U266 cells.
Transfection of myeloma cell lines.
A nonsense scrambled oligonucleotide (5′-GAT CCC CGA CAC GCG ACT TGT ACC ACT TCA AGA GAG TGG TAC AAG TCG CGT GTC TTT TTA-3′) and synthetic double-stranded oligonucleotide sequences specific for p53 (5′-GAT CCC CGA CTC CAG TGG GAA CCT TCT TCA AGA GAG AAG GTT CCC ACT GGA GTC TTT TTA-3′) was obtained from OligoEngine (Seattle, WA). shRNA oligonucleotide was cloned into lentiviral pLVTH vectors (kindly provided by Didier Trono). Recombinant lentivirus was produced by transient transfection of 293T cells according to a standard protocol. Crude virus was concentrated by ultracentrifugation at 90,000 g for 100 minutes. Viral titers were determined by measuring the amount of HIV-1 p24 antigen by ELISA (NEN Life Science Products). A 99% transduction efficiency of myeloma cells was achieved with a concentration of lentiviral p24 particles of 3 µg/106 cells.
Determination of APO2/TRAI L and APO 2/TRAIL receptor-2 by immunofluorescence staining.
Cells were cultured with 2 µM of ATO following transfection with GFP or SiRNA for p53 as described above. Cultures were harvested after 48 h of treatment with ATO. Only viable cells were gated (by light scatter). Cells (5 × 10⁵) were used for indirect immunofluorescence staining for surface expression of APO2/TRAIL and APO2/TRAIL receptor-2 as described before.11 APO2/TRAIL receptor-2 antibody, Phycoerythrin (PE) conjugated (Abcam, Cambridge, UK), APO2/TRAIL antibody, PE conjugated (eBioscience, Inc., San Diego, CA), Annexin V-APC and 7-AAD (BD Pharmingen, Philippines) were used. Appropriate immunoglobulin isotype matched controls were used for each antibody. Stained cells that are considered viable are both Annexin V and 7-AAD negative were analyzed by flow cytometry (FACSCalibur, BDIS). Quantitation was performed by CellQuest software (BD Biosciences). Ten-thousand cells were analyzed.
Combination index (CI) analysis.
The existence of synergism was determined using CalcuSyn software, which calculates the combination index based on the percent cell survival at varying doses of the drug treatments, both alone and in combination. A combination index greater than 1 indicates antagonism, equal to 1 is additive and less than 1 is synergism.
Statistical analysis.
Results of experimental points obtained from multiple experiments were reported as mean. Significance levels were determined by Student's t-test. p values of 0.05 or less were considered significant.
Table 2.
Cell cycle distribution in U266
| U266 | G0-G1 (%) | S-phase (%) | G2-M (%) |
| 0 µM | 60.1 ± 4.1 | 30.2 ± 1.5 | 9.7 ± 2.8 |
| 1 µM | 65.2 ± 3.1 | 17.9 ± 3.4 | 16.9 ± 2.6 |
| 2 µM | 50.4 ± 1.0 | 28.8 ± 1.1 | 20.1 ± 1.4 |
Table 3.
Cell cycle distribution in RPMI8226
| RPMI8226 | G0-G1 (%) | S-phase (%) | G2-M (%) |
| 0 µM | 28.3 ± 2.4 | 51.8 ± 0.4 | 19.9 ± 1.8 |
| 1 µM | 43.3 ± 4.2 | 34.8 ± 2.5 | 21.8 ± 1.3 |
| 2 µM | 39.4 ± 2.6 | 27.3 ± 2.0 | 33.3 ± 2.3 |
Acknowledgements
This work was supported by grants from National Natural Science Foundation of China (30973450, J.S.), funds from Shanghai Tenth People's Hospital (J.S.), National Institutes of Health R01 CA115399 (G.T.), R01 CA152105 (F.Z.) and R21 CA143887 (F.Z.), Senior Awards from Multiple Myeloma Research Foundation (F.Z. 2008 & 2010) and institutional startup funds from the University of Utah (F.Z.). No author of this manuscript has a conflict of interest. Special thanks to Dr. Lijuan Chen for her invaluable assistance.
Abbreviations
- ATO
arsenic trioxide
- MM
multiple myeloma
- APL
acute promyelocytic leukemia
- ATRA
all-trans retinoic acid
- PML
promyelocytic leukemia
- RARα
retinoic acid receptor α
- NFκB
nuclear factor kappa B
- FBS
fetal bovine serum
- PI
propidium iodide
- GEP
gene expression profiling
- EFS
event-free survival
- OS
overall survival
- CDKIs
cyclin dependent kinase inhibitors
- MGUS
monoclonal gammopathy of undetermined significance
- NPC
normal plasma cells
References
- 1.Barlogie B, Tricot G, Anaissie E, Shaughnessy J, Rasmussen E, van Rhee F, et al. Thalidomide and hematopoietic-cell transplantation for multiple myeloma. N Engl J Med. 2006;354:1021–1030. doi: 10.1056/NEJMoa053583. [DOI] [PubMed] [Google Scholar]
- 2.Bataille R, Harousseau JL. Multiple myeloma. N Engl J Med. 1997;336:1657–1664. doi: 10.1056/NEJM199706053362307. [DOI] [PubMed] [Google Scholar]
- 3.Boccadoro M, Pileri A. Diagnosis, prognosis and standard treatment of multiple myeloma. Hematol Oncol Clin North Am. 1997;11:111–131. doi: 10.1016/s0889-8588(05)70418-4. [DOI] [PubMed] [Google Scholar]
- 4.Barlogie B, Kyle RA, Anderson KC, Greipp PR, Lazarus HM, Hurd DD, et al. Standard chemotherapy compared with high-dose chemoradiotherapy for multiple myeloma: final results of phase III US Intergroup Trial S9321. J Clin Oncol. 2006;24:929–936. doi: 10.1200/JCO.2005.04.5807. [DOI] [PubMed] [Google Scholar]
- 5.Segeren CM, Sonneveld P, van der Holt B, Vellenga E, Croockewit AJ, Verhoef GE, et al. Overall and event-free survival are not improved by the use of myeloablative therapy following intensified chemotherapy in previously untreated patients with multiple myeloma: a prospective randomized phase 3 study. Blood. 2003;101:2144–2151. doi: 10.1182/blood-2002-03-0889. [DOI] [PubMed] [Google Scholar]
- 6.Child JA, Morgan GJ, Davies FE, Owen RG, Bell SE, Hawkins K, et al. High-dose chemotherapy with hematopoietic stem-cell rescue for multiple myeloma. N Engl J Med. 2003;348:1875–1883. doi: 10.1056/NEJMoa022340. [DOI] [PubMed] [Google Scholar]
- 7.Kalmadi SR, Hussein MA. The emerging role of arsenic trioxide as an immunomodulatory agent in the management of multiple myeloma. Acta Haematol. 2006;116:1–7. doi: 10.1159/000092341. [DOI] [PubMed] [Google Scholar]
- 8.Novick SC, Warrell RP., Jr Arsenicals in hematologic cancers. Semin Oncol. 2000;27:495–501. [PubMed] [Google Scholar]
- 9.Cai X, Shen YL, Zhu Q, Jia PM, Yu Y, Zhou L, et al. Arsenic trioxide-induced apoptosis and differentiation are associated respectively with mitochondrial transmembrane potential collapse and retinoic acid signaling pathways in acute promyelocytic leukemia. Leukemia. 2000;14:262–270. doi: 10.1038/sj.leu.2401650. [DOI] [PubMed] [Google Scholar]
- 10.Evens AM, Tallman MS, Gartenhaus RB. The potential of arsenic trioxide in the treatment of malignant disease: past, present and future. Leuk Res. 2004;28:891–900. doi: 10.1016/j.leukres.2004.01.011. [DOI] [PubMed] [Google Scholar]
- 11.Liu Q, Hilsenbeck S, Gazitt Y. Arsenic trioxideinduced apoptosis in myeloma cells: p53-dependent G1 or G2/M cell cycle arrest, activation of caspase-8 or caspase-9 and synergy with APO2/TRAIL. Blood. 2003;101:4078–4087. doi: 10.1182/blood-2002-10-3231. [DOI] [PubMed] [Google Scholar]
- 12.Berenson JR, Yeh HS. Arsenic compounds in the treatment of multiple myeloma: a new role for a historical remedy. Clin Lymphoma Myeloma. 2006;7:192–198. doi: 10.3816/CLM.2006.n.058. [DOI] [PubMed] [Google Scholar]
- 13.Zhan F, Huang Y, Colla S, Stewart JP, Hanamura I, Gupta S, et al. The molecular classification of multiple myeloma. Blood. 2006;108:2020–2028. doi: 10.1182/blood-2005-11-013458. [DOI] [PMC free article] [PubMed] [Google Scholar]
- 14.Shaughnessy JD, Jr, Zhan F, Burington BE, Huang Y, Colla S, Hanamura I, et al. A validated gene expression model of high-risk multiple myeloma is defined by deregulated expression of genes mapping to chromosome 1. Blood. 2007;109:2276–2284. doi: 10.1182/blood-2006-07-038430. [DOI] [PubMed] [Google Scholar]
- 15.Chen YB, Fu WJ, Hou J, Ding SQ, Wang DX, Yuan ZG, et al. [Effects of arsenic trioxide on cell cycle and expression of cyclin dependent kinase inhibitors of multiple myeloma cells] Zhonghua Xue Ye Xue Za Zhi. 2003;24:193–196. [PubMed] [Google Scholar]
- 16.Baysan A, Yel L, Gollapudi S, Su H, Gupta S. Arsenic trioxide induces apoptosis via the mitochondrial pathway by upregulating the expression of Bax and Bim in human B cells. Int J Oncol. 2007;30:313–318. [PubMed] [Google Scholar]
- 17.Zhou Y, Huang X, Cai X. [Mechanisms of arsenic trioxide-induced apoptosis in myeloma cells] Zhonghua Zhong Liu Za Zhi. 2001;23:181–183. [PubMed] [Google Scholar]
- 18.Park WH, Seol JG, Kim ES, Hyun JM, Jung CW, Lee CC, et al. Arsenic trioxide-mediated growth inhibition in MC/CAR myeloma cells via cell cycle arrest in association with induction of cyclin-dependent kinase inhibitor, p21 and apoptosis. Cancer Res. 2000;60:3065–3071. [PubMed] [Google Scholar]
- 19.Harris SL, Levine AJ. The p53 pathway: positive and negative feedback loops. Oncogene. 2005;24:2899–2908. doi: 10.1038/sj.onc.1208615. [DOI] [PubMed] [Google Scholar]
- 20.Fonseca R, Blood E, Rue M, Harrington D, Oken MM, Kyle RA, et al. Clinical and biologic implications of recurrent genomic aberrations in myeloma. Blood. 2003;101:4569–4575. doi: 10.1182/blood-2002-10-3017. [DOI] [PubMed] [Google Scholar]
- 21.Smadja NV, Leroux D, Soulier J, Dumont S, Arnould C, Taviaux S, et al. Further cytogenetic characterization of multiple myeloma confirms that 14q32 translocations are a very rare event in hyperdiploid cases. Genes Chromosomes Cancer. 2003;38:234–239. doi: 10.1002/gcc.10275. [DOI] [PubMed] [Google Scholar]
- 22.Smadja NV, Bastard C, Brigaudeau C, Leroux D, Fruchart C. Hypodiploidy is a major prognostic factor in multiple myeloma. Blood. 2001;98:2229–2238. doi: 10.1182/blood.v98.7.2229. [DOI] [PubMed] [Google Scholar]
- 23.Johnstone RW, Frew AJ, Smyth MJ. The TRAIL apoptotic pathway in cancer onset, progression and therapy. Nat Rev Cancer. 2008;8:782–798. doi: 10.1038/nrc2465. [DOI] [PubMed] [Google Scholar]
- 24.Falschlehner C, Emmerich CH, Gerlach B, Walczak H. TRAIL signalling: decisions between life and death. Int J Biochem Cell Biol. 2007;39:1462–1475. doi: 10.1016/j.biocel.2007.02.007. [DOI] [PubMed] [Google Scholar]
- 25.Clarke N, Jimenez-Lara AM, Voltz E, Gronemeyer H. Tumor suppressor IRF-1 mediates retinoid and interferon anticancer signaling to death ligand TRAIL. EMBO J. 2004;23:3051–3060. doi: 10.1038/sj.emboj.7600302. [DOI] [PMC free article] [PubMed] [Google Scholar]
- 26.Jourdan M, Reme T, Goldschmidt H, Fiol G, Pantesco V, De Vos J, et al. Gene expression of anti- and proapoptotic proteins in malignant and normal plasma cells. Br J Haematol. 2009;145:45–58. doi: 10.1111/j.1365-2141.2008.07562.x. [DOI] [PMC free article] [PubMed] [Google Scholar]
- 27.Sutherland KD, Vaillant F, Alexander WS, Wintermantel TM, Forrest NC, Holroyd SL, et al. c-myc as a mediator of accelerated apoptosis and involution in mammary glands lacking Socs3. EMBO J. 2006;25:5805–5815. doi: 10.1038/sj.emboj.7601455. [DOI] [PMC free article] [PubMed] [Google Scholar]
- 28.Shankar S, Singh G, Srivastava RK. Chemoprevention by resveratrol: molecular mechanisms and therapeutic potential. Front Biosci. 2007;12:4839–4854. doi: 10.2741/2432. [DOI] [PubMed] [Google Scholar]
- 29.Chau BN, Wang JY. Coordinated regulation of life and death by RB. Nat Rev Cancer. 2003;3:130–138. doi: 10.1038/nrc993. [DOI] [PubMed] [Google Scholar]
- 30.Wang C, Hou X, Mohapatra S, Ma Y, Cress WD, Pledger WJ, et al. Activation of p27Kip1 expression by E2F1. A negative feedback mechanism. J Biol Chem. 2005;280:12339–12343. doi: 10.1074/jbc.C400536200. [DOI] [PubMed] [Google Scholar]
- 31.Chen G, Wang Y, Huang H, Lin F, Wu D, Sun A, et al. Combination of DNA methylation inhibitor 5-azacytidine and arsenic trioxide has synergistic activity in myeloma. Eur J Haematol. 2009;82:176–183. doi: 10.1111/j.1600-0609.2008.01189.x. [DOI] [PubMed] [Google Scholar]
- 32.Lunghi P, Giuliani N, Mazzera L, Lombardi G, Ricca M, Corradi A, et al. Targeting MEK/MAPK signal transduction module potentiates ATO-induced apoptosis in multiple myeloma cells through multiple signaling pathways. Blood. 2008;112:2450–2462. doi: 10.1182/blood-2007-10-114348. [DOI] [PubMed] [Google Scholar]
- 33.Wen J, Feng Y, Huang W, Chen H, Liao B, Rice L, et al. Enhanced antimyeloma cytotoxicity by the combination of arsenic trioxide and bortezomib is further potentiated by p38 MAPK inhibition. Leuk Res. 2010;34:85–92. doi: 10.1016/j.leukres.2009.05.024. [DOI] [PubMed] [Google Scholar]
- 34.Campbell RA, Sanchez E, Steinberg JA, Baritaki S, Gordon M, Wang C, et al. Antimyeloma effects of arsenic trioxide are enhanced by melphalan, bortezomib and ascorbic acid. Br J Haematol. 2007;138:467–478. doi: 10.1111/j.1365-2141.2007.06675.x. [DOI] [PubMed] [Google Scholar]
- 35.Mallick S, Ghosh P, Samanta SK, Kinra S, Pal BC, Gomes A, et al. A saikosaponin-like compound isolated from Corchorus acutangulus Lam., targets mitochondrial apoptotic pathways in leukemic cell lines (HL-60 and U937) Cancer Chemother Pharmacol. 2009 doi: 10.1007/s00280-009-1214-3. [DOI] [PubMed] [Google Scholar]
- 36.Chen L, Li Z, Zwolinska AK, Smith MA, Cross B, Koomen J, et al. MDM2 recruitment of lysine methyltransferases regulates p53 transcriptional output. EMBO J. 2010;29:2538–2552. doi: 10.1038/emboj.2010.140. [DOI] [PMC free article] [PubMed] [Google Scholar]
- 37.Nicholson J, Hupp TR. The molecular dynamics of MDM2. Cell Cycle. 2010;12:9. doi: 10.4161/cc.9.10.11597. [DOI] [PubMed] [Google Scholar]
- 38.Kircelli F, Akay C, Gazitt Y. Arsenic trioxide induces p53-dependent apoptotic signals in myeloma cells with SiRNA-silenced p53: MAP kinase pathway is preferentially activated in cells expressing inactivated p53. Int J Oncol. 2007;30:993–1001. [PubMed] [Google Scholar]


