MicroRNAs up-regulated in PTC tumors directly inhibit the expression of THRB, which might be an important [alternative] mechanism of silencing of THRB in thyroid tumorigenesis.
Abstract
Context:
Loss of the thyroid hormone receptor is common in tumors. In mouse models, a truncated THRB gene leads to thyroid cancer. Previously, we observed up-regulation of the expression of eight microRNAs (miRs) in papillary thyroid carcinoma (PTC) tumors.
Objective:
Our objective was to determine whether THRB might be inhibited by miRs up-regulated in PTC.
Design:
The potential binding of miR to the 3′-untranslated region of THRB was analyzed in silico. Direct inhibition by miRs binding to the cloned 3′-untranslated region of THRB was evaluated using luciferase assays. Inhibition of endogenous THRB and its target genes (DIO1 and APP) was examined in cell lines transfected by pre-miRs. The impact on thyroid hormone response element (TRE) was evaluated in promoter assays. Correlations between the expression of THRB and miRs was evaluated in 13 PTC tumor/normal tissue pairs.
Results:
THRB contains binding sites for the top seven miRs up-regulated in PTC (P = 0.0000002). Direct interaction with THRB was shown for miR-21 and miR-146a. We observed lower levels of THRB transcripts in cell lines transfected with miR-21, -146a, and -221 (down-regulation of 37–48%; P < 0.0001), but not with miR-181a. THRB protein was suppressed down to 10–28% by each of four miRs. Concomitant expression of DIO1 and APP was affected (down-regulation of 32–66%, P < 0.0034 and up-regulation of 48–57%, P < 0.0002, respectively). All four miRs affected TRE activity in promoter assays. Down-regulation of luciferase occurred after transfection with pTRE-TK-Luc construct and each of four miRs. The analysis of tumor/normal tissue pairs revealed down-regulation of THRB in 11 of 13 pairs (1.3- to 9.1-fold), and up-regulation of miR-21, -146a, -181a, and -221 in almost all pairs.
Conclusions:
MiRs up-regulated in PTC tumors directly inhibit the expression of THRB, an important tumor suppressor gene.
Thyroid receptors (TR) are ligand-dependent transcription factors that regulate cell proliferation, differentiation, and apoptosis. They are members of the steroid hormone/retinoic acid nuclear receptor superfamily. Two genes, thyroid hormone receptor α [THRA (MIM *190120)] and thyroid hormone receptor β [THRB (MIM *190160)], which are located on human chromosomes 17q11 and 3p24, respectively, give rise to four T3-binding receptors (TRα1, TRβ1, TRβ2, and TRβ3) and two non-T3-binding receptors (TRα2 and TRα3). These TRs are expressed in a tissue-dependent and developmentally regulated manner. The regulatory functions of TR depend not only on T3 but also on the types of thyroid hormone response elements (TRE) located in the promoter regions of T3 target genes. Several corepressors and coactivators also modulate the functions of TR (1).
A mutant knock-in mouse with a targeted potent dominant-negative THRB mutation has been generated (TRβPV mouse) (2). The thyroid glands of TRβPV/PV mice exhibit extensive papillary hyperplasia that progresses to capsular invasion, vascular invasion, anaplasia, and ultimately, metastasis to distant organs. Although the initial hyperplasia of the thyroid showed a papillary pattern, both anaplastic and follicular patterns were observed in distant metastases (2, 3).
MicroRNAs (miRs) are small (19–25 nucleotides) noncoding RNA molecules that typically function as negative regulators of the expression of protein-encoding genes. They occur in vertebrates, flies, worms, plants, and even in viruses (4). So far, more than 500 miR genes have been described in the human genome, but the total number is expected to be higher (5). Functionally, each miR reduces the levels of the transcripts of numerous target genes and the amounts of protein encoded by these transcripts (6). It is speculated that miRs altogether might regulate around 30% of the human genome, highlighting their importance as global regulators of gene expression. MiRs regulate such major processes as development, apoptosis, cell proliferation, and hematopoiesis (7); they also may act as tumor suppressor genes and oncogenes (8, 9).
MiRs were recently found to be involved in the tumorigenesis of several types of human cancers mainly evidenced by abnormal levels of expression of mature miR transcripts in tumors compared with the corresponding normal tissues (10). MiR expression profiling of human tumors has identified signatures associated with the diagnosis, staging, prognosis, and response to treatment (11, 12). It was shown that the up-regulation of oncogenic miRs (e.g. miR-155 and miR-21) or down-regulation of miRs functioning as tumor suppressors (e.g. miR-15a and miR-16) is associated with carcinogenesis (13, 14).
In an early study, we used an oligo DNA expression microarray to detect evidence of a potential role for miRs in papillary thyroid carcinoma (PTC) (MIM 188550). First we noticed an overexpression of several miRs in tumor tissue compared with unaffected tissue of the thyroid gland (15). The list of highly up-regulated miRs (up to 19.3-fold) included miR-221, miR-146, miR-34, miR-21, and miR-181 and was soon confirmed (16). This finding suggested that altered miRs might be important factors playing a role in the tumorigenesis of PTC. Further evidence supporting this argument came from our study showing a genetic association between PTC and a single-nucleotide polymorphism (SNP) (rs2910164) in the precursor of miR-146a. Individuals heterozygous GC for the SNP had an increased risk of acquiring PTC (odds ratio = 1.62; 95% confidence interval = 1.3–2.0; P = 0.000007) (17). We further demonstrated that the processing of the miR was affected by the SNP and that additional mature miRs were generated from the passenger strand of the miR-146a precursor, each with distinct target genes (18). We showed widely different transcriptomes in GC and GG tumors and, notably, also in unaffected parts of the thyroid from PTC patients. In particular, genes involved in the regulation of apoptosis were differentially transcribed in heterozygotes compared with GG homozygotes (44 genes, P = 0.0001). Moreover, among genes differentially regulated in heterozygotes, 12 genes were designated positive regulators of nuclear factor-κB (P = 0.009) (18, 19).
In this study, we address the functional consequences of the up-regulation of miR genes found in PTC.
Materials and Methods
Thyroid tissue samples
All samples came from the Medical University of Warsaw (Poland). After approval of the Institutional Review Board and patient consent, fresh samples from PTC tumor tissue and unaffected thyroid tissue from the contralateral lobe were obtained from patients with sporadic PTC undergoing surgical resection; the samples were snap-frozen in liquid nitrogen and stored at −80 C. Total RNA was extracted with TRIzol solution (Invitrogen, Carlsbad, CA), and the integrity of RNA was assessed by using an Agilent BioAnalyzer 2100 (Agilent, Santa Clara, CA).
CAKI-2 cell transfection
CAKI-2 cells were plated at 1 × 10⁵ cells per 12-well dish and transfected 24 h later by using Lipofectamine 2000 reagent (Invitrogen). Each transfection reaction contained 37.5 nm pre-miR (pre-miR miRNA precursor molecule; Ambion, Austin, TX). As controls, we performed mock transfection (no miR) or transfection with scrambled miR (negative miR control; Ambion). The medium contained 10% fetal bovine serum (FBS) with physiological levels of T3 or T3-free FBS (charcoal/dextran-treated FBS) (Hyclone, Logan, UT). Total RNA was extracted with TRIzol solution (Invitrogen) 48 h after transfection and used for real-time RT-PCR.
Real-time RT-PCR detection of expression of miRs and THRB, DIO1, THRA, and APP genes
To evaluate the expression levels of miRs, stem-loop real-time RT-PCR was used. RNA (200 ng) was used for RT reactions that were performed by using high-capacity cDNA reverse transcription kit (Applied Biosystems, Foster City, CA) according to the manufacturer's protocol. Real-time PCR was performed on the LightCycler 480 (Roche Diagnostics, Mannheim, Germany), and U6 was used as an endogenous control. All primers were part of TaqMan miR assays for miR-21, -146a, -181a, or -221 or RNU6B (Applied Biosystems). For THRB, DIO1, and 18S RNA control, we used random primers and probes obtained from Applied Biosystems. The cycle number at which the product level exceeded an arbitrarily chosen threshold (CT) was determined for each target sequence, and the amount of each miR relative to control RNA was described by using the formula 2−ΔCT, where ΔCT = CT(miR) − CT(control).
For THRB, DIO1, THRA, and APP expression analysis, semiquantitative real-time PCR was performed using LightCycler 480 and DNA SYBR Green I Master (Roche Diagnostic, Mannheim, Germany) in triplicate according to the manufacturer's protocol. The primers sequences for each gene were as follows: DIO1, 5′-GTGCCTGTAGAGTGCAACTG-3′ (forward) and 5′-GATTCAGCTAGGGACACAG-3′ (reverse); THRB, 5′-GAACAGTCGTCGCCACATC-3′ (forward) and 5′-GCTCGTCCTTGTCTAAGTAAC-3′ (reverse); THRA, 5′-AAGGTGGAGTGTGGGTCAG-3′ (forward) and 5′-ACAAGTGATACAGCGGTAG-3′ (reverse); and APP, 5′-CAGTTATCCAGCATTTCCAG-3′ (forward) and 5′-GGTGATGTAGTTCTCCAGG-3′ (reverse). Real-time PCR was carried out under the following conditions: initial denaturation at 95 C for 10 min and 45 cycles of 95 C for 15 sec, 57 C for 15 sec, and 72 C for 15 sec, followed by melting curve analysis (95 C for 5 min, 65 C for 1 min; continuous reading of fluorescence from 65–97 C with 0.11 C/sec ramp rate and five acquisitions per degree Centigrade). Results were normalized to the expression of 18s RNA host-gene RN18S1.
Protein extraction and Western blot analysis of TRβ1 expression
CAKI-2 cells were harvested 72 h after transfection with pre-miR, washed once in PBS, and lysed in RIPA buffer [150 mm NaCl, 1% Nonidet P-40, 0.5% sodium deoxycholate, 0.1% sodium dodecyl sulfate, 50 mm Tris-HCl (pH 8), 2 mm EDTA] containing protease inhibitor cocktail (Sigma-Aldrich, St. Louis, MO) and 1 mm phenylmethylsulfonyl fluoride. The amount of protein was established with BCA protein assay reagent (Pierce, Biotechnology, Rockford, IL) according to standard protocol. The protein extracts were divided into 30-μl aliquots and stored at −70 C. Thirty micrograms of total protein extract were separated on 10% SDS-PAGE gels and transferred on nitrocellulose membranes. Destained membranes were blocked overnight in 5% nonfat milk in Tris-buffered saline with Tween 20 (TBS-T) buffer [20 mm Tris-HCl, 137 mm NaCl, 1M HCl, 0.1% Tween 20 (pH 7.6)]. Subsequently, the membranes were washed three times in TBS-T for 10 min at room temperature and incubated overnight at 8 C with anti-TRβ1 antibody diluted 1:1000 (Abcam, Cambrige, UK; catalog item ab2744). For β-actin analysis, the membranes were probed for 1 h at room temperature with anti-β-actin antibody diluted 1:10,000 (Abcam; catalog item ab6276). After washing three times for 10 min with TBS-T, the membranes were incubated for 1 h at room temperature with horseradish peroxidase-conjugated goat antimouse secondary antibody (1:10,000; Dako, Carpinteria, CA) and washed again as described above. The proteins were detected by an enhanced-chemiluminescence detection system (Supersignal West Pico chemiluminescent substrate; Pierce) according to standard procedures. The amount of specific protein was estimated densitometrically after normalization to expression of β-actin.
3′-Untranslated region (UTR) luciferase reporter assays
To generate a 3′-UTR luciferase reporter construct, the full length of the 3′-UTR from THRB (5223 nucleotides) was cloned downstream of the firefly luciferase gene in pGL3-control vector (Promega, Madison, WI). For promoter assay, we used the reporter pTRE-TK-Luc plasmid containing two copies of palindromic TRE cloned upstream of thymidine kinase (TK) promoter in the pA3-luciferase vector (Luc) (20).
For luciferase reporter assays, HEK293 cells were plated at 2 × 10⁵ cells per well in 12-well dishes and 24 h later cotransfected with FuGENE6 reagent (Roche). Each cotransfection reaction contained 50 nm pre-miR (pre-miR miRNA precursor molecule; Ambion) or scrambled miR (negative miR control, Ambion) plus 1) 200 ng pGL3–3′-UTR construct plus 20 ng pRL-TK plasmid that served as transfection control or b) 1000 ng pTRE-TK-Luc construct plus 100 ng pRL-TK. After 24 h, cells were washed and lysed with passive lysis buffer (Promega), and their firefly luciferase activity was measured by using the Veritas microplate luminometer (Turner Biosystems) and normalized to Renilla luciferase activity. We ran all samples in triplicate and repeated the experiment once.
Statistical analysis
Statistical analysis of means by Student's t test was conducted by using R software. All data are expressed as the mean ± sem. All data are sampled from a population that follows a standard normal distribution.
Results
In silico analysis of target genes of deregulated miRs
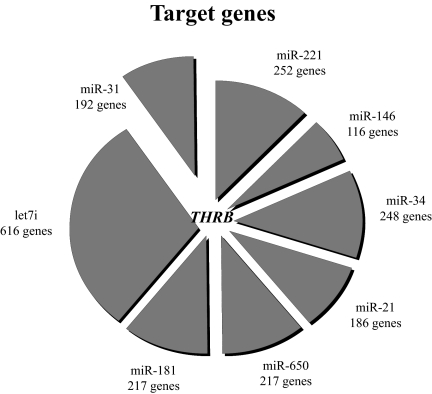
We hypothesized that genes deregulated in PTC tumors might be involved in regulation of common genes or metabolic pathways. We employed TargetScan software (21, 22) that predicts the target genes of miRs and listed all genes potentially inhibited by each miR overexpressed in PTC. Surprisingly, the top seven miRs deregulated in PTC contain binding sites for the same gene, namely THRB (Fig. 1). This finding is very unlikely to occur by chance (P = 0.0000002). Eight additional genes (MECP2, FOXP1, RNF165, AMMECR1L, FLJ20309, PPP3CA, RFXDC2, and UHRF2) were predicted to be regulated by four of eight tested miRs (P = 0.0009). The results were confirmed using miRecords predicting software (23).
Fig. 1.
Target genes of miRs deregulated in PTC tumors. The top seven miRs deregulated in PTC contain binding sites for the same one gene, namely THRB, as predicted by TargetScan software (P = 0.0000002). The size of every sector of the circle graph reflects the number of genes predicted to be regulated by a given miR.
The 3′-UTR of THRB comprises 14 binding sites for seven miRs up-regulated in PTC. Each site presents its own distinct characteristics and power. The site might be functional or not depending on its sequence, structure, location within the 3′-UTR, distance from polyA, distance from other miR sites, and evolutionary conservation (24). Based on these considerations, we chose for experimental testing four miRs for which THRB contains binding sites (miR-21, -146a, -181a, and -221) most likely to have a functional role.
Endogenous expression of THRB in cell lines transfected with miR
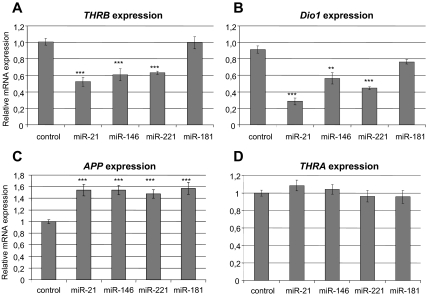
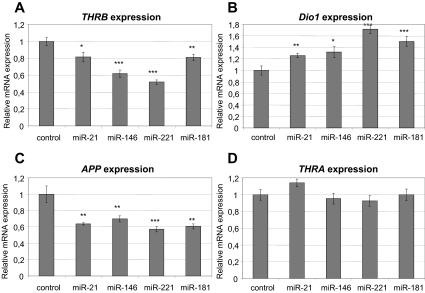
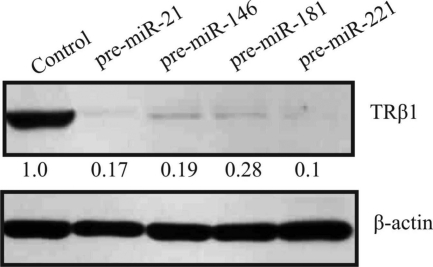
We searched for a cell line with high endogenous expression of THRB and low endogenous expression of the miRs of interest. We tested several thyroid cancer cell lines (KTC1, PTC133, BCPAP, TPC1, SW1743, K1, and NPA) and found that they express either high levels of the miRs of interest or very low levels of the endogenous THRB gene, as opposed to CAKI-2 and HEK293 cell lines. We employed the CAKI-2 cell line (of kidney carcinoma origin) that exhibits strong expression of THRB and weak expression of miR-21, -146a, -181a, and -221 (data not shown). We transfected cells with each miR (pre-miR miRNA precursor molecule; Ambion) and confirmed the induced levels of miRs by real-time RT-PCR (TaqMan miR expression assay; Applied Biosystems). In the presence of physiological levels of thyroid hormone (T3), we showed a significant reduction of the levels of THRB transcripts after introduction of miR-21 (inhibition by 48%, P < 0.0001), miR-146a (inhibition by 40%, P < 0.0001), and miR-221 (inhibition by 37%, P < 0.0001), but not miR-181a (Fig. 2A). In the absence of T3, we showed significant down-regulation of THRB by all four miRs (miR-21: inhibition by 18%, P = 0.0235; miR-146: inhibition by 38%, P < 0.0001; miR-221: inhibition by 48%, P < 0.0001; and miR-181: inhibition by 19%, P = 0.0053; Fig. 3A). By Western blotting we observed lower levels of TRβ1 protein in the presence of miR-21 (inhibition by 83%), miR-146a (inhibition by 81%), miR-221 (inhibition by 90%), and miR-181a (inhibition by 72%) (Fig. 4). As controls, we used cDNA or protein extracted from cells transfected with scrambled miR (negative miR control; Ambion).
Fig. 2.
Deregulation of transcripts of THRB and T3-THRB-dependent genes in cell line grown with T3. Semiquantitative real-time PCR assay for THRB gene (A); DIO1 gene, positively regulated by T3-THRB (B); APP gene, negatively regulated by T3-THRB (C); and THRA gene, which serves as control (D) in the CAKI-2 cell line transfected with pre-miRs or scrambled pre-miR (negative control) in the presence of T3. Data are expressed as mean values ± sem. ***, P < 0.0001; **, P < 0.01.
Fig. 3.
Deregulation of transcripts of THRB and T3-THRB-dependent genes in cell line grown in T3-deprived medium. Semiquantitative real-time PCR assay for THRB gene (A), DIO1 gene, positively regulated by T3-THRB (B); APP gene, negatively regulated by T3-THRB (C); and THRA gene, which serves as control (D) in the CAKI-2 cell line transfected with pre-miRs or scrambled pre-miR (negative control) in absence of T3. Data are expressed as mean values ± sem. ***, P < 0.0001; **, P < 0.01; *, P < 0.05.
Fig. 4.
Down-regulation of TRβ1 protein in cell line. Western blotting for TRβ1 and β-actin (loading control) in the CAKI-2 cell line transfected with pre-miRs or scrambled pre-miR (negative control). Cells were harvested 72 h after transfection; the relative density of bands was quantified by densitometry.
Endogenous expression of T3-THRB-dependent genes in cell lines transfected with miRs
The introduction of miRs into CAKI-2 cells decreased the amount of THRB mRNA and protein. It should lead to disturbed regulation of T3-THRB-dependent genes such as the deiodinase gene (DIO1, positively regulated by T3) (25) or amyloid-β precursor gene (APP, negatively regulated by T3) (26). We studied the transcription of these genes by real-time RT-PCR and found that their expression was changed accordingly. The expression of thyroid hormone receptor-α (THRA) was used as a negative control to confirm that changes in the mRNA level of the examined genes are not circumstantial. Down-regulation of DIO1 was shown in cell lines transfected by miR-21 (inhibition by 66%, P < 0.0001), miR-146a (inhibition by 32%, P < 0.0034), and miR-221 (inhibition by 46%, P < 0.0001) but not miR-181a (P = 0.375) (Fig. 2B). Overexpression of APP was shown in cell lines transfected by each of four miRs: miR-21 (up-regulation by 54%, P < 0.0001), miR-146 (up-regulation by 49%, P < 0.0002), miR-221 (up-regulation by 57%, P < 0.0001), and miR-181 (up-regulation by 48%, P < 0.0001) (Fig. 2C). No differences in THRA gene mRNA level were observed after miR transfections (Fig. 2D). As a negative control, we used cDNA extracted from cells transfected with scrambled miR (negative miR control; Ambion).
Endogenous expression of T3-THRB-dependent genes in cell lines transfected with miRs in the absence of T3
Activity of the thyroid hormone receptors is strictly dependent on availability of their ligand (T3); therefore, we transfected CAKI-2 cell lines with miRs in medium deprived of T3. We expected a different effect of the THRB gene on DIO1 and APP expression from that observed in standard cell cultures with physiological levels of T3. In fact, we observed overexpression of DIO1 after transfection of cells with miR-21 (up-regulation by 26%, P = 0.0064), miR-146 (up-regulation by 32%, P = 0.0167), miR-221 (up-regulation by 71%, P < 0.0001), and miR-181 (up-regulation by 50%, P < 0.002) (Fig. 3B). We observed down-regulation of the APP gene after transfection with all four miRs: miR-21 (inhibition by 36%, P = 0.0016), miR-146 (inhibition by 30%, P = 0.0097), miR-181 (inhibition by 39%, P = 0.0011), and miR-221 (inhibition by 43%, P = 0.0005) (Fig. 3C). No differences in the THRA gene mRNA level after miR transfections in T3-deprived medium were observed (Fig. 3D).
Direct interaction of miRs and THRB (luciferase assay)
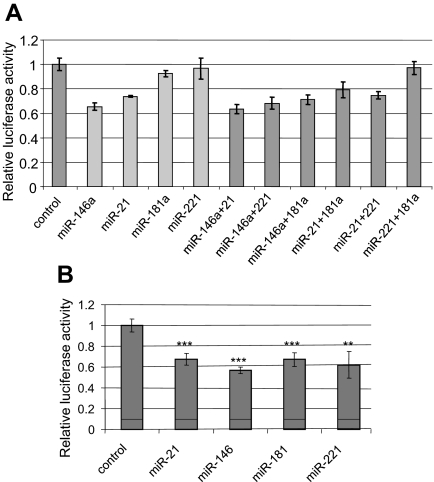
To study the direct interaction of the miRs of interest and THRB, we cloned the full-length 3′-UTR of THRB downstream of the luciferase gene in the pGL3 vector. We used the HEK293 cell line (low endogenous expression of THRB) to cotransfect cells with pGL3-THRB vector and precursors of miRs and conducted the luciferase assay. The induction of miR expression was confirmed by real-time RT-PCR assay (data not presented). We showed inhibition of luciferase activity by miR-21 and miR-146a (34 and 26%, respectively) but not by miR-181a and miR-221 (Fig. 5A). To assess whether miRs cooperate in down-regulating target genes, we cotransfected cells with combinations of miRs as shown in Fig. 5A. The total amount of miR transfected was the same in all these experiments. The inhibition of luciferase activity was not increased by cotransfection with combinations of miRs; therefore, we cannot prove that miRs work synergistically at least within the studied concentration and experimental conditions.
Fig. 5.
Direct interaction of miRs and THRB (luciferase assay) and impact on TRE (promoter assay). A, Dual luciferase assay. The relative luciferase activity of reporter constructs with the 3′-UTR of THRB in the presence of pre-miRs or scrambled pre-miR (negative control). Data are expressed as mean values ± sem. B, Promoter assay. The relative luciferase activity of reporter constructs with two positive TRE sequences cloned in the promoter region of luciferase gene in the presence of pre-miRs or scrambled pre-miR (negative control). Data are expressed as mean values ± sem. ***, P < 0.0001; **, P < 0.01.
Effect of miRs on TRE within the promoter region
The T3-THRB-dependent genes may be regulated in a positive or negative manner. The mechanism of positive regulation is mediated by positive TRE located in the promoter regions of T3-THRB target genes (1). To confirm that miRs down-regulate THRB expression and thus down-regulate the expression of positively regulated genes, we used a pTRE-TK-Luc construct that contains two copies of positive TRE. We cotransfected CAKI-2 cells with pTRE-TK-Luc construct and each miR and observed inhibition of luciferase activity after transfection of cells with miR-21 (inhibition by 33%, P < 0.0003), miR-146 (inhibition by 44%, P < 0.0001), miR-221 (inhibition by 34%, P = 0.0034), and miR-181 (inhibition by 33%, P < 0.0004) (Fig. 5B).
In vivo expression of THRB and miRs in PTC samples
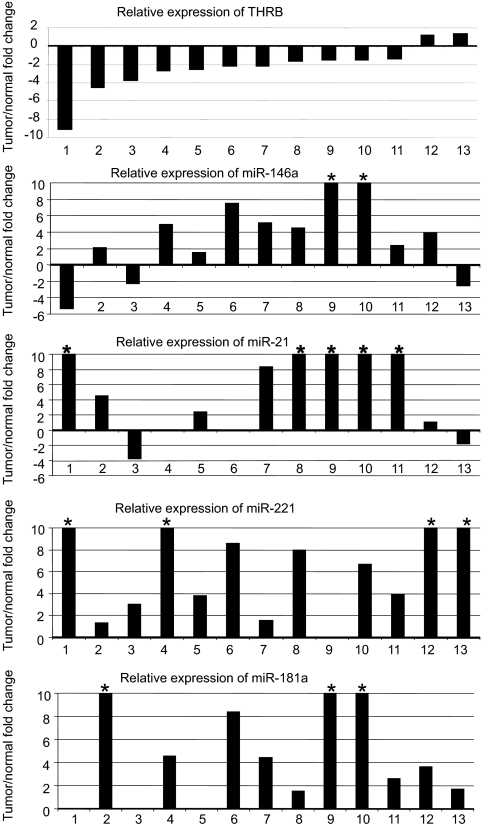
We evaluated the expression of THRB and the miRs of interest in 26 paired tumor/normal tissue samples derived from 13 PTC patients and observed lower levels of THRB transcripts in 11 of 13 tumor samples (1.3- to 9.1-fold decrease) and higher levels of miR-21, -146a, -181a, and -221 in almost all tumor samples (Fig. 6), which is concordant with our previous reports of overexpression of miRs in PTC tumors (15, 17). The fold changes for the miRs are widely distributed (for example 1.5–100.5 for miR-181a). This variation likely is related to the complexity of in vivo tumor samples and the proportion of tumor cells in each sample. The proportion of tumor cells is typically estimated to be in the range of 20–100% with a median of 60% (27).
Fig. 6.
Up-regulation of miRs and down-regulation of THRB in PTC tumor tissue. TaqMan real-time RT-PCR assay in 13 PTC tumor/normal pairs. *, Values exceeding the scale (10-fold overexpression).
Discussion
MiRs are emerging as important, although poorly characterized, gene-regulatory elements that have been implicated in a variety of disease processes, including cancer. Alterations of miR expression leading to disturbed regulation of protein-encoding genes have recently been identified in many specific tumors. In a whole-genome miR expression study, we found preliminary evidence of a potential role for miRs in PTC (15). First we noticed an overexpression of several miRs in tumor tissue compared with unaffected tissue of the thyroid gland. The list of highly up-regulated miRs (up to 19.3-fold) included miR-146, miR-221/222, miR-155, miR-34, and miR-181. Tumors in which the up-regulation of miR-221, -222, and -146 were the strongest showed dramatic loss of KIT transcript and Kit protein (target shared by all three miRs). This down-regulated expression was associated with germline single-nucleotide changes in the two recognition sequences in KIT mRNA for these miRs. We concluded that up-regulation of several miRs and altered inhibitions of their targets are involved in PTC pathogenesis and that sequence changes in genes targeted by miRs can contribute to their regulation. We later noticed that the sequence of one of these miRs, namely miR-146a, comprises a germline variation that predisposes to thyroid cancer and contributes to tumor progression (17). The sequence variation in miR-146a led to differences in its processing, affecting its inhibition of target genes. We further proved that mature miRs are generated not only from the leading strand but also from the passenger strand of a human pre-miR-146a (18). An innocent genomic alteration such as a SNP when located in the part of the pre-miR sequence that becomes the passenger strand can lead to the production of two functionally independent miRs from this strand (in addition to the canonical mature miR from the leading strand), each with its distinct set of target genes leading to different transcriptomes (18, 19).
The function of miRs is highly dependent on their target genes. We queried what genes are regulated by those miRs that are overexpressed in PTC and, surprisingly, noticed that the top seven miRs deregulated in PTC are predicted to bind to the same single gene, namely THRB. For any given protein-encoded gene, it is believed that the more target sites for miR there are, the greater is its chance of being regulated by miR and the synergistic effect of several miRs is expected. THRB, a known tumor-suppressor gene and a crucial factor of thyroid hormone function, became the natural subject of our study.
The role of THRB in tumorigenesis has been studied extensively. A mutant knock-in mouse (TRβPV) with a truncated THRB receptor has been generated (1). As TRβPV/PV mice age, they spontaneously develop thyroid carcinomas with a pathological progression similar to human follicular thyroid cancer and TSHomas. TRβPV/PV mice exhibit severe dysregulation of the pituitary-thyroid axis with highly elevated TSH associated with increased T3 (2, 3). This hormone is an important regulator of growth and function of thyroid follicular cells; however, its role as an initiator of thyroid carcinogenesis remains controversial. Lu et al. (28) using TRβPV/PV mice with or without TSHR showed that TRβPV/PV mice deficient in TSHR exhibited impaired thyroid growth due to the lack of TSH/TSHR proliferation signal but showed no signs of cancer. Wild-type mice treated with an antithyroid agent, propylthiouracil, having an elevated level of TSH, had aberrant thyroid growth but did not develop metastatic thyroid cancer. Thus, growth stimulated by TSH is a prerequisite but not sufficient factor for cancer to occur. Additional genetic alterations (such as PV), altering focal adhesion and migration capacities, are required to increase cell invasion and migration, which in turn leads to the development of cancer.
Mice with one mutated THRB allele in the absence of the other wild-type allele (TRβPV/− mouse) also develop thyroid carcinoma. Thus, a mutation of one THRB allele in the absence of the wild-type allele is sufficient to induce thyroid carcinoma. Loss of function of THRB alleles might occur as a result of somatic mutation or hypermethylation. Mutated THRB has been reported in liver cancer (29), kidney cancer (30), and thyroid cancer (31). Hypermethylation of THRB was shown in breast cancer (32). The results of the present study suggest that an up-regulation of miRs might well be an important mechanism of silencing of THRB.
Acknowledgments
We thank Prof. Graham Williams from Imperial College London, UK, for a kind gift of the pTRE-TK-Luc construct; Anna Wojcicka for the idea of studying the APP gene as THRB regulated gene and analysis of gene expression in T3-deprived medium; and Piotr Poplawski for assistance.
This work was supported by National Cancer Institute Grants P30 CA16058 (to the Ohio State University Comprehensive Cancer Center), P01 CA124570 (to Matthew D. Ringel, PI, and A.d.l.C, leader of a project), Polish Ministry of Science and Higher Education Grant NN401 584838 (to K.J), NN401 073636 (to A.N.), and Foundation for Polish Science (to K.J.).
Disclosure Summary: The authors have nothing to disclose.
Footnotes
- FBS
- Fetal bovine serum
- miR
- micro-RNA
- PTC
- papillary thyroid carcinoma
- SNP
- single-nucleotide polymorphism
- TBS-T
- Tris-buffered saline with Tween 20
- TK
- thymidine kinase
- TR
- thyroid receptor
- TRE
- thyroid hormone response element
- UTR
- untranslated region.
References
- 1. Cheng SY. 2000. Multiple mechanisms for regulation of the transcriptional activity of thyroid hormone receptors. Rev Endocr Metab Disord 1:9–18 [DOI] [PubMed] [Google Scholar]
- 2. Kaneshige M, Kaneshige K, Zhu X, Dace A, Garrett L, Carter TA, Kazlauskaite R, Pankratz DG, Wynshaw-Boris A, Refetoff S, Weintraub B, Willingham MC, Barlow C, Cheng S. 2000. Mice with a targeted mutation in the thyroid hormone β receptor gene exhibit impaired growth and resistance to thyroid hormone. Proc Natl Acad Sci USA 97:13209–13214 [DOI] [PMC free article] [PubMed] [Google Scholar]
- 3. Suzuki H, Willingham MC, Cheng SY. 2002. Mice with a mutation in the thyroid hormone receptor β gene spontaneously develop thyroid carcinoma: a mouse model of thyroid carcinogenesis. Thyroid 12:963–969 [DOI] [PubMed] [Google Scholar]
- 4. Bartel DP. 2004. MicroRNAs: genomics biogenesis mechanism and function. Cell 116:281–297 [DOI] [PubMed] [Google Scholar]
- 5. Bentwich I, Avniel A, Karov Y, Aharonov R, Gilad S, Barad O, Barzilai A, Einat P, Einav U, Meiri E, Sharon E, Spector Y, Bentwich Z. 2005. Identification of hundreds of conserved and nonconserved human microRNAs. Nat Genet 37:766–770 [DOI] [PubMed] [Google Scholar]
- 6. Lim LP, Lau NC, Garrett-Engele P, Grimson A, Schelter JM, Castle J, Bartel DP, Linsley PS, Johnson JM. 2005. Microarray analysis shows that some microRNAs downregulate large numbers of target mRNAs. Nature 433:769–773 [DOI] [PubMed] [Google Scholar]
- 7. Croce CM, Calin GA. 2005. miRNAs cancer and stem cell division. Cell 122:6–7 [DOI] [PubMed] [Google Scholar]
- 8. Esquela-Kerscher A, Slack FJ. 2006. Oncomirs: microRNAs with a role in cancer, Nat Rev Cancer 6:259–269 [DOI] [PubMed] [Google Scholar]
- 9. Zhang B, Pan X, Cobb GP, Anderson TA. 2007. microRNAs as oncogenes and tumor suppressors. Dev Biol 302:1–12 [DOI] [PubMed] [Google Scholar]
- 10. Barbarotto E, Schmittgen TD, Calin GA. 2008. MicroRNAs and cancer: profile, profile, profile. Int J Cancer 122:969–977 [DOI] [PubMed] [Google Scholar]
- 11. Lu J, Getz G, Miska EA, Alvarez-Saavedra E, Lamb J, Peck D, Sweet-Cordero A, Ebert BL, Mak RH, Ferrando AA, Downing JR, Jacks T, Horvitz HR, Golub TR. 2005. MicroRNA expression profiles classify human cancers. Nature 435:834–838 [DOI] [PubMed] [Google Scholar]
- 12. Marcucci G, Radmacher MD, Maharry K, Mrózek K, Ruppert AS, Paschka P, Vukosavljevic T, Whitman SP, Baldus CD, Langer C, Liu CG, Carroll AJ, Powell BL, Garzon R, Croce CM, Kolitz JE, Caligiuri MA, Larson RA, Bloomfield CD. 2008. MicroRNA expression in cytogenetically normal acute myeloid leukemia. N Engl J Med 358:1919–1928 [DOI] [PubMed] [Google Scholar]
- 13. Calin GA, Dumitru CD, Shimizu M, Bichi R, Zupo S, Noch E, Aldler H, Rattan S, Keating M, Rai K, Rassenti L, Kipps T, Negrini M, Bullrich F, Croce CM. 2002. Frequent deletions and down-regulation of micro-RNA genes miR15 and miR16 at 13q14 in chronic lymphocytic leukemia. Proc Natl Acad Sci USA 99:15524–15529 [DOI] [PMC free article] [PubMed] [Google Scholar]
- 14. Eis PS, Tam W, Sun L, Chadburn A, Li Z, Gomez MF, Lund E, Dahlberg JE. 2005. Accumulation of miR-155 and BIC RNA in human B cell lymphomas. Proc Natl Acad Sci USA 102:3627–3632 [DOI] [PMC free article] [PubMed] [Google Scholar]
- 15. He H, Jazdzewski K, Li W, Liyanarachchi S, Nagy R, Volinia S, Calin GA, Liu CG, Franssila K, Suster S, Kloos RT, Croce CM, de la Chapelle A. 2005. The role of microRNA genes in papillary thyroid carcinoma. Proc Natl Acad Sci USA 102:19075–19080 [DOI] [PMC free article] [PubMed] [Google Scholar]
- 16. Pallante P, Visone R, Ferracin M, Ferraro A, Berlingieri MT, Troncone G, Chiappetta G, Liu CG, Santoro M, Negrini M, Croce CM, Fusco A. 2006. MicroRNA deregulation in human thyroid papillary carcinomas. Endocr Relat Cancer 13:497–508 [DOI] [PubMed] [Google Scholar]
- 17. Jazdzewski K, Murray EL, Franssila K, Jarzab B, Schoenberg DR, de la Chapelle A. 2008. Common SNP in pre-miR-146a decreases mature miR expression and predisposes to papillary thyroid carcinoma. Proc Natl Acad Sci USA 105:7269–7274 [DOI] [PMC free article] [PubMed] [Google Scholar]
- 18. Jazdzewski K, Liyanarachchi S, Swierniak M, Pachucki J, Ringel MD, Jarzab B, de la Chapelle A. 2009. Polymorphic mature microRNAs from passenger strand of pre-miR-146a contribute to thyroid cancer. Proc Natl Acad Sci USA 106:1502–1505 [DOI] [PMC free article] [PubMed] [Google Scholar]
- 19. Jazdzewski K, de la Chapelle A. 2009. Genomic sequence matters: a SNP in microRNA-146a can turn anti-apoptotic. Cell Cycle 8:1642–1643 [PMC free article] [PubMed] [Google Scholar]
- 20. Nagaya T, Madison LD, Jameson JL. 1992. Thyroid hormone receptor mutant that cause resistance to thyroid hormone. J Biol Chem 267:13014–13019 [PubMed] [Google Scholar]
- 21. Lewis BP, Burge CB, Bartel DP. 2005. Conserved seed pairing often flanked by adenosines indicates that thousands of human genes are microRNA targets. Cell 120:15–20 [DOI] [PubMed] [Google Scholar]
- 22. Grimson A, Farh KK, Johnston WK, Garrett-Engele P, Lim LP, Bartel DP. 2007. MicroRNA targeting specificity in mammals: determinants beyond seed pairing. Mol Cell 27:91–105 [DOI] [PMC free article] [PubMed] [Google Scholar]
- 23. Xiao F, Zuo Z, Cai G, Kang S, Gao X, Li T. 2009. miRecords: an integrated resource for microRNA-target interactions. Nucleic Acids Res 37:D105–D110 [DOI] [PMC free article] [PubMed] [Google Scholar]
- 24. Friedman RC, Farh KK, Burge CB, Bartel DP. 2009. Most mammalian mRNAs are conserved targets of microRNAs. Genome Res 19:92–105 [DOI] [PMC free article] [PubMed] [Google Scholar]
- 25. Master A, Wójcicka A, Piekiełko-Witkowska A, Bogusławska J, Popławski P, Tañski Z, Darras VM, Williams GR, Nauman A. 2010. Untranslated regions of thyroid hormone receptor β1 mRNA are impaired in human clear cell renal cell carcinoma. Biochim Biophys Acta 1802:995–1005 [DOI] [PubMed] [Google Scholar]
- 26. O'Barr SA, Oh JS, Ma C, Brent GA, Schultz JJ. 2006. Thyroid hormone regulates endogenous amyloid-β precursor protein gene expression and processing in both in vitro and in vivo models. Thyroid 16:1207–1213 [DOI] [PubMed] [Google Scholar]
- 27. Jarzab B, Wiench M, Fujarewicz K, Simek K, Jarzab M, Oczko-Wojciechowska M, Wloch J, Czarniecka A, Chmielik E, Lange D, Pawlaczek A, Szpak S, Gubala E, Swierniak A. 2005. Gene expression profile of papillary thyroid cancer: sources of variability and diagnostic implications. Cancer Res 65:1587–1597 [DOI] [PubMed] [Google Scholar]
- 28. Lu C, Zhao L, Ying H, Willingham MC, Cheng SY. 2010. Growth activation alone is not sufficient to cause metastatic thyroid cancer in a mouse model of follicular thyroid carcinoma. Endocrinology 151:1929–1939 [DOI] [PMC free article] [PubMed] [Google Scholar]
- 29. Lin KH, Shieh HY, Chen SL, Hsu HC. 1999. Expression of mutant thyroid hormone nuclear receptors in human hepatocellular carcinoma cells. Mol Carcinog 26:53–61 [DOI] [PubMed] [Google Scholar]
- 30. Kamiya Y, Puzianowska-Kuznicka M, McPhie P, Nauman J, Cheng SY, Nauman A. 2002. Expression of mutant thyroid hormone nuclear receptors is associated with human renal clear cell carcinoma. Carcinogenesis 23:25–33 [DOI] [PubMed] [Google Scholar]
- 31. Puzianowska-Kuznicka M, Krystyniak A, Madej A, Cheng SY, Nauman J. 2002. Functionally impaired TR mutants are present in thyroid papillary cancer. J Clin Endocrinol Metab 87:1120–1128 [DOI] [PubMed] [Google Scholar]
- 32. Li Z, Meng ZH, Chandrasekaran R, Kuo WL, Collins CC, Gray JW, Dairkee SH. 2002. Biallelic inactivation of the thyroid hormone receptor β1 gene in early stage breast cancer. Cancer Res 62:1939–1943 [PubMed] [Google Scholar]


