Abstract
We consider the problem of optical tomographic imaging in a weakly scattering medium in the presence of highly scattering inclusions. The approach is based on the assumption that the transport coefficient of the scattering media differs by an order of magnitude for weakly and highly scattering regions. This situation is common for optical imaging of live objects such an embryo. We present an approximation to the radiative transfer equation, which can be applied to this type of scattering case. Our approach was verified by reconstruction of two optical parameters from numerically simulated datasets.
OCIS codes: (290.0290) Scattering, (290.7050) Turbid media, (170.0170) Medical optics and biotechnology, (170.3010) Image reconstruction techniques
1. Introduction
Optical tomography uses light for visualization of three-dimensional structure of transparent and semi-transparent objects. An application of the inverse Radon transform to optical projection data allows to obtain cross-sectional high-resolution images of small non-scattering objects such as an embryo or foetus. Optical Projection Tomography (OPT) was developed as an optical analogue of X-ray Computerized Tomography (CT) [1, 2] and has found many important applications as an imaging methodology in medicine and biology [3–6]. OPT is likely to evolve to a powerful and sophisticated imaging modality by taking advantage of time-gated technology [7], structured illumination patterns, and light polarization. On the other hand, in contrast to CT, it requires correction for unknown refractive index inside an object. Presence of scattered light in a sample introduces even more complexity to this technique.
Light scattering can be addressed by using Monte-Carlo methods [8–10] or employing the Radiative Transfer Equation (RTE) [11–17]. Both methodologies are computationally very expensive. Image reconstruction algorithms involve repeated solution of the direct problem and, therefore, the use of Monte-Carlo or the RTE significantly affects the performance of these methods. Recently it was suggested to account for only singly scattered photons with angularly selective intensity measurements and apply the broken ray Radon transform [18, 19]. This approach is applicable to weakly scattering media but is invalid in the presence of highly scattering inclusions.
In this paper we consider an approximation to the RTE, which is based on the assumption that scattering media consist of weakly and highly scattering regions, whose transport coefficients differ by an order of magnitude. Such a situation is quite common in Nature. For instance, the atmosphere can be considered mostly non or weakly scattering with clouds presenting highly scattering inclusions. A live embryo or foetus is mostly transparent with internal organs, brain or eye balls being highly scattering.We also make an assumption that the phase function, which is included in to the RTE collision term, can be approximated by the first two terms in its Fourier series expansion. This assumption lets us use the telegraph equation approximation for the light transport inside highly scattering inclusions. For the present, we neglect refractive index variation in the medium.
The image reconstruction approach considered in this paper employs angularly selective intensity measurements. Thus, optical parameters of a scattering medium are reconstructed by using optical projection datasets and scattered light outgoing from the medium at some angles with respect to the direct radiation. The direct radiation is assumed to take the form of parallel rays entering the medium. The image reconstruction algorithm is based on the variational framework and involves repeated numerical solution of first and second order differential equations in the Fourier domain.
This paper is organized as follows. In the next section, we discuss the direct problem and derive an approximation to the RTE, which is valid under our assumption. Implementation details of the direct solver and numerical simulations illustrating our approach are presented as well. At the end of this section the reconstruction algorithm is described. Section 3 is devoted to numerical experiments where reconstructions are presented and discussed.
2. Methodology
2.1. Direct problem
Light transport in scattering media is modeled by the RTE, which is the integro-differential equation describing a balance of radiation along an given direction s [20]. In this study we treat the RTE as a first order partial differential equation
| (1) |
where the function B in the source term reads
| (2) |
In Eqs. (1) and (2), (i) I denotes the intensity of light; (ii) μ̃ = μ + iω/c is the complex extinction coefficient, where μ is the transport coefficient, which is a sum of the scattering, μs, and absorption, μa, coefficients, ω is the Fourier parameter, and c is the speed of light; (iii) λ denotes the albedo of a single scattering event such that λ ∈ [0,1], μs = λμ and μa = (1−λ)μ; (iv) p(s · s′) is the phase function. The simplest form of an anisotropic phase function is assumed in this study
| (3) |
where ε ∈ [−1,1]. The last term in Eq. (2) is scattered once direct radiation I0 (r, s0). Note that the transport coefficient, μ, and albedo, λ, are chosen instead of conventional scattering and absorption coefficients. The albedo is a photon's probability to survive a single scattering event and, therefore, it controls the true absorption. The transport coefficient, which is reciprocal to photon's mean path length between successive scattering events, describes scattering properties of the medium. When the scattering medium is a mixture of two types of particles with different scattering properties then the resulting transport coefficient and the albedo are found as μ = μ1 + μ2 and λ = 2λ1λ2 (λ1 + λ2)−1, where μj and λj (j = 1, 2) are corresponding parameters for each type of particle. Parameters of a mixture of more than two types of scattering particles are computed recursively.
The direct radiation serves as a source for scattered light and is assumed in the form of parallel rays entering the domain along the unit vector s0. The intensity of each ray (the Green function) is found by solving the equation
| (4) |
where Q0 is the source amplitude and r0 belongs to a source plane r0 · s0 = const. The solution of Eq. (4) is given by
| (5) |
Sometimes it is more convenient to integrate from the observation point r rather than from r0. The source and observation points are connected by a line r = r0 +s0l, and, therefore, the integration in exponent in Eq. (5) can be rewritten in the form
∫l0 μ̃(r0+s0l′)dl′ = ∫l0 μ̃ (r−s0l′)dl′.
Finally, the general solution of the RTE at the observation point r is given by
| (6) |
The direct radiation I0, Eq. (5), must be added to I when s = s0. To correspond to physical reality we add the direct radiation to the scattered intensity when s · s0 ≥ 1−δ, where δ is finite but small number.
The intensity, Eq. (6), can be computed numerically when the function B is known. Exact knowledge of the function B is equivalent to computing the solution of the RTE. Here we suggest an approximation to the function B according to the assumption that the medium consists of weakly and highly scattering regions, whose transport coefficients differ by an order of magnitude. We further assume that recorded photons coming from weakly scattering regions are scattered only once, i.e. 1/μ is a length scale on the order of physical dimensions of the scattering domain. This assumption implies a presence of photons scattered more than once. However, they do not reach the CCD array. Therefore, the method of successive approximations applies [20] when only the first approximation is retained. Thus, as an approximation for B we take the scattered once direct radiation p(s · s0) I0 (r, s0), which is the last term in Eq. (2). On the other hand, in highly scattering regions the intensity in Eq. (2) is approximated by
| (7) |
where u denotes the average intensity defined by
| (8) |
and κ is the diffusion coefficient
| (9) |
The expression for the approximate intensity, Eq. (7), results from first two moments of the RTE. That is, consequent multiplication of Eq. (1) by 1 and by s and integration over the whole solid angle leads to a system of two first order differential equations for u and the flux q = −κ∇u. This system is closed when the phase function is assumed in the form of Eq. (3). Elimination of the flux in this system results in the Helmholtz equation for the integrated intensity [21]
| (10) |
where
| (11) |
and the source term, ρ, represents direct intensity averaged over the whole solid angle [21]. Substitution of Eq. (7) into Eq. (2) simplifies the function B to
| (12) |
This final form of the term B is used for computing the intensity I, Eq. (6), where in weakly scattering regions the integrated intensity, u, is neglected.
2.2. Implementation details
High resolution imaging imposes certain constraints on mesh density. A dense mesh requires high performance algorithms for solving the direct and inverse problems. In many cases high performance is achieved by using the simplest and computationally inexpensive approaches. In order to spare computational resources, efficient dynamic memory allocation is the one of the high priority issues. In this study a Cartesian mesh has been chosen. The entire computational domain is split into computational cells (voxels), whose dimensions correspond to a pixel's dimension of the CCD array. All functions are approximated by piecewise constant functions having constant values in each computational cell. The Helmholtz equation (Eq. (10)) is solved by applying the Finite Volume method, which is identical to the Finite Difference numerical scheme for the regular Cartesian grid. However, this approach can be further generalized for adaptive structured meshes.
Computation of the intensity in the scattering medium involves integrations along the rays' paths. A ray integration in Eq. (6) is performed by using Siddon's algorithm [23], which is the ray tracing algorithm designed for Cartesian grids. It finds distances between successive intersections of a ray with coordinates planes. These distances, together with cell's indices, are computed for planes parallel to the x, y, and z-axes. The final three-dimensional ray's path is found by applying a merge sort to these three sets of distances.
The choice of anisotropic phase function in the form (Eq. (3)) requires numerical integration of ελμκs·∇u along a ray in accordance with Eq. (12). For the sake of simplicity a constant value of the parameter ε is assumed everywhere in the domain. Then, we are looking for an inexpensive way of numerical evaluation of the following term
| (13) |
Firstly, we note that a piecewise constant function u satisfies
| (14) |
where denotes a jump of u across a cell's interface at l = li along the direction s. Then, the line integral (Eq. (13)) is approximated by a sum
| (15) |
where and are the cell's interface values of the albedo and the transport coefficient at l = li. The diffusion coefficient at the cell's interface, , is computed according to Eq. (9) where the interface values of λ and μ are substituted. The distance Δlj is the length of the ray's path within a cell provided by Siddon's algorithm. Here, the index j enumerates cells on the ray path and μ̃ is the extinction coefficient of j-th cell. The cell's interface values of parameters and are set to the averages
{λ} = (1/2) (λ+ + λ−),
{μ} = (1/2) (μ+ + μ−),
where superscripts ± denote left/right values of parameters at an intersected cell's interface.
To illustrate this algorithm we computed two camera views shown in Fig. 1. Computations were performed on 100 × 100 × 200 grid. The length of an edge of each cell is set to 0.1 mm and, therefore, physical dimensions of the computational domain are: (i) 10 mm in x- and y-axis, and (ii) 20 mm in z-axis. The parameter ε was set to 1/2.
Fig. 1.
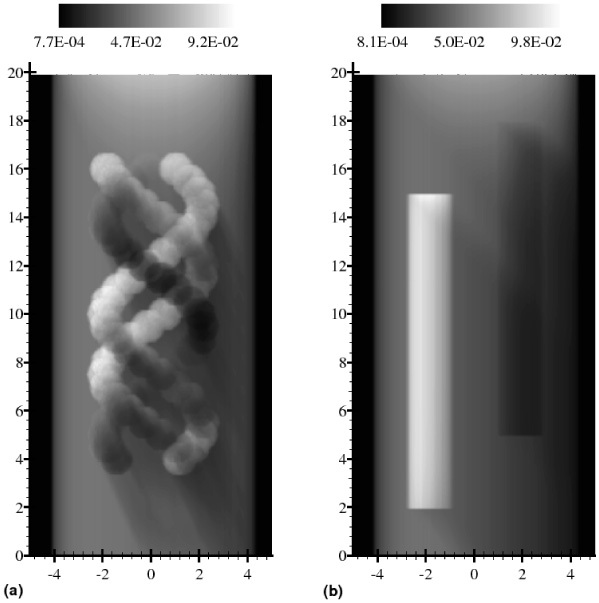
(a) (Media 1 (3.9MB, AVI) ) Three twisted spirals built from scattering balls are embedded in a weakly scattering cylinder with background transport coefficient μ =0.1 mm−1 and albedo λ = 0.999. Value of the transport coefficient for each scattering ball is set to μ = 0.75 mm−1. Two spirals have the background value of the albedo and one absorbing spiral has the value of albedo λ = 0.25. The direct light enters the domain along the direction s0 = 2−1/2 (1,0,−1)T. Camera was rotated around the weakly scattering cylinder, whose axis is aligned along z-axis, by 153° with respect to the initial position n = (1,0,0)T, where n is the camera normal. (b) (Media 2 (3.3MB, AVI) ) Two highly scattering cylinders are embedded in a weakly scattering cylinder with the same optical properties as in (a). Both highly scattering cylinders have μ = 0.75 mm−1, one of them has a low value of the albedo, λ = 0.25. The direct light enters the domain along the same direction as in (a).The camera was rotated by 117° from its initial position around z-axis in the positive direction.
In the left Fig. 1a three twisted spirals (the triple helix), which were built from scattering balls, serve as a highly scattering object. The spirals are embedded in a weakly scattering cylinder, whose symmetry axis is aligned along z-axis. It has the background transport coefficient μ = 0.1 mm−1 and the albedo λ = 0.999. The value of the transport coefficient for each ball is set to μ = 0.75 mm−1. Two spirals have the background value of the albedo and one absorbing spiral has the value of albedo λ = 0.25. In regions where balls overlap, the density of scattering particles is increased and, therefore, values of parameters are computed accordingly as described in section 2.1. The direct radiation I0 enters the domain along the direction s0 =2−1/2 (1,0,−1)T. The amplitude of the direct radiation is set to 1. A camera rotates around the z-axis. It is convenient to describe a position of the camera by a normal vector n to its CCD array. We set the initial position of the camera as n = (1,0,0)T . In Fig. 1a the camera was rotated by 153° with respect to the initial position. In the figure on the right (Fig. 1b) two highly scattering cylinders are embedded in a weakly scattering cylinder. The weakly scattering cylinder has the same optical properties as above. Both highly scattering cylinders have μ = 0.75 mm−1, one of them has a low value of the albedo, λ = 0.25. The direct light enters the domain along the same direction as above. The camera was rotated by 117° from its initial position around the z-axis in the positive direction. In addition to these figures, two multimedia files show animated camera's views over 360° of the triple helix and cylinders (Media 1 (3.9MB, AVI) , Media 2 (3.3MB, AVI) ). The camera was rotated around the z-axis with 3° angular step. These two cases will be used below for reconstruction experiments.
2.3. Inverse problem
Depending on the scattering properties of objects the Radon transform [24] can be applied for computing the transport coefficient μ from projection datasets due to domination of the direct radiation in the transmitted light. However, this approach has limited applicability because it does not take into account forward scattered intensity, and does not allow reconstruction of two parameters. Inversion formulae for the attenuated Radon transform ( [25–28]) could not be used with this type of tomographic imaging for the reason that the function B in Eq. (6) depends on the direct radiation, whose direction s0 varies. Moreover, the diffusive nature of light transport in highly scattering regions makes the inverse problem to be three-dimensional. Therefore, we use a variational framework [29].
The variational problem is formulated as a minimization problem of the cost functional:
| (16) |
where the error norm is given as:
| (17) |
Intensities IE and I are experimentally recorded and computed intensities in the direction s, respectively. The function ξ (s) is introduced for convenience and represent sampling of the camera's positions
| (18) |
where −sn can be replaced with the normal vector to the CCD array n, and N is the number of positions of the camera. Similarly, the functions χθ and ς represent sampling of measurements in space and frequency
| (19) |
where M is the number of the camera's pixels; L denotes the number of samples in the Fourier domain (ω); the vector rm denotes the surface points visible by the CCD camera. Factors σm are surface areas supporting rm such that ∫ χ (r)d3r gives the total visible area. This form of 𝓔 is chosen in order to simplify a variational procedure. Thus, the function χ allows to replace a sum over surface points visible by the CCD camera with a volume integral. Analogously, the function ς replaces a sum over samples in the Fourier domain with an integral.
The Lagrangian term in Eq. (16) is denoted by 𝓛 and explicitly given by
| (20) |
where 〈·, ·〉 denotes the inner product and J is the adjoint intensity. The dynamic form of the penalty term is chosen, which depends on (k + 1)-th and k-th iterations as
| (21) |
where Δμ = μk+1−μk, Δλ = λk+1−λk, αμ and αλ are Tikhonov regularization parameters.
The reconstruction algorithm is based on the condition that the first variation δℱ(I,u, J,μ,λ) vanishes. Variation of J recovers Eq. (1) while the variation of I results in the adjoint transport equation
| (22) |
where asterisk denotes complex conjugation. Notice that in Eq. (22) the propagation direction is reversed s = −sn. Therefore, the adjoint intensity J* propagates from the CCD array in direction of its normal n. Variations of optical parameters μ and λ results in two equations
| (23) |
where functions fμ and fλ are computed according to
| (24) |
| (25) |
In many practical cases ω/μc≪1 and, therefore, terms containing this parameter in Eqs. (24) and (25) can be neglected. It is also interesting to notice that the second term in Eq. (24) disappears for the time-independent case. Formally, Eqs. (23) represent an iterative backprojection algorithm, when backprojected functions fμ and fλ are products of J* with various combinations of I0, I, u and s·∇u.
Tikhonov regularization parameters are estimated from the following consideration. Let us consider αμ first. From Eqs. (23) we find that
| (26) |
Next, ∥Δμ∥ must decay together with 𝓔1/2 and, therefore
| (27) |
where the coefficient C(k)μ in general depends on the iteration number k and decreases with k. Analogously, we find
| (28) |
where C(k)λ is analogous to C(k)μ. Iterations are terminated when the functional 𝓔 + ϒ attains its minimal value.
3. Numerical experiments
The dataset for reconstruction was computed by solving direct problems, Eq. (6), when the direction of the incident direct radiation, s0, was rotated by 5° around the z-axis over 360° starting from its initial direction s0 = (1,0,0)T. The source plane r0 · s0 = const was parallel to the z-axis (ez · s0 = 0) and set at some distance from the scattering domain. Free space was assumed to be non-absorbing and non-scattering. For each direction of s0 images were acquired by rotating the CCD camera. The camera's viewing direction is controlled by its normal n, which was rotated independently of s0 around the z-axis with angular step of 90° starting from the its initial direction n = (1,0,0)T. The first approximation to the transport coefficient was computed from the projection dataset when s0 and n differ by 180°. The albedo was reconstructed from angularly selective intensity measurements, when s0 and n differ by 90° and 270°. The first approximation to the transport coefficient was further corrected from angularly selective intensity measurements.
We start reconstruction experiments with the case of two highly scattering cylinders embedded inside a weakly scattering medium. Reconstruction results are shown at z = 10 mm in Fig. 2. The left slice (Fig. 2a) demonstrates reconstruction of the transport coefficient μ, while the right slice (Fig. 2b) displays reconstructed albedo.
Fig. 2.
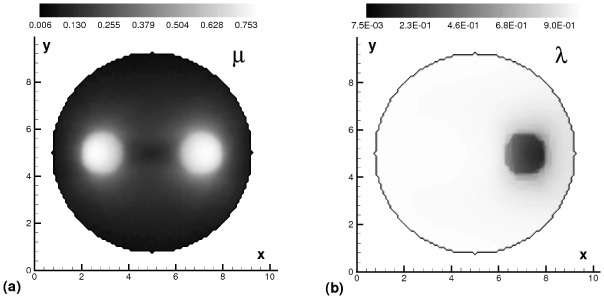
Reconstruction results showing middle slices at z = 10. (a) Reconstructed transport coefficient μ (b) Reconstructed albedo λ
For analyzing the three-dimensional structure of reconstructed parameters, isosurfaces were computed and shown in Fig. 3. On the left the isosurface of the transport coefficient is shown (Fig. 3a) and on the right (Fig. 3b) the isosurface of reconstructed albedo is displayed.
Fig. 3.
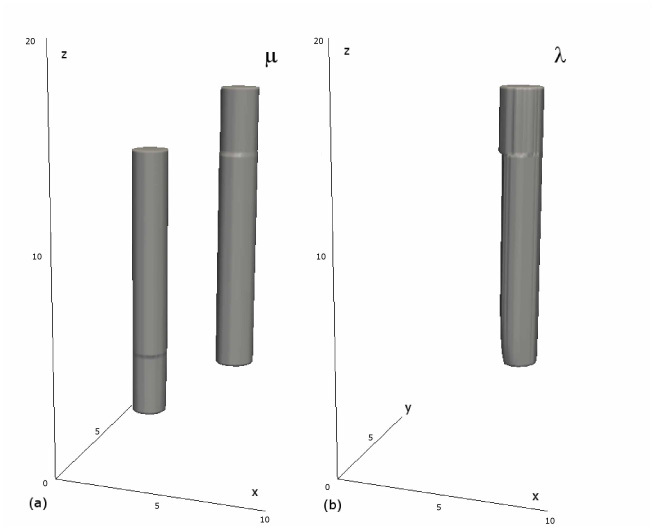
(a) Isosurface of the transport coefficient μ. (b) Isosurface of the albedo λ.
As is seen in Fig. 3, the reconstruction is relatively accurate. However, both isosurfaces have kinks along the z-axis. These kinks are caused by obstructions of one cylinder by another for projection acquisition and by the cylinders' shadows for angularly selective measurements. It is worthwhile to mention that obstructions and shadows result in opposite effects on reconstruction.
Slices showing reconstruction results for the case of a triple helix are displayed in Fig. 4. Slices are taken at different heights. Thus, the first row show parameters at z = 9 mm, while the second row show parameters at z=11 mm. Left column displays the transport coefficient μ and the right column shows the albedo λ. Quantitatively our reconstruction approach demonstrates accurate results. Even increase of the transport coefficient in a regions where scattering balls overlap with each other is clearly seen. However, there is some noise present on the weakly scattering background.
Fig. 4.
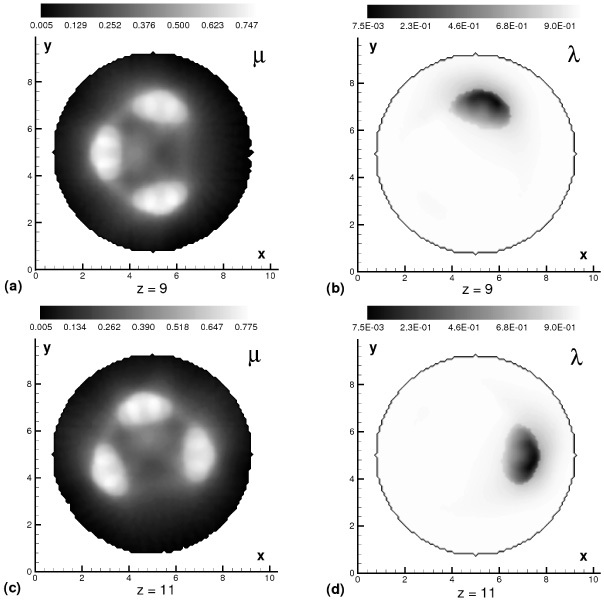
Slices showing reconstruction results of the triple helix at two different heights (a–b) Reconstructed transport coefficient μ albedo λ at z = 9mm. (c–d) μ and λ at z = 11mm.
Isosurfaces were also computed for the analysis of spatial accuracy of reconstruction. They are shown in Fig. 5, where (i) Fig. 5a displays the isosurface of the transport coefficient and (ii) Fig. 5b shows the albedo. Reconstruction results demonstrate good separation of the twisted spirals.
Fig. 5.
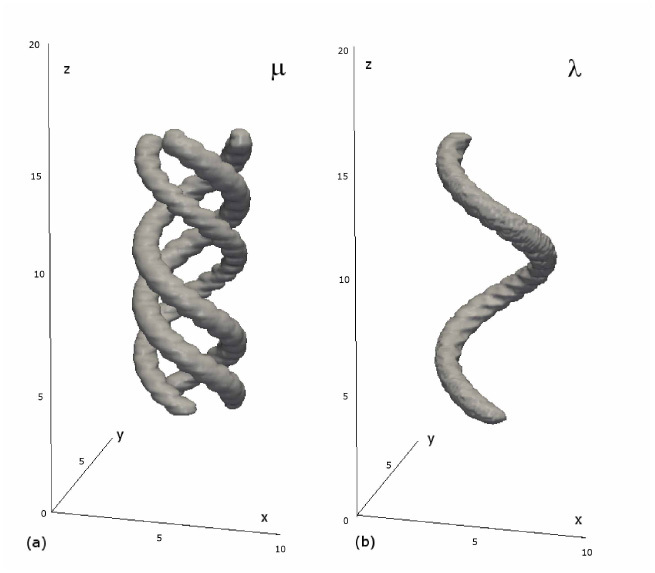
(a) Isosurface of the transport coefficient μ. (b) Isosurface of the albedo λ.
Computation time of the direct problem depends on a volume of highly scattering inclusions. That is because the most expensive part of the algorithm is the solution of the Helmholz equation, Eq. (10). For the case presented here the solution time is approximately 29 seconds on 2GHz processor, where 23 seconds are taken for solving the Helmholz equation and only 6 seconds for line integrations, Eqs. (5), (6). The algorithm was implemented in the Fourier domain for further application for time-gating imaging. Thus, for the real case the solution of the Helmholtz equation will be faster. Computation time of the inverse problem depends on the initial guess. Here we assumed a weakly scattering medium initially and, therefore, the first approximation to the transport coefficient was estimated without solving the Helmholz equation. Correction of the transport coefficient and reconstruction of the albedo requires solving the Helmholtz equation. In total, the computation time for solving the inverse problem for each of two cases was less than 2 hours.
In summary we have investigated the problem of optical tomography in a weakly scattering medium in the presence of highly scattering inclusions. The approach is based on the assumption that the transport coefficient of the scattering media differ by an order of magnitude for weakly and highly scattering regions. This situation is common for optical imaging of live objects such an embryo and, therefore, we believe that our approach can find applications in biomedical imaging. This approach was verified by reconstructions of two optical parameters from numerically simulated datasets.
Acknowledgments
This work was supported by the Wellcome Trust Technology Development grant 086114.
References and links
- 1.Shaw P. J., Agard D. A., Hiraoka Y., Sedat J. W., “Tilted view reconstruction in optical microscopy. Three-dimensional reconstruction of Drosophila melanogaster embryo nuclei,” Biophys. J. 55(1), 101–110 (1989). 10.1016/S0006-3495(89)82783-3 [DOI] [PMC free article] [PubMed] [Google Scholar]
- 2.Brown C. S., Burns D. H., Spelman F. A., Nelson A. C., “Computed tomography from optical projections for three-dimensional reconstruction of thick objects,” Appl. Opt. 31(29), 6247–6254 (1992). 10.1364/AO.31.006247 [DOI] [PubMed] [Google Scholar]
- 3.Sharpe J., Ahlgren U., Perry P., Hill B., Ross A., Hecksher-Sørensen J., Baldock R., Davidson D., “Optical projection tomography as a tool for 3D microscopy and gene expression studies,” Science 296(5567), 541–545 (2002). 10.1126/science.1068206 [DOI] [PubMed] [Google Scholar]
- 4.Vinegoni C., Pitsouli C., Razansky D., Perrimon N., Ntziachristos V., “In vivo imaging of Drosophila melanogaster pupae with mesoscopic fluorescence tomography,” Nat. Methods 5(1), 45–47 (2008). 10.1038/nmeth1149 [DOI] [PubMed] [Google Scholar]
- 5.Fauver M., Seibel E. J., Rahn J. R., Meyer M. G., Patten F. W., Neumann T., Nelson A. C., “Three-dimensional imaging of single isolated cell nuclei using optical projection tomography,” Opt. Express 13(11), 4210–4223 (2005). 10.1364/OPEX.13.004210 [DOI] [PubMed] [Google Scholar]
- 6.McGinty J., Tahir K. B., Laine R., Talbot C. B., Dunsby C., Neil M. A. A., Quintana L., Swoger J., Sharpe J., French P. M. W., “Fluorescence lifetime optical projection tomography,” J Biophotonics 1(5), 390–394 (2008). 10.1002/jbio.200810044 [DOI] [PubMed] [Google Scholar]
- 7.Bassi A., Brida D., D’Andrea C., Valentini G., Cubeddu R., De Silvestri S., Cerullo G., “Time-gated optical projection tomography,” Opt. Lett. 35(16), 2732–2734 (2010). 10.1364/OL.35.002732 [DOI] [PubMed] [Google Scholar]
- 8.Wang L., Jacques S. L., Zheng L., “MCML--Monte Carlo modeling of light transport in multi-layered tissues,” Comput. Methods Programs Biomed. 47(2), 131–146 (1995). 10.1016/0169-2607(95)01640-F [DOI] [PubMed] [Google Scholar]
- 9.Fang Q., Boas D. A., “Monte Carlo simulation of photon migration in 3D turbid media accelerated by graphics processing units,” Opt. Express 17(22), 20178–20190 (2009). 10.1364/OE.17.020178 [DOI] [PMC free article] [PubMed] [Google Scholar]
- 10.Alerstam E., Yip Lo W. C., Han T. D., Rose J., Andersson-Engels S., Lilge L., “Next-generation acceleration and code optimization for light transport in turbid media using GPUs,” Biomed. Opt. Express 1(2), 658–675 (2010). 10.1364/BOE.1.000658 [DOI] [PMC free article] [PubMed] [Google Scholar]
- 11.Dorn O., “A transport-backtransport method for optical tomography,” Inverse Probl. 14(5), 1107–1130 (1998). 10.1088/0266-5611/14/5/003 [DOI] [Google Scholar]
- 12.Tarvainen T., Vauhkonen M., Arridge S. R., “Gauss-Newton reconstruction method for optical tomography using the finite element solution of the radiative transfer equation,” J. Quant. Spectrosc. Radiat. Transf. 109(17-18), 2767–2778 (2008). 10.1016/j.jqsrt.2008.08.006 [DOI] [Google Scholar]
- 13.Tarvainen T., Vauhkonen M., Kolehmainen V., Kaipio J. P., “Finite element model for the coupled radiative transfer equation and diffusion approximation,” Int. J. Numer. Methods Eng. 65(3), 383–405 (2006). 10.1002/nme.1451 [DOI] [Google Scholar]
- 14.Ren K., Abdoulaev G. S., Bal G., Hielscher A. H., “Algorithm for solving the equation of radiative transfer in the frequency domain,” Opt. Lett. 29(6), 578–580 (2004). 10.1364/OL.29.000578 [DOI] [PubMed] [Google Scholar]
- 15.Klose A. D., Netz U., Beuthan J., Hielscher A. H., “Optical tomography using the time-independent equation of radiative transfer - Part 1: forward model,” J. Quant. Spectrosc. Radiat. Transf. 72(5), 691–713 (2002). 10.1016/S0022-4073(01)00150-9 [DOI] [Google Scholar]
- 16.Klose A. D., Ntziachristos V., Hielscher A. H., “The inverse source problem based on the radiative transfer equation in optical molecular imaging,” J. Comput. Phys. 202(1), 323–345 (2005). 10.1016/j.jcp.2004.07.008 [DOI] [Google Scholar]
- 17.Bal G., “Radiative transfer equations with varying refractive index: a mathematical perspective,” J. Opt. Soc. Am. A 23(7), 1639–1644 (2006). 10.1364/JOSAA.23.001639 [DOI] [PubMed] [Google Scholar]
- 18.Florescu L., Schotland J. C., Markel V. A., “Single-scattering optical tomography,” Phys. Rev. E Stat. Nonlin. Soft Matter Phys. 79(3), 036607 (2009). 10.1103/PhysRevE.79.036607 [DOI] [PubMed] [Google Scholar]
- 19.Florescu L., Schotland J. C., Markel V. A., “Single-scattering optical tomography: simultaneous reconstruction of scattering and absorption,” Phys. Rev. E Stat. Nonlin. Soft Matter Phys. 81(1), 016602 (2010). 10.1103/PhysRevE.81.016602 [DOI] [PubMed] [Google Scholar]
- 20.V. V. Sobolev, A Treatise on Radiative Transfer (D. Van Nostrand Company, Inc., 1963). [Google Scholar]
- 21.Arridge S. R., “Optical tomography in medical imaging,” Inverse Probl. 15(2), R41 (1999). 10.1088/0266-5611/15/2/022 [DOI] [Google Scholar]
- 22.Arridge S. R., Schotland J., “Optical tomography: forward and inverse problems,” Inverse Probl. 25(12), 123010 (2009). 10.1088/0266-5611/25/12/123010 [DOI] [Google Scholar]
- 23.Siddon R. L., “Fast calculation of the exact radiological path for a three-dimensional CT array,” Med. Phys. 12(2), 252–255 (1985). 10.1118/1.595715 [DOI] [PubMed] [Google Scholar]
- 24.S. R. Deans, The Radon Transform and some of its applications, (Dover Publications, 2007). [Google Scholar]
- 25.Tretiak O., Metz C., “The exponential Radon transform,” SIAM J. Appl. Math. 39(2), 341–354 (1980). 10.1137/0139029 [DOI] [Google Scholar]
- 26.Natterer F., “On the inversion of the attenuated Radon transform,” Numer. Math. 32(4), 431–438 (1979). 10.1007/BF01401046 [DOI] [Google Scholar]
- 27.Natterer F., “Inversion of the attenuated Radon transform,” Inverse Probl. 17(1), 113–119 (2001). 10.1088/0266-5611/17/1/309 [DOI] [Google Scholar]
- 28.Finch D. V., “The attenuated X-Ray transforms: recent developments,” Inverse Probl. 47, 47–66 (2003). [Google Scholar]
- 29.J. Nocedal, and S. J. Wright, Numerical Optimization, (Springer-Verlag Inc., 1999). [Google Scholar]


