Abstract
Ocular monochromatic aberrations display dynamic behavior even when the eye is fixating on a stationary stimulus. The fluctuations are commonly characterized in the frequency domain using the power spectrum obtained via the Fourier transform. In this paper we used a wavelet-based multifractal analytical approach to provide a more in depth analysis of the nature of the aberration fluctuations. The aberrations of five subjects were measured at 21 Hz using an open-view Shack-Hartmann sensor. We show that the aberration dynamics are multifractal. The most frequently occurring Hölder exponent for the rms wavefront error, averaged across the five subjects, was 0.31 ± 0.10. This suggests that the time course of the aberration fluctuations is antipersistant. Future applications of multifractal analysis are discussed.
OCIS codes: (330.4875) Optics of physiological systems; (330.7326) Visual optics, modeling
1. Introduction
It is well established that when fixating on a target at a constant vergence, the monochromatic aberrations of the human eye display dynamic behavior; see for example [1]. The properties of these dynamics are commonly characterized in the frequency domain by computing power spectra using the Fourier transform. Such studies have shown that:
| (1) |
where PSD(f) is the power spectral density at a given frequency f, and β is the spectral index. β is determined from a linear regression of log PSD(f) on log f. For the human eye, the spectral index of the time evolution of rms wavefront error has been found to be in the region of 1.1-1.5 [1–5]. Power spectra of the type in Eq. (1) are characteristic of self-affine time series, and hence fractal processes [6]. Fractals are the building blocks of nature and are found everywhere. Examples of physiological fractal processes include fluctuations in the heartbeat and brain waves [7–9]. The importance of fractal analysis in physiological signals is that it allows one to gain a greater understanding of the underlying process and allows one to discern health from pathology [10].
Fractal processes are characterized by their fractal dimension D. The larger the fractal dimension, the more the time series fills the Euclidean space it is contained in, and the higher the degree of irregularity [11]. There are several definitions of D and several methods are used to calculate it. One example is the so-called box counting dimension, where
| (2) |
where Nε is the number of non-overlapping boxes of length ε required to cover the time series [6]. An intuitive meaning of Dbox is shown in Fig. 1 for the case of a square object. The procedure for a time series is fundamentally the same.
Fig. 1.

The meaning of fractal dimension Dbox as calculated using the box counting dimension. It can be argued that a square is not a true fractal as it does not have a fractional dimension. It is included here merely to give an intuitive illustration of fractal dimension.
The spectral index can be used to classify a physiological time series as a realization of either a fractional Gaussian noise (fGn) process or fractional Brownian motion (fBm) process [6]. The time series can be considered an fGn process if β < 1 and an fBm process if β > 1 [6]. Ideally, when determining β for this purpose, the high frequency components beyond fs/8, where fs is the sampling frequency, should be discarded [6]. This is not always the case when β is reported for the eye. Using the values reported in the literature, β > 1, and so the aberration dynamics can be classified as a realization of an fBm process [6]. For such a process, it can be shown that D can be determined from β via the Hurst exponent HfBm using
| (3) |
where HfBm is the Hurst exponent [6]. The Hurst exponent describes the scaling properties of the time series as under the transformation
| (4) |
where the x dimension is scaled by a factor λ, the statistical properties of the signal remain invariant if the y dimension is scaled by
| (5) |
Hence the scaled signal looks similar to the original version of the signal as illustrated in Fig. 2 . HfBm is related to the spectral index by
| (6) |
Given the reported values of β found in the literature, one can expect HfBm to fall in the range 0.05 – 0.25. The Hurst exponent is also a measure of the smoothness of the time series and varies between 0 – 1 [12]. If HfBM > 0.5, the time series is persistent, i.e., it tends to continue in the direction it is moving and is smoother [12]. For HfBM < 0.5, which is the case found for the aberration fluctuations, the signal is antipersistent and tends not to continue in the same direction but to turn back on itself giving a less smooth signal. From Eq. (3), one can expect the fractal dimension of the ocular aberration dynamics to fall in the range 1.75 – 1.95.
Fig. 2.
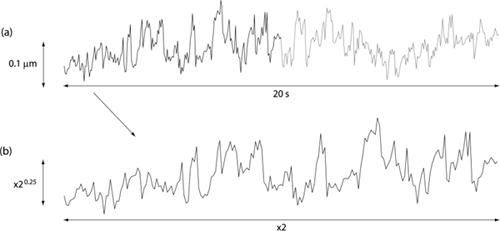
(a) An example of the time course of the rms wavefront error of one subject measured over a 6 mm pupil and sampled at 21 Hz. (b) A section of the signal in (a) scaled using Eqs. (4) and (5). Hurst exponent = 0.25.
Using the power spectrum to characterize the fractal properties of the aberration dynamics is limited however as it assumes that the signal is monofractal, i.e. it can be described by a single Hurst exponent and fractal dimension. Many physiological processes such as the heartbeat are in fact multifractal as opposed to monofractal [7–9]. For multifractal time series, H, and consequently D, may vary in time. Hence a more in depth analytical approach is required to characterize such time series. As ocular aberration dynamics show some correlation with the heart beat [13–15], the aim of this investigation was to determine if the fluctuations in aberrations are also multifractal. This was achieved using a wavelet-based approach.
2. Aberration measurements
Aberrations were measured using a Shack-Hartmann sensor as shown in Fig. 3 . The eye is illuminated by a 785 nm laser diode which provides the light for the wavefront sensing. The beam first passes through a rotating diffuser to reduce speckle and enters the eye via reflection from a hot mirror. As the hot mirror passes visible light subjects were able to see the target in open-view making the viewing more natural. The target used was a black Maltese cross viewed on an LCD monitor. It subtended 11.32 minutes of arc at the eye and was placed at a distance of 2.7 m (accommodative demand of 0.37 D). The luminance was 255 cd/m2. Further details of the system can be found at [4,16].
Fig. 3.
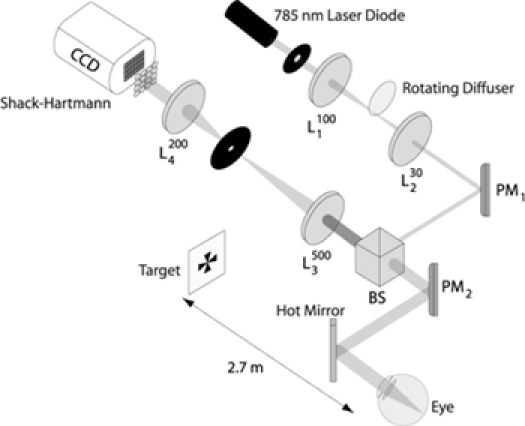
Shack-Hartmann sensor used for measurement of aberrations. PM: plane mirror; BS: beamsplitter; L: lens. Focal length is in millimeters.
Aberrations were measured on the right eye of five subjects at 21 Hz for a 24 s time period. We found that subjects KH and CV could not maintain fixation for this length of time and so their aberrations were measured over 12 s. The subject demographics are shown in Table 1 . Measurements were made over the natural pupil size of each subject and those who required spectacles wore them during the experiment. Subjects were stabilized using a bite bar. For each Shack-Hartmann measurement the Zernike coefficients up to and including fifth radial order were determined using the OSA convention [18]. To reduce the impact of eye movements on the reconstruction of the Zernike polynomials, we calculated the pupil center relative to the lenslet array center, for each measurement frame. Each spot position relative to the center of the lenslet array was given a weighting of one. The centroid of these positions was taken as the shift in the pupil center relative to the center of the lenslet array [16]. Blinks were removed using a cubic spline function that interpolated between the data points before and after a blink [16,17]. From the coefficients, the time course of the rms wavefront error was determined.
Table 1. Subject demographics.
| Subject | Age (yrs) | Pupil Dia. (mm) | Refraction |
|---|---|---|---|
| JC | 32 | 6.0 | Plano |
| KH | 29 | 5.5 | −1.75/-0.50 × 90 |
| YP | 24 | 5.0 | Plano |
| CS | 25 | 4.5 | −6.00/-0.50 × 60 |
| CV | 28 | 4.0 | −4.25/-1.25 × 5 |
3. Fractal analysis
To characterize the fractal properties of the rms wavefront error a multifractal formalism approach was used [19]. This essentially consists of determining the distribution of singularities (abrupt changes) contained in the signal. A singularity is characterized by its Hölder exponent h, which is inversely proportional to the strength of the singularity. The Hölder exponent reflects the rate of decay of the amplitude of the fluctuations in the time series in the neighborhood of the time location that is being analyzed [20]. A high value for the Hölder exponent indicates the signal is smooth in that region and so the singularity strength is low. For a monofractal time series, there is one singularity strength (i.e. one value for the scaling exponent) present, and so the Hurst exponent, which is a global measure, is equal to the Hölder exponent [21]. For a multifractal time series, the singularity strength - and hence scaling properties - are different for different time (or ‘box’) locations. In this case the Hölder exponents can be thought of as ‘local Hurst exponents’ [21], and H becomes h in Eq. (3).
To characterize the signal a singularity (multifractal) spectrum is calculated. This represents the statistical distribution of h. An example of such a spectrum is shown in Fig. 4 . The x-axis represents the Hölder exponent (inverse of singularity strength), and the y-axis represents the Hausdorff dimension DHaus. DHaus represents how completely each Hölder exponent fills the space (time series) it is embedded in. Hence DHaus(h) is the fractal dimension of the singularities characterized by h [22]. For a time series, the maximum possible value of DHaus(h) is one. This would indicate that the singularity represented by h is present everywhere in the signal [23,24].
Fig. 4.
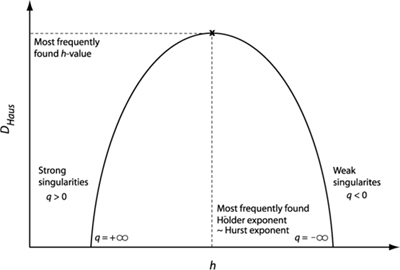
A typical singularity spectrum for a multifractal time series. For a monofractal time series the singularity spectrum would be a single point.
3.1 Overview of singularity spectrum determination
Calculation of the singularity spectrum can be achieved via a statistical mechanics based approach and as such involves concepts such as the partition function [23]. This circumvents problems associated with non-isolated singularities, as is often the case for real data [23]. For discussion of the relationship between concepts of thermodynamics and calculation of multifractal spectra as applied here, see for example [23]. For a measure μ, the partition function Z(ε,q) is given by
| (7) |
where ε is the box size and so represents the scale at which μ is analyzed. Nε is the number of boxes of size ε needed to cover the signal and q is the moment [19]. Positive q-values accentuate (increase the weight of) the strong singularities in the formulation of Z(ε,q) while negative values accentuate the weak singularities. The next step is calculation of the mass exponents given by [25]:
| (8) |
and so τ(q) describes the scaling of Z with ε:
| (9) |
The spectrum and τ(q) are related via a Legendre transform giving
| (10) |
where
| (11) |
For a monofractal time series τ(q) is linear and the singularity spectrum consists of a single point. For a multifractal time series τ(q) is non-linear and the singularity spectrum takes the form as shown in Fig. 4. As the maximum of DHaus represents the most frequently occurring Hölder exponent, this Hölder exponent can be considered to be the Hurst exponent that best describes the time series [23].
3.2 Singularity spectrum determination via wavelets
The main role of wavelets in multifractal analysis is in calculation of the partition function. In this case the wavelet is effectively the box in Eq. (7), where ε is the wavelet scale (see below). The wavelet transform coefficients are the measure μ. Several authors have demonstrated the advantage of wavelet-based techniques over other methods such as traditional box counting methods, see for example [21]. Each step will now be outlined and the reason for the choice of a wavelet-based approach is highlighted.
3.2.1 Continuous wavelet transform
The wavelet coefficients are determined from the continuous wavelet transform (CWT). The CWT of a signal x(t) is given by
| (12) |
which constitutes a convolution of the signal x(t) with a wavelet Ψ that is translated by τ and scaled (stretched) by s. The scale is inversely proportional to frequency. The 1/s normalization factor has been used as it removes any bias associated with frequency [26]. There are several conditions that need to be satisfied in order for a waveform to be a valid wavelet, such as the waveform having zero mean [12]. We used the so called Mexican hat (second derivative of Gaussian) wavelet. This wavelet is orthogonal to polynomials of order 1 and so linear trends due to drifts in accommodation are removed. This ability to remove low-order polynomials is one of the advantages of using wavelets for multifractal analysis, as such polynomials may mask the detection of singularities [19]. Figure 5 shows the Mexican hat wavelet and illustrates how the CWT is formed.
Fig. 5.
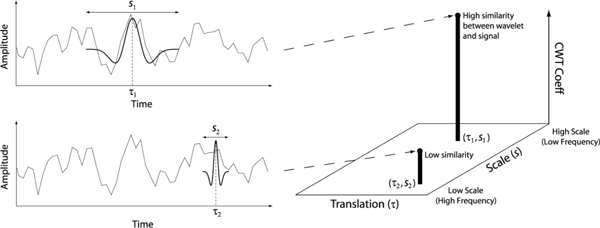
How the CWT is formed. For each wavelet position τ, and wavelet width (scale) s, the wavelet is convolved with the signal to form a point in the CWT. The Mexican hat wavelet is shown.
3.2.1.1 Practical implementation
The CWT coefficients were calculated using the cwt function of the Matlab Wavelet Toolbox, (Matlab version R2009a, Wavelet Toolbox version 4.4). Following this, the modulus of each coefficient was calculated. It was these coefficients that were used throughout the analysis. Figure 6b shows the CWT coefficients of the rms wavefront error (Fig. 6a) for subject JC. The corresponding frequency represented by each scale fscale, is also shown. This was calculated using the Matlab function scal2frq in which
| (13) |
where fc is an estimate of the frequency of the mother (unscaled) wavelet found from the dominant peak in the Fourier based power spectrum of the wavelet, s is scale, and ΔT is the time between samples. For the Mexican hat wavelet fc is 0.25 Hz. The minimum scale (maximum frequency) used in the analysis was the closest integer scale corresponding to when fs was the Nyquist frequency (10.5 Hz). The maximum scale (minimum frequency) was the closest integer scale corresponding to when fs was the inverse of the length of the signal: 0.04 Hz for JC, EM and CS, 0.08 Hz for KH and CV.
Fig. 6.
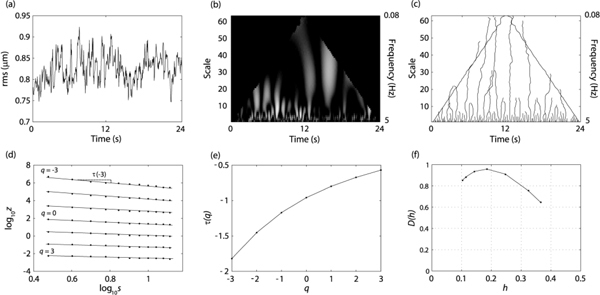
Analytical procedure to obtain the singularity spectrum. (a) The time evolution of the rms wavefront error for JC. (b) The continuous wavelet transform. (c) The modulus-maxima map. (d) Log of the partition function versus log of the scale. (e) The tau mass exponents obtained from the slope of the lines in (d). (f) The singularity spectrum obtained from (e) and Eq. (10).
Edge effects are inherent to the CWT calculation as part of the wavelet will ‘over-hang’ the data at the beginning and end. This effect will increase for increasing scales owing to a concomitant increase in the width of the wavelet. The region in which edge effects become significant is the cone of influence (COI) [27]. To calculate the COI we calculated the CWT for a function that consisted of two delta functions separated by the signal length. The region in which the modulus of the CWT was less than 1% of that at the edge was considered to be free of edge effects. The COI is illustrated by the black regions in Fig. 6b.
3.2.2 Wavelet transform modulus maximum map
As discussed earlier, multifractal analysis consists of locating and determining the strength of the singularities contained in the time series. This is achieved by first determining the locations of the local maxima for each scale. For a given scale s, point (s,τmax) is a local maximum if |CWT(s,τ)|<|CWT(s,τmax)| when τ is either to the left or right of τmax and |CWT(s,τ)| ≤|CWT(s,τmax)| the other side [28]. Following this the maxima are chained across scales to form modulus maxima lines. It can be shown that the locations of the singularities are the τ values where the maxima lines converge at small scales [28,29]. Only maxima belonging to these chains are used in the calculation of the partition function. From Eq. (7), the partition function becomes
| (14) |
where CWT(s,mi) is the coefficient of the maxima i at scale s, and Nm is the number of maxima at that scale. In effect, the locations of the modulus maxima tell us where to position our ‘boxes’ to capture the singular behavior of the time series [19].
3.2.2.1 Practical implementation
The maxima are chained together from high to low scale to reduce the effects of noise. Chains that do not persist down to the smallest scale are removed. For q < 0, small values of the CWT result in divergences in the partition function. To prevent this, for each chain, the CWT values are tracked from low to high scale and at each scale the supremum is taken [19].
As mentioned previously, blinks were removed from the signal and the corresponding data points were replaced by a cubic spline function. Any chains which ended in these interpolated points were removed from further analysis. Figure 6c shows the resulting so-called skeleton map for JC.
3.2.3 Spectrum determination
Figure 6e shows the τ(q) spectrum that was determined using Eq. (8). The Hölder exponents are given by the slope of the τ(q) spectrum (Eq. (11)). Finally the spectrum is calculated using Eq. (10). The singularity spectrum for the rms wavefront error for JC is shown in Fig. 6f. The q values used were −3 to + 3.
3.3 Power spectrum analysis
We also calculated the power spectrum of the rms wavefront error using the Fourier transform. As mentioned previously, the spectral index β can be used to classify a signal and determine its fractal dimension. When doing so it is recommended that the high frequency components in the range fs/8 < fs< fs/2, where fs is the sampling frequency, are excluded [6]. We calculated the spectral index using two frequency regimes, one including the full frequency range 0.04 (or 0.08)-10.5 Hz, and one including only the low frequency region 0.04 (or 0.08)-2.63 Hz.
4. Results
Figure 7 shows the CWT of the rms wavefront error for each subject. As can be seen from the figure, the CWT for each subject shows a flame-like pattern, although the individual subtleties are different from subject to subject. Figure 8 shows the CWT for each Zernike aberration for YP. As can be seen from the plots, the CWT of each individual aberration also reveals a flame-like pattern. This was true for all subjects. Figure 9 shows the singularity spectra for the rms wavefront error for all subjects. The most frequently found Hölder exponent, h(q = 0), averaged across subjects is 0.31 ± 0.10. Using Eq. (3), this corresponds to an average fractal dimension (DHurst) of 1.69. Figure 10 shows the most frequently found Hölder exponent for each aberration averaged across subjects.
Fig. 7.
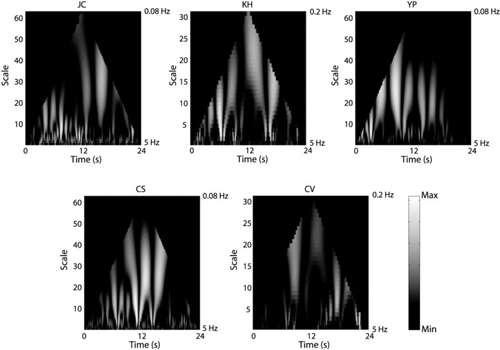
CWT for the rms wavefront error each subject. The plots have been normalized for each subject.
Fig. 8.
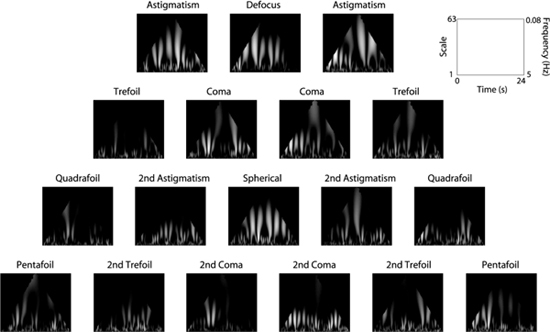
CWT of each aberration for YP.
Fig. 9.
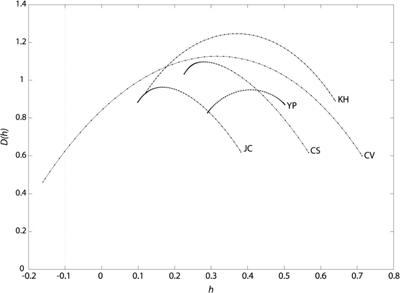
rms wavefront error singularity spectrum for each subject.
Fig. 10.
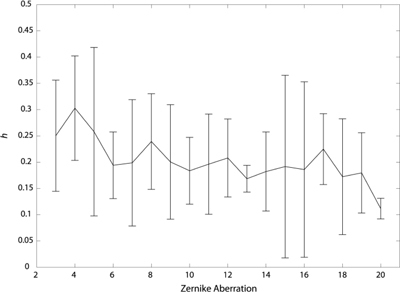
Average most frequently found Hölder exponent across subjects for each aberration. Error bars represent ± 1 S.D.
Figure 11 shows the power spectrum of the rms wavefront error for each subject. The average spectral index was 1.35 ± 0.23 for the full frequency range, and 1.31 ± 0.32 for the low frequency range. Using Eq. (6), this corresponds to an estimated average Hurst exponent of 0.18 and 0.16 for the full and low frequency regions respectively.
Fig. 11.
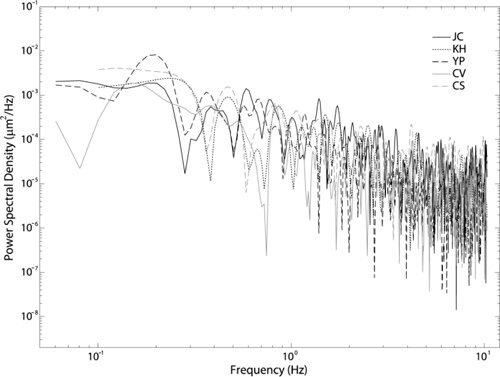
Power spectrum of the rms wavefront error for each subject.
5. Discussion
In this study we examined the fractal properties of the ocular aberration dynamics of five subjects whilst they viewed a stationary target close to optical infinity.
5.1 Comparison with previous studies
When considering the power spectrum of the rms wavefront error we found an average slope of 1.35 using the full available frequency range. This value is in accordance with other studies; see for example [1–5]. When considering the low frequency range the average slope was 1.31 confirming that the aberration dynamics can be classified as an fBm process. An fBm is a non-stationary process, confirming other studies that indicate the aberration dynamics are not stationary [30,31]. The small difference between the slopes for the full frequency range and low frequency range may be because of the vergence of the target [32]. Future work will include using different viewing distances.
5.2 Fractal nature of aberration dynamics
The CWT plots show the self-similarity present in each individual aberration and the rms wavefront error. The characteristic flame-like patterns are similar across subjects and aberrations. Studies have indicated that higher frequency components of the aberration dynamics tend to be more transient compared to lower frequency components [30,31]. The CWT provides a multiresolution analysis in which low frequency components are better resolved in frequency, and higher frequency components are better resolved in time. Hence the CWT is ideally suited to characterize ocular aberration dynamics.
Like other physiological signals [7–10], we have found that the aberration dynamics of the eye cannot be characterized by a single fractal dimension, but are multifractal. The most frequently found Hölder exponent for the rms wavefront error averaged across subjects was 0.31. This indicates that the aberration dynamics are antipersistant. This was also true when considering each individual aberration. Multifractal analysis provides a more in depth description of the aberration dynamics compared to power spectrum analysis in which a single descriptive number – the spectral index – is obtained. For JC and CS, the singularity spectra for the rms wavefront error are more skewed in comparison to the other subjects. Subjects KH and CV have broader spectra compared to the other subjects. We do not know the reason for these individual differences. It may result from differences in how the dynamics of other physiological signals, such as the heartbeat for example, impact the aberration fluctuations. This requires further work. The peak of the singularity spectrum for each subject was close to one, indicating that the aberration dynamics are singular everywhere. This is also evident from the ‘roughness’ throughout the time course of the signal.
Calculating the Hurst exponent from the spectral indices yielded a value of 0.18 and 0.16 for the full and low frequency regions respectively. The difference between these values and the average most frequently found Hölder exponent is likely to be because the Hurst exponent is a global measure. Hence as the singularity spectra are multifractal, there are a range of scaling exponents contributing to the signal and so the most frequently found Hölder exponent is not necessarily the same as the Hurst exponent obtained from the spectral index.
5.3 Aberration dynamics, the heartbeat and accommodation
Several studies have indicated varying degrees of correlation between ocular aberration dynamics and the heartbeat [13–15]. Here we found the appearance of the CWTs to be flame-like which is also evident in the heartbeat [10]. As we did not simultaneously record the heartbeat we are unable to determine if there were any similarities between the multifractal spectrum for the heartbeat fluctuations and aberration dynamics. This requires further work.
During steady-state viewing conditions it is well known that the eye exhibits fluctuations in accommodation. Using a combination of the defocus and spherical aberration coefficients [33], we calculated the singularity spectra for accommodation. We found that the spectra were multifractal with a most frequently found Hölder exponent of 0.25 ± 0.11. Certain spectral bands in the accommodation power spectrum have been found to be correlated with the heartbeat. However, the accommodation system is itself a closed-loop self regulating system. Hence there are aspects of its dynamics that are unlikely to be due to the effect of other physiological systems on the eye. As other aberrations show a correlation with accommodation [34,35], it is likely that regulation of the accommodation loop will impact upon fluctuations in these other aberrations also.
5.4 Potential limitations owing to measurement resolution and time length of the data
As it is not possible to measure the aberrations with infinite resolution it is possible that there are singularities present in the signal that were not captured by our 21 Hz sampling rate. Although infinite resolution is not possible, future work will include sampling the aberration dynamics at a much faster rate and comparing the spectra obtained from that same signal, numerically sampled at different rates.
Another possible limitation is the time length of the data. For a much longer time length one may find the distribution of singularities to be different. Future work will include measuring the aberration dynamics over a considerably longer time and calculating the multifractal spectrum for different segment lengths within that data set.
5.5 Future applications of multifractal analysis for ocular aberration
There is interest in developing models for ocular aberration dynamics, see for example [31]. Modeling the fluctuations will aid the optimal design of closed-loop adaptive optics systems [36]. Another application is in the study of the accommodation system. It has been found that for the heartbeat dynamics for example, the singularity spectrum becomes close to monofractal when a subject has heart disease [10]. Hence multifractal analysis has the potential to give an insight into subjects that may have problems with accommodation function such as progressing myopic subjects [37]. Progressing myopes show prominent low frequency fluctuations which may indicate the breakdown of the multifractal spectrum. None of our subjects were progressing myopes so we could not determine this.
6. Conclusion
We used a wavelet-based approach to determine the fractal properties of the ocular aberration dynamics of five subjects whilst viewing a fixed stimulus. We found that the aberration dynamics are multifractal and that the analytical procedure used provides a more in depth description of the characteristics of the fluctuations over conventional techniques such as power spectrum analysis. This approach has the potential to inform modeling of aberration dynamics and to identify subjects with accommodation dysfunction.
Acknowledgments
The authors would like to acknowledge financial support from the Engineering and Physical Sciences Research Council. This work was funded by grants EP/D036550/1 and EP/G015473/1. The authors would also like to thank Dr. Sem Sem Chin for collecting the data that was used in this study.
References and links
- 1.Hofer H., Artal P., Singer B., Aragón J. L., Williams D. R., “Dynamics of the eye’s wave aberration,” J. Opt. Soc. Am. A 18(3), 497–506 (2001). 10.1364/JOSAA.18.000497 [DOI] [PubMed] [Google Scholar]
- 2.Diaz-Santana L., Torti C., Munro I., Gasson P., Dainty C., “Benefit of higher closed-loop bandwidths in ocular adaptive optics,” Opt. Express 11(20), 2597–2605 (2003). 10.1364/OE.11.002597 [DOI] [PubMed] [Google Scholar]
- 3.Nirmaier T., Pudasaini G., Bille J., “Very fast wave-front measurements at the human eye with a custom CMOS-based Hartmann-Shack sensor,” Opt. Express 11(21), 2704–2716 (2003). 10.1364/OE.11.002704 [DOI] [PubMed] [Google Scholar]
- 4.Chin S. S., Hampson K. M., Mallen E. A. H., “Binocular correlation of ocular aberration dynamics,” Opt. Express 16(19), 14731–14745 (2008). 10.1364/OE.16.014731 [DOI] [PubMed] [Google Scholar]
- 5.Mira-Agudelo A., Lundström L., Artal P., “Temporal dynamics of ocular aberrations: monocular vs binocular vision,” Ophthalmic Physiol. Opt. 29(3), 256–263 (2009). 10.1111/j.1475-1313.2009.00655.x [DOI] [PubMed] [Google Scholar]
- 6.Eke A., Herman P., Kocsis L., Kozak L. R., “Fractal characterization of complexity in temporal physiological signals,” Physiol. Meas. 23(1), R1 (2002). 10.1088/0967-3334/23/1/201 [DOI] [PubMed] [Google Scholar]
- 7.Ivanov P. C., Amaral L. A., Goldberger A. L., Havlin S., Rosenblum M. G., Struzik Z. R., Stanley H. E., “Multifractality in human heartbeat dynamics,” Nature 399(6735), 461–465 (1999). 10.1038/20924 [DOI] [PubMed] [Google Scholar]
- 8.Ivanov P. C., Nunes Amaral L. A., Goldberger A. L., Havlin S., Rosenblum M. G., Stanley H. E., Struzik Z. R., “From 1/f noise to multifractal cascades in heartbeat dynamics,” Chaos 11(3), 641–652 (2001). 10.1063/1.1395631 [DOI] [PubMed] [Google Scholar]
- 9.Lin D. C., Sharif A., “Common multifractality in the heart rate variability and brain activity of healthy humans,” Chaos 20(2), 023121 (2010). 10.1063/1.3427639 [DOI] [PubMed] [Google Scholar]
- 10.Goldberger A. L., Amaral L. A. N., Hausdorff J. M., Ivanov P. Ch., Peng C.-K., Stanley H. E., “Fractal dynamics in physiology: alterations with disease and aging,” Proc. Natl. Acad. Sci. U.S.A. 99(90001 Suppl 1), 2466–2472 (2002). 10.1073/pnas.012579499 [DOI] [PMC free article] [PubMed] [Google Scholar]
- 11.C. D. Cutler, “A review of the theory and estimation of fractal dimension,” in Dimension Estimation and Models, H. Tong, ed. (World Scientific Publishing Co Pte Ltd, 1993). [Google Scholar]
- 12.P. S. Addison, The Illustrated Wavelet Transform Handbook (Taylor and Francis, 2002). [Google Scholar]
- 13.Zhu M., Collins M. J., Robert Iskander D., “Microfluctuations of wavefront aberrations of the eye,” Ophthalmic Physiol. Opt. 24(6), 562–571 (2004). 10.1111/j.1475-1313.2004.00237.x [DOI] [PubMed] [Google Scholar]
- 14.Hampson K. M., Munro I., Paterson C., Dainty C., “Weak correlation between the aberration dynamics of the human eye and the cardiopulmonary system,” J. Opt. Soc. Am. A 22(7), 1241–1250 (2005). 10.1364/JOSAA.22.001241 [DOI] [PubMed] [Google Scholar]
- 15.Muma M., Iskander D. R., Collins M. J., “The role of cardiopulmonary signals in the dynamics of the eye’s wavefront aberrations,” IEEE Trans. Biomed. Eng. 57(2), 373–383 (2010). 10.1109/TBME.2009.2032531 [DOI] [PubMed] [Google Scholar]
- 16.Hampson K. M., Chin S. S., Mallen E. A. H., “Binocular Shack-Hartmann sensor for the human eye,” J. Mod. Opt. 55(4), 703–716 (2008). 10.1080/09500340701469674 [DOI] [Google Scholar]
- 17.Hampson K. M., Chin S. S., Mallen E. A. H., “Dual wavefront sensing channel monocular adaptive optics system for accommodation studies,” Opt. Express 17(20), 18229–18240 (2009). 10.1364/OE.17.018229 [DOI] [PubMed] [Google Scholar]
- 18.Thibos L. N., Applegate R. A., Schwiegerling J. T., Webb R., “Standards for reporting the optical aberrations of eyes,” Refract. Surg. 18, 652–660 (2002). [DOI] [PubMed] [Google Scholar]
- 19.Arneodo A., Bacry E., Muzy J., “The thermodynamics of fractals revisited with wavelets,” Physica A 213(1-2), 232–275 (1995). 10.1016/0378-4371(94)00163-N [DOI] [Google Scholar]
- 20.Shang P., Lu Y., Kama S., “The application of Hölder exponent to traffic congestion warning,” Physica A 370(2), 769–776 (2006). 10.1016/j.physa.2006.02.032 [DOI] [Google Scholar]
- 21.Enescu B., Ito K., Struzik Z. R., “Wavelet-based multiscale resolution analysis of real and simulated time-series earthquakes,” Geophys. J. Int. 164(1), 63–74 (2006). 10.1111/j.1365-246X.2005.02810.x [DOI] [Google Scholar]
- 22.J. C. Van den Berg, Wavelets in Physics (Cambridge University Press, 2004). [Google Scholar]
- 23.McAteer R. T. J., Young C. A., Ireland J., Gallagher P. T., “The bursty nature of solar flare x-ray emission,” Astron. J. 662, 691–700 (2007). [Google Scholar]
- 24.Özger M., “Investigating the properties of significant wave height time series using a wavelet based approach,” J. Waterw. Port Coast. Ocean Eng. 137(1), 34–42 (2011). 10.1061/(ASCE)WW.1943-5460.0000062 [DOI] [Google Scholar]
- 25.Piñuela J. A., Andina D., McInnes K. J., Tarquis A. M., “Wavelet analysis in a structured clay soil using 2-D images,” Nonlin. Processes 18, 21386–21396 (2007). [Google Scholar]
- 26.Telfer B., Szu H. H., “New wavelet transform normalization to remove frequency bias,” Opt. Eng. 31(9), 1830–1834 (1992). 10.1117/12.59912 [DOI] [Google Scholar]
- 27.Torrence C., Compo G. P., “A practical guide to wavelet analysis,” Bull. Am. Met. Soc. 79(1), 61–78 (1998). [DOI] [Google Scholar]
- 28.Mallat S., Hwang W. L., “Singularity detection and processing using wavelets,” IEEE Trans. Inf. Theory 18, 2668–2681 (2010). [Google Scholar]
- 29.S. Mallat, A Wavelet Tour of Signal Processing: the Sparse Way (Academic Press, 2009). [Google Scholar]
- 30.Iskander D. R., Collins M. J., Morelande M. R., Zhu M., “Analyzing the dynamic wavefront aberrations in the human eye,” IEEE Trans. Biomed. Eng. 51(11), 1969–1980 (2004). 10.1109/TBME.2004.834254 [DOI] [PubMed] [Google Scholar]
- 31.Leahy C., Dainty C., “A non-stationary model for simulating the dynamics of ocular aberrations,” Opt. Express 18(20), 21386–21396 (2010). 10.1364/OE.18.021386 [DOI] [PubMed] [Google Scholar]
- 32.Leahy C., Leroux C., Dainty C., Diaz-Santana L., “Temporal dynamics and statistical characteristics of the microfluctuations of accommodation: dependence on the mean accommodative effort,” Opt. Express 18(3), 2668–2681 (2010). 10.1364/OE.18.002668 [DOI] [PubMed] [Google Scholar]
- 33.Thibos L. N., Hong X., Bradley A., Applegate R. A., “Accuracy and precision of objective refraction from wavefront aberrations,” J. Vis. 4(4), 9 (2004). 10.1167/4.4.9 [DOI] [PubMed] [Google Scholar]
- 34.Hampson K. M., Mallen E. A. H., Dainty C., “Coherence function analysis of the higher-order aberrations of the human eye,” Opt. Lett. 31(2), 184–186 (2006). 10.1364/OL.31.000184 [DOI] [PubMed] [Google Scholar]
- 35.Diaz-Santana L., Guériaux V., Arden G., Gruppetta S., “New methodology to measure the dynamics of ocular wave front aberrations during small amplitude changes of accommodation,” Opt. Express 15(9), 5649–5663 (2007). 10.1364/OE.15.005649 [DOI] [PubMed] [Google Scholar]
- 36.Hampson K. M., “Adaptive optics and vision,” J. Mod. Opt. 55(21), 3425–3467 (2008). 10.1080/09500340802541777 [DOI] [Google Scholar]
- 37.Seidel D., Gray L. S., Heron G., “Retinotopic accommodation responses in myopia,” Invest. Ophthalmol. Vis. Sci. 44(3), 1035–1041 (2003). 10.1167/iovs.02-0264 [DOI] [PubMed] [Google Scholar]


