Abstract
In this paper, we present methods for 3D visualization and quantitative measurements of retinal blood flow in rats by the use of optical microangiography imaging technique (OMAG). We use ultrahigh sensitive OMAG to provide high-quality 3D RBF perfusion maps in the rat eye, from which the Doppler angle, as well as the diameters of blood vessels, are evaluated. Estimation of flow velocity (i.e. axial flow velocity) is achieved by the use of Doppler OMAG, which has its origins in phase-resolved Doppler optical coherence tomography. The measurements of the Doppler angle, vessel size, and the axial velocity lead to the quantitative assessment of the absolute flow velocity and the blood flow rate in selected retinal vessels. We demonstrate the feasibility of OMAG to provide 3D microangiograms and quantitative assessment of retinal blood flow in a rat model subjected to raised intra-ocular pressure (IOP). We show that OMAG is capable of monitoring the longitudinal response of absolute blood velocity and flow rate of retinal blood vessels to increased IOP in the rat, demonstrating its usefulness for ophthalmological research.
OCIS codes: (170.4500) Optical coherence tomography, (170.3880) Medical and biological imaging
1. Introduction
Retinal blood flow (RBF) plays an important role in the normal function of vision. Since many ocular diseases, such as age-related macular degeneration, diabetic retinopathy, and possibly glaucoma, are related to abnormal RBF [1], visualization and quantitative measurements of RBF are useful for diagnosis, treatment and understanding of these potentially blinding conditions.
Currently, there are a number of methods used for studying RBF. Dye dilution [2] involves the use of tracing fluorescent dyes flowing in the retinal vessels to determine the flow velocity. However, the dye injection is not comfortable for patients, and this, in itself, may produce unpredictable side effects. Laser Doppler velocimetry (LDV) [3] is a commonly used technique for flow velocity measurement in the retina; however, it does not provide sufficient spatial resolution, and in addition it is not capable of providing a 3D map of the vasculature. Laser speckle flowgraphy, which is based on the laser speckle phenomenon, has been used in monkeys to evaluate the relationship between systemic blood pressure and optic nerve head blood flow [4]. Recently, photoacoustic ophthalmoscopy was proposed by Jiao et al [5] to image retinal blood vessels in the rat. However, this method has difficulty providing quantitative information on blood flow velocity because the technique uses the absorption of blood cells, instead of their flow information, to achieve imaging of the vasculature. Therefore, there is still a need for noninvasive techniques that can be used to obtain both volumetric visualization of the vasculature and absolute measurements of RBF with high resolution.
Optical coherence tomography (OCT) is a rapidly emerging noninvasive imaging modality that can provide high resolution, depth-resolved cross-sectional and volumetric images of internal microstructures within the scanned tissue volume. Due to easy optical access to the anterior and posterior segments of the eye, it is not surprising that retinal imaging has become one of the most successful medical applications of OCT. When combined with the Doppler effect of a flowing particle on light frequency, OCT has been naturally extended to include imaging of blood flow in tissue. The most frequently used OCT technique to measure blood flow is the phase resolved Doppler OCT (PRDOCT) [6,7]. The development of spectral domain optical coherence tomography (SDOCT) has enabled PRDOCT to image the blood flow in real time and in vivo [8–13]. However, using PRDOCT to map retinal blood flow has been largely limited to qualitative studies on the large blood vessels; quantitative studies of the blood flow and its response to insults (or diseases) have generally not been explored at the same pace as the development of OCT for microstructural imaging. However, Wang et al have applied SDOCT to measure total human retinal blood flow [13–15]. In this work, they initially used a dual-plane scanning pattern to determine the Doppler angle between the blood flow and scanning beam to measure the total flow velocity [13]. They later improved the measurement by using a circumpapillary scanning method [14] and then used this technique to document differences in retinal blood flow between diabetic and normal patients [15].
As a variation of SDOCT, optical microangiography (OMAG) is a new imaging modality capable of generating 3D images of dynamic blood perfusion distribution within microcirculatory tissue beds. OMAG was initially used for 3D imaging of the cerebral blood flow through the intact skin and skull of mice [16], as well as the microvasculature of the retina and choroid in humans [17]. Subsequently, OMAG was combined with phase-resolved OCT to produce a method called Doppler OMAG (D-OMAG), which has extended OMAG’s capability to quantitatively measure blood flow velocity (axial component) [18]. Compared to PRDOCT, D-OMAG has been shown to have a higher signal to noise ratio for phase analysis and higher performance for velocity estimation [18]. Most recently, ultra-high resolution OMAG (UHS-OMAG) has been further developed that dramatically improves the detection sensitivity of blood flow to a level that enables us to image true capillary vessels within the scanned tissue volume. UHS-OMAG has been successfully applied to image microvasculature at the capillary level within human skin [19] and retina and choroid [20], and is now being extended to small animal studies, including imaging of the microvasculature within the meninges and brain cortex [21] and sentinel lymph node [22] in mice.
Research on ocular diseases is often limited by ethical constraints on studying pathophysiologic processes in the human eye. Because of this, rat and mouse models of ocular diseases are becoming increasingly popular alternatives for systematic analysis and characterization of disease pathogenesis and response to treatment [23,24]. Currently, most published studies using OCT to image the retina in rodents have concentrated on imaging retinal micro-structures [25,26]. In this paper, we report, for the first time, the combined use of D-OMAG and UHS-OMAG to provide simultaneous 3D volumetric angiography and quantitative measurement of RBF in the rat.
We will first describe the methods used for the 3D volumetric angiography and the measurements of absolute blood flow velocity and flow rate of RBF. Then, we apply these methods to monitor the responses of retinal blood flow to increased intra-ocular pressure (IOP) in rats and show that OMAG is a promising tool to provide both visualization and quantitative evaluation of the dynamic changes of the rodent RBF.
2. Experimental methods
2.1. Imaging System description
The OMAG system setup used to image the retinal microvasculature and provide the quantitative retinal blood flow in rats is shown in Fig. 1 , which is based on a spectral domain OCT. A broadband infrared superluminescent diode (SLD, Denselight Ltd, Singapore) with a 1310 nm central wavelength and a full width at half maximum (FWHM) bandwidth of 60 nm was used as the illuminating light source. The ex-fiber output power was rated at ~8 mW. The light from the SLD was split into two paths with a 10:90 fiber based Michelson interferometer. The ninety percent power path goes to the sample arm while the ten percent power path goes to the reference mirror. The sample arm was scanned by a galvo-mirror in both x and y directions. The objective lens had a 50 mm focal length and the ocular lens had a 30 mm focal length. The probe beam size was adjusted to enable the entire beam to pass through the rat pupil and reach the retinal and optic nerve surface of the eye. The lights reflected back from both reference and sample arms meet and interfere with each other at the fiber-coupler, and the resulting interferogram emerging at the output of interferometer was sent, via the optical circulator, to a custom-built high-speed spectrometer. The spectrometer consisted of a transmission grating (1175 lines/mm), a camera lens with a focal length of 100 mm, and 1024 element line scan infrared InGaAs detector (Goodrich Ltd, USA). The total depth range was measured to be ~2.8 mm in air (2.1 mm in biological tissue by assuming that the refractive index of the sample is ~1.35). The axial resolution of the system was ~13 μm in air (~9 μm in tissue), sufficient to resolve the different morphological layers in the rat retina. With a 3 mm beam size illuminated on the objective lens, the lateral resolution was estimated to be 16 μm at the posterior segment of the eye. The maximal imaging speed of the system was 47,000 A scans per second, with which the measured signal to noise ratio (SNR) was ~100 dB at the focus spot of the sampling beam, which was ~500 μm below the zero delay line.
Fig. 1.
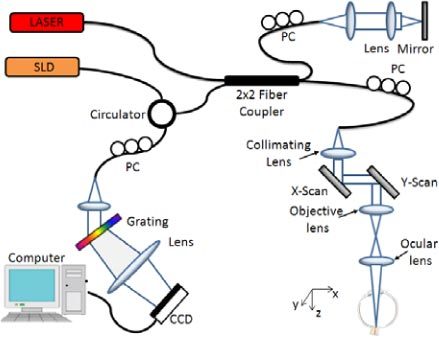
Schematic of the OMAG system used for collecting the spectral interferogram data sets to perform 3D angiogram and quantitative blood flow measurement of the rat retina in vivo. CCD: the charge coupled device, PC: polarization controller. Raster-scanning both the X and Y-scanner, we can collect a 3D volume data set. By keeping one of the scanners static, repeated B-scan (i.e., M-B scan) could be achieved.
The 3D scan was achieved by enabling the x-y scanner to provide volumetric morphological and vasculature images through UHS-OMAG, while repeated B-scan (i.e., M-B scan) was achieved by enabling x-scanner only to provide the quantitative blood flow measures on the selected blood vessels on the retina through D-OMAG.
2.2. 3D volumetric perfusion imaging using UHS-OMAG
In our previous work, UHS-OMAG was successfully applied to obtain 3D volumetric perfusion images of the scanned tissue volume, including human skin tissue [19], and human retina and choroid [20], and this allowed detailed, capillary level resolution visualization of the perfused microvasculature. Here, in order to image not only fast flow vessels but also slow flow capillaries within the rat retina, we adopted this UHS-OMAG scanning protocol and its data processing algorithm to achieve high quality 3D volumetric perfusion imaging. In addition, the high quality 3D image of the vasculature provides us the ability to determine the Doppler angle that is required to provide the quantitative measures of the blood flow in individual vessels. Here, UHS-OMAG was used to acquire low density B-scan frames (i.e. x-direction scan) with 256 A-lines at a spacing of ~6 μm (which is of the order of the least sampling distance of 8 μm for the system’s lateral resolution of 16 μm) between adjacent A-lines. This covered a total x-scan range of ~1.5 mm on the retina. Notably, the line scan camera employed in the spectrometer runs at an A-line scan rate of 47 KHz, providing an imaging speed of 150 frames per second (fps) with 256 A-lines in each frame. The whole 3D data volume containing 200 cross-sections with a spacing of ~6 μm covered a y-scan range of 1.2 mm. To facilitate the UHS-OMAG data processing, two frames were acquired at each cross-section; 400 frames in total were acquired in one whole 3D data volume, which took ~2.5 seconds.
In the data processing, the essential principle of UHS-OMAG is the same as the traditional OMAG [27], except that UHS-OMAG applied high pass filtering along the C-scan direction, rather than the B-scan direction. As mentioned in [18], regardless of DC component and sample arm self cross-correlation, the interferogram of one B-scan captured by the CCD camera can be expressed by the following equation:
| (1) |
where j = 1, 2, … 1024 is the pixel number index of the CCD camera, and kj is the wavenumber captured by the jth pixel; t is the time point when an A-line was captured. ER is the light reflected from the reference arm; S(k) is the spectral density of the SLD light source used; a(z, t) is the amplitude of the back scattered light at depth z; n is the average refractive index of tissue, assumed to be constant; v is the velocity of moving blood cells in a blood vessel, which is located at depth z1 moving towards depth z. For the conventional OMAG method, the high pass filtering was applied along the fast scanning B-scan direction, to isolate the scattering signal from moving blood cells from the static tissue. Here, we switched this process to the slow scanning direction i.e. C-scan direction. According to previous analysis [28,29], the sensitivity to the flow velocity is determined by the time spacing between adjacent interferogram used for velocity calculation. Since our OMAG algorithm shifts from B-scan direction to C-scan direction, the time spacing between adjacent interferogram would change from ΔtA (between adjacent A scans) to ΔtB (between adjacent B scans). In this case, the time spacing is increased by 256 fold, leading to a dramatic improvement in the sensitivity to the slow blood flows.
Since we acquired two B-scans in each cross-section along the C-scan direction, a differential operation was applied to the subsequent B-scan at each cross-section. This can be described by the following equation:
| (2) |
where Ii(t,k) denotes the flow signal at ith cross-section (totally 200 cross-sections) along the C-scan direction, ΔtB is the time interval between adjacent B-scans. As the differential operation is equivalent to the high pass filtering, it suppresses the optical scattering signals from the static elements. Then, by applying fast Fourier transforms (FFT) upon every wavenumber k of Ii(t,k), we can obtain the depth resolved OMAG flow image for each cross-section with ultra-high sensitivity to the blood flow. With all the cross-sectional images, 3D volumetric perfusion map, i.e., 3D microangiogram was rendered using Amira 3D visualization software (Visage Imaging, Inc.).
2.3. Axial velocity measurement with Doppler OMAG
While UHS-OMAG can provide microangiograms for visualizing perfusion at capillary level resolution, the measurement of the blood flow velocity would be difficult because the time interval used between adjacent frames is in a range of milliseconds, which makes it unreliable for measuring fast flows. PRDOCT has been widely studied for the measurement of blood flow velocity. By combining OMAG with PRDOCT, D-OMAG [18] was developed to measure the axial blood flow velocity for relatively fast flows. Since the OMAG algorithm enables us to separate the scattering signals by moving elements from those caused by the static elements, D-OMAG can apply the phase analysis algorithm purely on the scattering signals from the moving blood cells. The resulting phase map is free of texture pattern noise and the performance of blood flow velocity measurement can be dramatically improved [21].
The axial flow velocity can be derived from phase differences between adjacent A-scans introduced by the motion of blood cells. The relationship between them is:
| (3) |
where Δφ is the phase difference between adjacent A-scans; λ0 is the central wavelength of the light source; n is the refractive index of tissue (~1.35); ΔtA is the time interval between adjacent A-scans as mentioned above. Phase wrapping happens if |Δφ|≥π, hence, the maximal axial velocity component which can be unambiguously measured with a given time interval ΔtA would be:
| (4) |
The reason why we choose to calculate the phase difference between adjacent A-scans rather than adjacent B-scans is because in this study we wished to focus on the quantitative analysis of retinal arteries and veins rather than capillary vessels. In order to avoid phase wrapping in the big arteries and veins, shorter time spacing is required. The A-scan rate we used to do D-OMAG was 47 KHz, then ΔtA = ~20µs, which gives an axial velocity range of [-11.75 11.75] mm/s. This range is sufficient to measure the axial velocity component of retinal arteries and veins in the rat.
2.4. Absolute flow velocity and blood flow rate calculation
Measurements of absolute flow velocity and retinal blood flow rate are an important endpoint in studies in ophthalmology, since they allow the evaluation of blood flow dynamics in vessels. Towards the aim of monitoring the dynamic changes of RBF under certain disease conditions, we will next describe the methods used to calculate these two parameters.
Firstly, in order to calculate the absolute flow velocity, besides the axial velocity that we can obtain using D-OMAG as discussed above, the Doppler angle also needs to be known. Doppler angle ɸ is defined as the angle between the flow-velocity vector and the wave vector of incident light, as shown in Fig. 2 (A) . Many descriptions have been published about how to calculate Doppler angle [30–32]. However, many require complex data acquisition and processing procedures, and the accuracy of the calculated Doppler angle is far from ideal. In our method, we calculated the vessel Doppler angle using the three dimensional data set captured using UHS-OMAG, where the orientation of each vessel is provided in the whole 3D volume. Figure 2 (B) is a schematic of this method. Assuming that the orientation of the artery or vein in the retina doesn’t change within a small range, which we found to be true (within 100 µm in this work), the Doppler angle can be calculated according to the following equation:
Fig. 2.
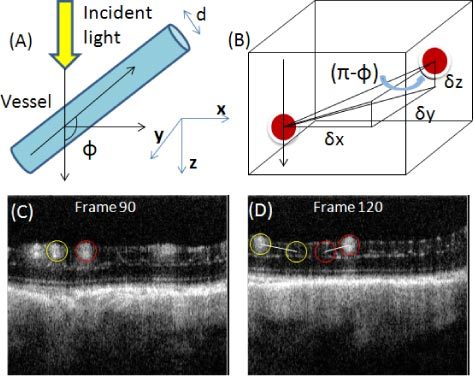
Calculation of vessel Doppler angle from the 3D data volume. (A) Illustration of the defined vessel Doppler angle. (B) Schematic representation of the vessel Doppler angle calculation. (C) and (D) show two cross-sections of UHS-OMAG blood flow image along the C-scan direction. The three components used for Doppler angle calculation could be obtained for the two vessels circled with two different colors.
| (5) |
where δx, δy, δz are the three components indicating the distance that the vessel meander in the three coordinates of the 3D volume. They can be obtained from the 3D data volume captured using UHS-OMAG. Figure 2 (C) and (D) show two cross-sections of a UHS-OMAG blood flow image along the C-scan direction from one 3D scan where the Doppler angle of the two circled vessels could be calculated. We calculated δx, δz by defining how many pixels the vessel traveled in both x and z direction and multiplying them with the pixel size, while δy could be calculated by multiplying the frame number difference with the spacing between adjacent frames in C-scan direction.
After the Doppler angle is obtained, the calculation of the absolute flow velocity is straightforward:
| (6) |
Here, the absolute velocity V does not take into account the flow direction, since this can be determined from the Doppler angle.
Secondly, in order to calculate the blood flow rate, the vessel diameter D needs to be known apart from the absolute velocity. For each vessel, its diameter was determined from the UHS-OMAG image in the region between the upper and lower boundary of the vessel [13]. In our image the length ratio in the axial dimension is 3.7 µm/pixel, which provides a measurement accuracy of 3.7µm for the vessel diameter. With the diameter, we were able to calculate the vessel cross-sectional area size, S = π(D/2)2. The blood flow rate was then calculated by multiplying the absolute average velocity by the cross-sectional area S of the blood vessel.
| (7) |
2.5. In vivo monitoring of RBF response to elevated IOP in the rat
To test the performance of our method for visualization and quantitative analysis of rat RBF, we applied our technique to monitor the morphological (3D visualization) as well as the functional responses (the changes of blood flow rate) of retinal blood vessels to experimentally elevated intra-ocular pressures (IOP).
8 month-old Brown Norway rats were anesthetized with inhalational isoflurane (1.5%) and positioned for OMAG imaging using a custom-made head-holder. The anterior chamber of one eye was cannulated with a 33 gauge needle connected to a reservoir filled with Balanced Salt Solution and to a pressure transducer connected to a chart recorder. The reservoir was then suspended above the animal at heights corresponding to 10 mmHg up to 80 mmHg, in 10 mmHg increments, followed by a pressure of 100 mmHg to produce complete obstruction of ocular blood flow. Finally, the pressure was returned back to 10 mmHg to examine the retinal reperfusion. Following a 10 minute equilibration at each level, two data sets were captured: 3D data volume was first captured using the UHS-OMAG scanning method followed by repeated B-scans for Doppler OMAG analysis. This switch between UHS-OMAG and D-OMAG imaging protocols was automatically controlled by the controlling software written in Labview. For the Doppler OMAG imaging, there were 3000 A-lines sampled in each B-scan with the A-scan rate of 47 KHz. The B-scan rate was 10 fps; the acquisition was repeated 200 times at the same cross-section, meaning we continuously captured the blood flow for 20 seconds. The experimental protocol was in compliance with the Federal guidelines for care and handling of small rodents and approved by the Institutional Animal Care and Use Committee (IACUC) of Oregon Health and Science University (OHSU).
3. Results and Discussion
3.1. 3D volumetric perfusion imaging of RBF in rat
One typical in vivo 3D microvasculature perfusion image of posterior wall of a rat eye, including the optic disk, using UHS-OMAG is shown in Fig. 3 . Figure 3 (A) presents a typical OCT cross-sectional structural image, where the important histological layers can be identified. These include the nerve fiber layer (NFL), inner plexiform layer (IPL), inner nuclear layer (INL), outer plexiform layer (OPL), outer nuclear layer (ONL), junction between the inner and outer segment of the photoreceptors (IS/OS), retinal pigment epithelium layer (RPE), choroid (CH) and sclera (SC). Figure 3 (B) is the corresponding blood flow image showing big vessels (retinal artery and vein) represented by large open arrows and capillary vessels as pointed by the small arrows. Figure 3 (C) is the rendered 3D vasculature map of retinal blood vessels and Fig. 3 (D) is the corresponding maximal projection view which shows a detailed vessel network, an appearance typical in the rat eye as described in a standard textbook.
Fig. 3.
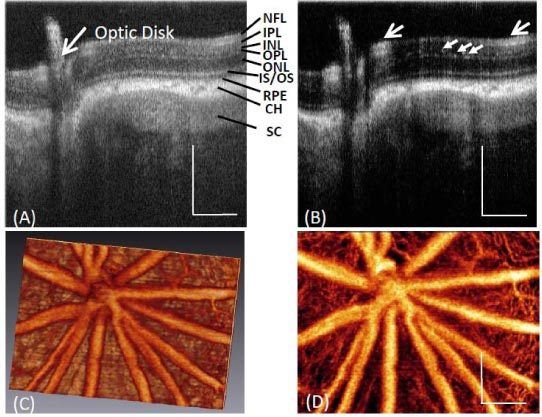
Typical in vivo 3-D vasculature perfusion image of the rat retina using UHS-OMAG. (A) One typical cross-sectional structural image of a rat eye around optic disk, where the different layers of posterior segment of the rat eye are demarcated; and the corresponding (B) UHS-OMAG flow image. (C) 3D vasculature perfusion image and (D) the maximal projection map of vasculatures in the rat retina. White bar = 250 µm.
3.2. Absolute blood flow velocity and flow rate measurement within the rat retina
Figure 4 shows representative results for absolute velocity measurement of retinal blood vessels. Figure 4 (A) is the microangiogram of microvasculature of normal rat retina in vivo, where the middle line marked in the image indicates the position where the D-OMAG data were captured for absolute velocity calculation. By applying the D-OMAG algorithm on data captured at the cross section, we obtained the phase difference map as shown in the upper row of Fig. 4 (B), while the picture in the lower row is the phase map for the 200 repeated B-scans rendered in 3D, where red and green indicates the two different flow directions and a deeper color represents larger phase difference, meaning faster flow. Three vessels were identified for absolute velocity calculation, among which vessels 1 and 3 are arteries and vessel 2 is a vein. This can be confirmed as the absolute blood flow velocity of vessel 1 and 3 is higher than vessel 2 as shown in Table 1 . Figure 4(D) plots the axial velocity profile of vessel 2 along the depth direction indicated by the vertical line across the center of the vessel in Fig. 2(B), along with the parabolic polynomial curve fitted to the measured profile. The axial velocity of each vessel at each time point was calculated by averaging over the whole cross section of the vessel, i.e. the average flow velocity. The measured axial velocities in the three vessels over the time duration of 20 seconds (200 time points with a frame rate of 10 fps) are plotted in Fig. 4. (E).
Fig. 4.
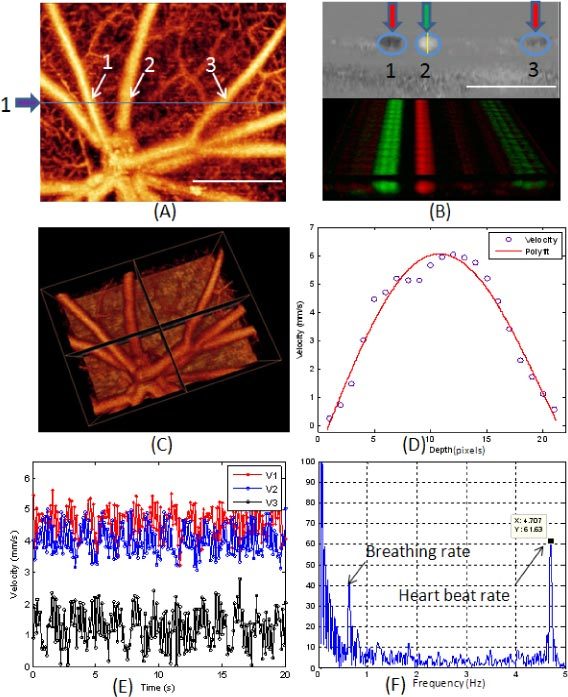
Measurement of absolute velocity within retinal blood vessels in the rat. (A) Microvasculature angiogram of a normal rat retina in vivo where the blue line and arrow indicate where the D-OMAG data were captured. (B) D-OMAG phase difference map in one cross section (upper row) and the 3D rendered phase difference extended in 20 seconds at the same cross section. C) 3D vasculature image showing the vessel orientation that was used for calculating the Doppler angle and vessel diameter for the vessels analyzed. (D) The axial velocity profile of vessel 2 along depth direction. (E) The axial velocities in the three vessels over 20 sec periods and (F) the FFT of the values for V2 in (E). White bar = 500 µm.
Table 1. Quantitative Results of the Blood Flow for the Retinal Artery and Vein.
| Vessel # | Axial Velocity (mm/s) | Doppler Angle | Vessel Diameter (μm) | Absolute Velocity (mm/s) | Flow Rate (μl/min) |
|---|---|---|---|---|---|
| #1 | 4.6 | 79° | 55.5 | 24.0 | 1.74 |
| #2 | 4 | 120° | 70.3 | 11.7 | 1.36 |
| #3 | 1.44 | 86° | 51.8 | 20.49 | 1.30 |
For each vessel, there is variation in the velocity due to flow pulsatility [33] which is caused by the heartbeat and breathing of the animal. Figure 4 (F) is the plot of the Fourier transformation of the values of V2 in Fig. 4. (E). We can see that there is a peak at 4.7 Hz which is identified to be the heart beat rate (for a rat the heart beat rate is around 280 beats per minute). Also there is another peak at 0.56 Hz which we interpret to be due to breathing. The mean value of the velocities over 20 seconds was calculated as the final axial velocity for each vessel. This increases the accuracy of quantitative blood flow measurement by minimizing the errors caused by the flow variation due to the heartbeat and breathing of the animal.
Figure 4 (C) is the 3D vasculature image showing the vessel orientation where the Doppler angles of the three vessels at the cross section were calculated. The quantitative results for the central axial velocities, Doppler angle, vessel diameter, central absolute velocities and the blood flow rate in the three vessels labeled as 1(artery), 2 (vein) and 3(artery) in Fig. 2(B) are shown in Table 1.
3.3. In vivo RBF response to the raised IOPs in the rat
Elevated IOP is often associated with the development of glaucoma, which leads to progressive, irreversible loss of vision due to consequent optic nerve damage [2,34,35]. However, in many glaucoma patients, the relationship between IOP and vision loss is complex. This has led to speculation that altered ocular blood flow, and in particular defective optic nerve head and retinal autoregulation in the face of changing IOP, may be a contributing factor in this disease [36,37]. For this reason, we wished to determine if our volumetric imaging and quantitative measurement method was capable of detecting dynamic RBF responses to elevated IOP. As mentioned in the experimental methods, the IOP was increased from 10 mmHg up to 80 mmHg in 10 mmHg increments, followed by a pressure of 100 mmHg to produce complete obstruction of ocular blood flow. After that, IOP was reduced back to 10 mmHg to examine reperfusion.
Figure 5 is a representative sequence of the microangiograms obtained by UHS-OMAG, showing the response of the microvasculature within the rat retina surrounding the optic disk to the gradual increase in IOP. Little change was observed for the vessel appearance when the IOP was increased from 10 mmHg to 50 mmHg. After 60 mmHg, the density of the capillary and the diameters of big vessels started to decrease, a process that was particularly obvious above 80 mmHg. At 100 mmHg, almost all the retinal blood vessels were obstructed. When the IOP returned back to 10 mmHg, strong reperfusion was detected, and the appearance of the microvasculature was almost identical to that at the initial state. Furthermore, there was an observable change in blood perfusion at the optic disk starting from 70 mmHg. This is evident from the horizontal strip lines over vessels at the optic disk, beginning at 70 mmHg and clearly seen at 100 mmHg, which are due to increased pulsatility of the central retinal artery under the higher pressures.
Fig. 5.
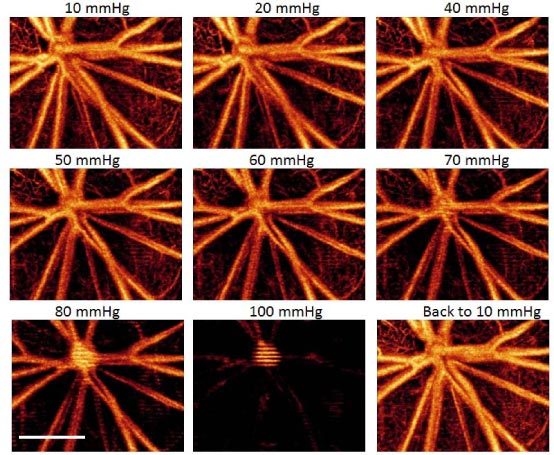
Representative UHS-OMAG micro-angiogram maps of the rat RBF showing the changes of retinal microvascular network around the optic disk due to the increase of IOPs (10 mmHg to 100mmHg), and its reperfusion after the IOP returned back to 10 mmHg. The IOP in mmHg is given in the upper middle of each image, and white bar = 500 µm.
In order to better show the dynamic changes of RBF under different IOP levels, quantitative analysis of both absolute blood flow velocity and blood flow rate were done on the selected individual vessels. Figure 6 presents the quantitative results of the three representative retinal vessels. Figure 6(A) shows the UHS-OMAG angiogram from Fig. 5 (10 mmHg) used for locating the vessels, where the blue line indicates the cross section from which D-OMAG data were collected. Figure 6(B) is the cross-sectional Doppler phase image obtained using D-OMAG algorithm from which we can see that the flow direction of vessel 1 (artery) differs from vessels 2 and 3 (veins). Figure 6(C) plots the dynamic changing trend of the absolute blood flow velocities in the three vessels with the gradual increase of IOPs in the rat. The results show that below 50 mmHg, the increased IOP did not have significant effect on the retinal blood flow velocity. However, when the IOP was increased to beyond 60 mmHg, there is obvious reduction (more than 50 percent) in blood flow velocity.
Fig. 6.
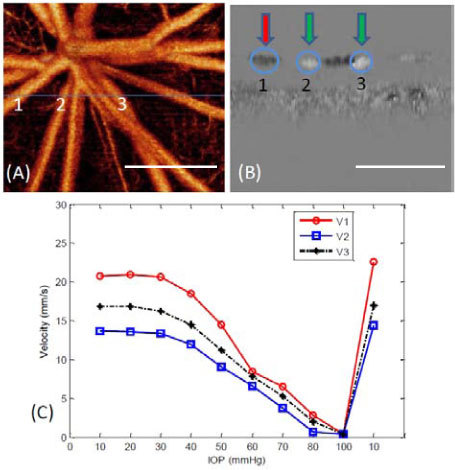
(A) shows the microangiogram from Fig. 5 used for locating the vessels for quantitative analysis. The position marked as the blue line indicates the cross-section where the Doppler OMAG data were captured. (B) Cross-sectional Doppler phase image obtained using D-OMAG algorithm. (C) Plot of the absolute blood flow velocity at the center of the three vessels 1, 2 and 3 shown in (A) and (B) labeled as V1, V2, V3 versus different IOPs. Vessel 1 is an artery while vessel 2 and 3 are veins. White bar = 500 µm.
At 100 mm Hg, velocity was nearly 0 for all 3 vessels. After the IOP returned back to 10 mmHg, reperfusion was observed and the blood flow velocity rebounded to slightly higher than the initial 10 mmHg value.
By multiplying the absolute velocity by the vessel cross section area size, the blood flow rates for the three vessels at different IOP levels were obtained and plotted in Fig. 7 . The trend of blood flow rate change due to increased IOPs was similar to that of absolute blood flow velocity although small differences exist. As in velocity, there was little change in blood flow up to 40 mmHg. This is consistent with prior observations, in other species using measurement methods different from ours, of retina and optic nerve head vascular autoregulation in the face of elevated IOP and further supports the validity of these results [4,38]. It is interesting to note that, above 40 mmHg, the decreasing trend for blood flow rate appears steeper than that for absolute velocity. This is most likely because the vessels were squeezed under higher IOPs, causing a decrease in vessel diameter and cross-sectional area. For the artery V1, the blood flow rate decreased from 1.94µl/min to 1.20µl/min (the decreasing ratio was 38%) as the IOP increased from 10 mmHg to 50 mmHg, and for the two veins the decreasing ratio was 45% (from 0.53 µl/min to 0.29 µl/min for V2) and 49% (from 1.39 µl/min to 0.71µl/min for V3). However, when the IOP reached 60 mmHg, the flow rate decreased by 68% for V1 and 68% and 69% for V2, V3, respectively compared to 10 mmHg. Above 60 mmHg, all the decreasing ratios were greater than 60% and at 100 mmHg, almost all the retinal blood flow was obstructed, which coincides with what we visualized from 3D perfusion map (Fig. 5). The abrupt increase in blood flow after the IOP was restored to 10 mmHg is due to strong reperfusion.
Fig. 7.
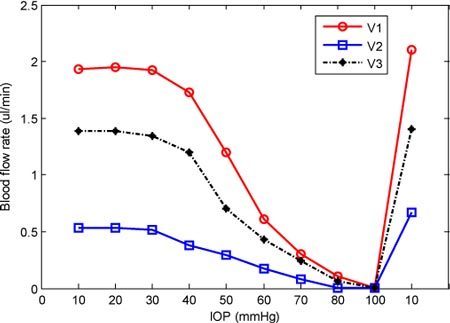
Plot of the blood flow rates in the three vessels 1, 2 and 3 in Figs. 6 (A) and 6 (B) labeled as V1, V2, and V3 under different IOPs.
4. Conclusions
In summary, we have presented a method for in vivo absolute measurement of retinal blood flow and flow-based capillary angiography using OMAG. We have shown that OMAG is capable of measuring the absolute blood flow velocity and blood flow rate in selected vessels in the rat retina and that 3D volumetric perfusion maps and quantitative RBF can be monitored longitudinally in the face of experimental increases in IOP from 10 mmHg to 100 mmHg to document specific pressure-related changes. These promising results show that OMAG has the potential for visualization and quantitative evaluation of the dynamic changes of RBF in the rodent eye and in rodent-based ocular disease models.
Acknowledgments
This work was supported in part by research grants from the National Heart, Lung, and Blood Institute (R01 HL093140), National Institute of Biomedical Imaging and Bioengineering (R01 EB009682), the National Eye Institute (R01 EY10145 and R01 EY16866) the American Heart Association (0855733G) and unrestricted funds from Research to Prevent Blindness, Inc. The content is solely the responsibility of the authors and does not necessarily represent the official views of grant giving bodies.
References and links
- 1.Pournaras C. J., Rungger-Brändle E., Riva C. E., Hardarson S. H., Stefansson E., “Regulation of retinal blood flow in health and disease,” Prog. Retin. Eye Res. 27(3), 284–330 (2008). 10.1016/j.preteyeres.2008.02.002 [DOI] [PubMed] [Google Scholar]
- 2.Ffytche T. J., Bulpitt C. J., Kohner E. M., Archer D., Dollery C. T., “Effect of changes in intraocular pressure on the retinal microcirculation,” Br. J. Ophthalmol. 58(5), 514–522 (1974). 10.1136/bjo.58.5.514 [DOI] [PMC free article] [PubMed] [Google Scholar]
- 3.Shepherd A. P., Riedel G. L., “Continuous measurement of intestinal mucosal blood flow by laser-Doppler velocimetry,” Am. J. Physiol. 242(6), G668–G672 (1982). [DOI] [PubMed] [Google Scholar]
- 4.Liang Y., Downs J. C., Fortune B., Cull G., Cioffi G. A., Wang L., “Impact of systemic blood pressure on the relationship between intraocular pressure and blood flow in the optic nerve head of nonhuman primates,” Invest. Ophthalmol. Vis. Sci. 50(5), 2154–2160 (2009). 10.1167/iovs.08-2882 [DOI] [PubMed] [Google Scholar]
- 5.Jiao S., Jiang M., Hu J., Fawzi A., Zhou Q., Shung K. K., Puliafito C. A., Zhang H. F., “Photoacoustic ophthalmoscopy for in vivo retinal imaging,” Opt. Express 18(4), 3967–3972 (2010). 10.1364/OE.18.003967 [DOI] [PMC free article] [PubMed] [Google Scholar]
- 6.Chen Z., Milner T. E., Srinivas S., Wang X., Malekafzali A., van Gemert M. J., Nelson J. S., “Noninvasive imaging of in vivo blood flow velocity using optical Doppler tomography,” Opt. Lett. 22(14), 1119–1121 (1997). 10.1364/OL.22.001119 [DOI] [PubMed] [Google Scholar]
- 7.Zhao Y., Chen Z., Ding Z., Ren H., Nelson J. S., “Real-time phase-resolved functional optical coherence tomography by use of optical Hilbert transformation,” Opt. Lett. 27(2), 98–100 (2002). 10.1364/OL.27.000098 [DOI] [PubMed] [Google Scholar]
- 8.Leitgeb R., Schmetterer L., Drexler W., Fercher A., Zawadzki R., Bajraszewski T., “Real-time assessment of retinal blood flow with ultrafast acquisition by color Doppler Fourier domain optical coherence tomography,” Opt. Express 11(23), 3116–3121 (2003). 10.1364/OE.11.003116 [DOI] [PubMed] [Google Scholar]
- 9.Szkulmowska A., Szkulmowski M., Szlag D., Kowalczyk A., Wojtkowski M., “Three-dimensional quantitative imaging of retinal and choroidal blood flow velocity using joint Spectral and Time domain Optical Coherence Tomography,” Opt. Express 17(13), 10584–10598 (2009). 10.1364/OE.17.010584 [DOI] [PubMed] [Google Scholar]
- 10.Makita S., Hong Y., Yamanari M., Yatagai T., Yasuno Y., “Optical coherence angiography,” Opt. Express 14(17), 7821–7840 (2006). 10.1364/OE.14.007821 [DOI] [PubMed] [Google Scholar]
- 11.Vakoc B., Yun S., de Boer J., Tearney G., Bouma B., “Phase-resolved optical frequency domain imaging,” Opt. Express 13(14), 5483–5493 (2005). 10.1364/OPEX.13.005483 [DOI] [PMC free article] [PubMed] [Google Scholar]
- 12.Tao Y. K., Davis A. M., Izatt J. A., “Single-pass volumetric bidirectional blood flow imaging spectral domain optical coherence tomography using a modified Hilbert transform,” Opt. Express 16(16), 12350–12361 (2008). 10.1364/OE.16.012350 [DOI] [PubMed] [Google Scholar]
- 13.Wang Y., Bower B. A., Izatt J. A., Tan O., Huang D., “In vivo total retinal blood flow measurement by Fourier domain Doppler optical coherence tomography,” J. Biomed. Opt. 12(4), 041215 (2007). 10.1117/1.2772871 [DOI] [PubMed] [Google Scholar]
- 14.Wang Y., Bower B. A., Izatt J. A., Tan O., Huang D., “Retinal blood flow measurement by circumpapillary Fourier domain Doppler optical coherence tomography,” J. Biomed. Opt. 13(6), 064003 (2008). 10.1117/1.2998480 [DOI] [PMC free article] [PubMed] [Google Scholar]
- 15.Wang Y., Fawzi A., Tan O., Gil-Flamer J., Huang D., “Retinal blood flow detection in diabetic patients by Doppler Fourier domain optical coherence tomography,” Opt. Express 17(5), 4061–4073 (2009). 10.1364/OE.17.004061 [DOI] [PMC free article] [PubMed] [Google Scholar]
- 16.Wang R. K., Hurst S., “Mapping of cerebro-vascular blood perfusion in mice with skin and skull intact by Optical Micro-AngioGraphy at 1.3 μm wavelength,” Opt. Express 15(18), 11402–11412 (2007). 10.1364/OE.15.011402 [DOI] [PubMed] [Google Scholar]
- 17.An L., Wang R. K., “In vivo volumetric imaging of vascular perfusion within human retina and choroids with optical micro-angiography,” Opt. Express 16(15), 11438–11452 (2008). 10.1364/OE.16.011438 [DOI] [PubMed] [Google Scholar]
- 18.Wang R. K., An L., “Doppler optical micro-angiography for volumetric imaging of vascular perfusion in vivo,” Opt. Express 17(11), 8926–8940 (2009). 10.1364/OE.17.008926 [DOI] [PMC free article] [PubMed] [Google Scholar]
- 19.An L., Qin J., Wang R. K., “Ultrahigh sensitive optical microangiography for in vivo imaging of microcirculations within human skin tissue beds,” Opt. Express 18(8), 8220–8228 (2010). 10.1364/OE.18.008220 [DOI] [PMC free article] [PubMed] [Google Scholar]
- 20.Wang R. K., An L., Francis P., Wilson D. J., “Depth-resolved imaging of capillary networks in retina and choroid using ultrahigh sensitive optical microangiography,” Opt. Lett. 35(9), 1467–1469 (2010). 10.1364/OL.35.001467 [DOI] [PMC free article] [PubMed] [Google Scholar]
- 21.Jia Y., An L., Wang R. K., “Label-free and highly sensitive optical imaging of detailed microcirculation within meninges and cortex in mice with the cranium left intact,” J. Biomed. Opt. 15(3), 030510 (2010). 10.1117/1.3432654 [DOI] [PMC free article] [PubMed] [Google Scholar]
- 22.Jung Y., Zhi Z., Wang R. K., “Three-dimensional optical imaging of microvascular networks within intact lymph node in vivo,” J. Biomed. Opt. 15(5), 050501 (2010). 10.1117/1.3496301 [DOI] [PMC free article] [PubMed] [Google Scholar]
- 23.Morrison J. C., Cepurna Ying Guo W. O., Johnson E. C., “Pathophysiology of human glaucomatous optic nerve damage: Insights from rodent models of glaucoma,” Exp. Eye Res. (2010). 10.1016/j.exer.2010.08.005 [DOI] [PMC free article] [PubMed] [Google Scholar]
- 24.Pang I. H., Clark A. F., “Rodent models for glaucoma retinopathy and optic neuropathy,” J. Glaucoma 16(5), 483–505 (2007). 10.1097/IJG.0b013e3181405d4f [DOI] [PubMed] [Google Scholar]
- 25.Ruggeri M., Wehbe H., Jiao S., Gregori G., Jockovich M. E., Hackam A., Duan Y., Puliafito C. A., “In vivo three-dimensional high-resolution imaging of rodent retina with spectral-domain optical coherence tomography,” Invest. Ophthalmol. Vis. Sci. 48(4), 1808–1814 (2007). 10.1167/iovs.06-0815 [DOI] [PubMed] [Google Scholar]
- 26.Srinivasan V. J., Ko T. H., Wojtkowski M., Carvalho M., Clermont A., Bursell S. E., Song Q. H., Lem J., Duker J. S., Schuman J. S., Fujimoto J. G., “Noninvasive volumetric imaging and morphometry of the rodent retina with high-speed, ultrahigh-resolution optical coherence tomography,” Invest. Ophthalmol. Vis. Sci. 47(12), 5522–5528 (2006). 10.1167/iovs.06-0195 [DOI] [PMC free article] [PubMed] [Google Scholar]
- 27.Wang R. K., Jacques S. L., Ma Z., Hurst S., Hanson S. R., Gruber A., “Three dimensional optical angiography,” Opt. Express 15(7), 4083–4097 (2007). 10.1364/OE.15.004083 [DOI] [PubMed] [Google Scholar]
- 28.Srinivasan V. J., Sakadzić S., Gorczynska I., Ruvinskaya S., Wu W., Fujimoto J. G., Boas D. A., “Quantitative cerebral blood flow with optical coherence tomography,” Opt. Express 18(3), 2477–2494 (2010). 10.1364/OE.18.002477 [DOI] [PMC free article] [PubMed] [Google Scholar]
- 29.Grulkowski I., Gorczynska I., Szkulmowski M., Szlag D., Szkulmowska A., Leitgeb R. A., Kowalczyk A., Wojtkowski M., “Scanning protocols dedicated to smart velocity ranging in spectral OCT,” Opt. Express 17(26), 23736–23754 (2009). 10.1364/OE.17.023736 [DOI] [PubMed] [Google Scholar]
- 30.Piao D., Otis L. L., Zhu Q., “Doppler angle and flow velocity mapping by combined Doppler shift and Doppler bandwidth measurements in optical Doppler tomography,” Opt. Lett. 28(13), 1120–1122 (2003). 10.1364/OL.28.001120 [DOI] [PubMed] [Google Scholar]
- 31.Pedersen C. J., Huang D., Shure M. A., Rollins A. M., “Measurement of absolute flow velocity vector using dual-angle, delay-encoded Doppler optical coherence tomography,” Opt. Lett. 32(5), 506–508 (2007). 10.1364/OL.32.000506 [DOI] [PubMed] [Google Scholar]
- 32.Ma Z., Liu A., Yin X., Troyer A., Thornburg K., Wang R. K., Rugonyi S., “Measurement of absolute blood flow velocity in outflow tract of HH18 chicken embryo based on 4D reconstruction using spectral domain optical coherence tomography,” Biomed. Opt. Express 1(3), 798–811 (2010). 10.1364/BOE.1.000798 [DOI] [PMC free article] [PubMed] [Google Scholar]
- 33.White B., Pierce M., Nassif N., Cense B., Park B., Tearney G., Bouma B., Chen T., de Boer J., “In vivo dynamic human retinal blood flow imaging using ultra-high-speed spectral domain optical coherence tomography,” Opt. Express 11(25), 3490–3497 (2003). 10.1364/OE.11.003490 [DOI] [PubMed] [Google Scholar]
- 34.The AGIS Investigators , “The Advanced Glaucoma Intervention Study (AGIS): 7. The relationship between control of intraocular pressure and visual field deterioration,” Am. J. Ophthalmol. 130(4), 429–440 (2000). 10.1016/S0002-9394(00)00538-9 [DOI] [PubMed] [Google Scholar]
- 35.Sommer A., “Intraocular pressure and glaucoma,” Am. J. Ophthalmol. 107(2), 186–188 (1989). [DOI] [PubMed] [Google Scholar]
- 36.Mozaffarieh M., Grieshaber M. C., Flammer J., “Oxygen and blood flow: players in the pathogenesis of glaucoma,” Mol. Vis. 14, 224–233 (2008). [PMC free article] [PubMed] [Google Scholar]
- 37.Moore D., Harris A., Wudunn D., Kheradiya N., Siesky B., “Dysfunctional regulation of ocular blood flow: A risk factor for glaucoma?” Clinical Ophthalmol. 2(4), 849–861 (2008). [DOI] [PMC free article] [PubMed] [Google Scholar]
- 38.Geijer C., Bill A., “Effects of raised intraocular pressure on retinal, prelaminar, laminar, and retrolaminar optic nerve blood flow in monkeys,” Invest. Ophthalmol. Vis. Sci. 18(10), 1030–1042 (1979). [PubMed] [Google Scholar]


