Abstract
Measurement of early-photons (EPs) from a pulsed laser source has been shown to improve imaging resolution versus continuous wave (CW) systems in diffuse optical tomography (DOT) and fluorescence mediated tomography (FMT). However, EP systems also have reduced noise performance versus CW systems since EP measurements require temporal rejection of large numbers of transmitted photons. In this work, we describe a ‘hybrid data set’ (HDS) image reconstruction approach, the goal of which was to produce a final image that retained the resolution and noise advantages of EP and CW data sets, respectively. Here, CW data was first reconstructed to produce a quantitatively accurate ‘initial guess’ intermediate image, and then this was refined with EP data to yield a higher resolution final image. We performed a series of studies with simulated data to test the resolution, quantitative accuracy and detection sensitivity of the approach. We showed that in principle it was possible to produce final images that retained the bulk of the resolution and quantitative accuracy of EP and CW images, respectively, but the HDS approach did not improve the instrument sensitivity compared to EP data alone.
OCIS codes: (170.6920) Time-resolved imaging, (110.6960) Tomography, (100.3190) Inverse Problems
1. Introduction
In recent years there has been significant progress in the development of diffuse optical tomographic (DOT) and fluorescence mediated tomographic (FMT) imaging systems as well as their clinical and preclinical use [1–8]. In both, three dimensional images of native tissue contrast or fluorescent molecular reporters are reconstructed from trans-illumination measurements through the biological sample. The image reconstruction problem involves relating measurements between source and detector pairs and the unknown quantity of interest in the volume with mathematical models of photon transport in tissue, and then solving the subsequent inverse problem [9]. It is well understood that DOT and FMT suffer from relatively poor imaging resolution which is a result of the high degree of light scatter in biological tissue. Mathematically, this scatter results in a ill-posed image reconstruction problem that yields ‘blurry’ images [10].
To address this limitation, a number of groups have proposed and experimentally validated the concept of measurement of early photons (EPs) transmitted through the media [10–19]. In this approach, a high-speed pulsed laser source is used to illuminate the volume and the earliest transmitted—and therefore least scattered—photons are measured with a time-gated instrument. As such, the breadth of the instrument photon density sensitivity function (PDSF) between a source and detector pair is significantly reduced, resulting in a better conditioned inverse problem. Recently, we showed experimentally that measurement of EPs allowed reduction in photon scatter—characterized by the full width half maximum (FWHM) of the measured PDSF—by up to 60% versus un-gated, quasi-continuous wave (CW) measurements under typical small animal red or near-infrared (NIR) imaging conditions [20]. Time-resolved Monte Carlo simulations similarly showed that transmitted EPs had undergone about 1/3 of the number of total scattering events compared to quasi-CW photons.
On the other hand, since measurement of EPs requires rejection of greater than 99% of all photons transmitted through the media, the noise performance of an EP imaging system is unavoidably reduced versus a comparable CW system. In the same paper, we showed experimentally that EP measurements have significantly reduced signal-to-noise properties—by as much as 15 dB—compared to quasi-CW measurements under typical conditions [20]. In practice, this implies that the improved resolution obtainable by measuring EPs comes at the cost of quantitative accuracy and reduced imaging sensitivity at low fluorophore concentrations.
It is of course technically feasible to measure both EP and CW data types with a single instrument using a number of hardware configurations, either sequentially using a high rate time-gated intensified charge coupled device (ICCD) camera [12,21], or simultaneously using fast detectors (such as photomultiplier tubes; PMTs) and time-correlated single photon counting technology [15,20,22]. Along with the apparent tradeoff between resolution and quantitative accuracy, this has motivated interest in developing DOT and FMT image reconstruction algorithms that allow joint use of both EP and quasi-CW data sets to retain their respective resolution and noise performance advantages.
In general there is significant active interest in the development of time-resolved (TR) DOT and FMT instrumentation. Further, the most effective use of TR data in image reconstruction is an ongoing area of study and debate. A number of authors have previously developed TR image reconstruction strategies, including Kumar et al. [23,24] who utilized time-gated data sets from an ICCD camera to extract the peak of the TR curve as well as fluorescence lifetimes for multiplexed fluorescence tomography. Gao et al. [25] used measured parameters of the full TR curve including the mean time-of-flight, variance and skew to improve tomographic image quality versus CW approaches. Hielscher et al. [26] described a gradient-based iterative reconstruction scheme with multiple time-gates over the full TR curve. The major difference between the strategy we describe here and previous approaches is that we focus on two particular data types (as opposed to the entire TR curve), namely, i) early photons, since they have significantly narrower sensitivity functions and yield correspondingly higher image resolution than any later time gate, and, ii) quasi-CW photons, since they have significantly better noise properties than photons measured at any individual time gate. This entails simplified data handling, forward modeling and as we demonstrate allows retention of most of the respective advantages of both data types.
In this work, we describe and validate this new approach—termed the ‘hybrid data set’ (HDS) image reconstruction strategy—with simulated EP and quasi-CW measurements. Here, quasi-CW data was first tomographically reconstructed to provide a high-quantitative accuracy intermediate image that was then refined with the corresponding EP data set to yield a higher resolution final image. The underlying assumption here is that EP and quasi-CW data sets have distinct noise and resolution properties and therefore must converge to independent solutions. With our HDS image reconstruction approach, we showed that the relative advantages of both EP and quasi-CW data sets could be traded off by altering the amount of computer processing time (i.e. the number of image reconstruction iterations) used with either. For example, with one combination (80% quasi-CW and 20% EP) it was found that on average 74% of the EP resolution accuracy and 80% of the quasi-CW quantitative accuracy could be retained. Further, the noise and resolution characteristics of the images obtained with the HDS approach out-performed those obtained with a single, later time-gate. While it was possible to trade off the resolution and quantitative accuracy, the instrument sensitivity (minimum detectable fluorophore concentration) was not significantly improved with the hybrid scheme compared to EP data sets alone. We anticipate that this approach will have significant future use for TR DOT and FMT imaging systems.
2. Methods and materials
2.1. Tomographic image reconstruction with hybrid data sets
The major innovation of this work is the development and validation of the two-layer, ‘initial guess’ hybrid data set (HDS) image reconstruction approach shown schematically in Fig. 1 . For each fluorescent object under consideration, simulated EP and quasi-CW measurements were first generated using the experimental setup and forward models described in detail in the next sections. In the first layer, an initial image reconstruction was performed with the quasi-CW data and weight functions. This provided a quantitatively accurate but lower-resolution ‘initial guess’ of the final image. This intermediate image was then passed to the second layer which used simulated EP data and weight functions from the same fluorescent object to produce a higher resolution final image while retaining some fraction of the improved quantitative accuracy of the first layer.
Fig. 1.
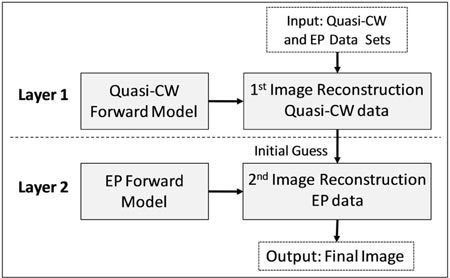
Overview of the hybrid data set image reconstruction approach.
Image reconstructions were performed using the randomized algebraic reconstruction technique (r-ART) since it is a well characterized iterative inversion algorithm for solving systems of equations of the form b = A·x [11,27,28]. As we discuss later in the manuscript, alternate inverse methods could potentially be used in the HDS approach but in all cases herein we have used the same reconstruction parameters so that results were directly comparable between data sets. The amount of computation time for the first and second layer was varied so that the total number of ART iterations used was 100. Specifically, the number of iterations with quasi-CW and EP data sets used was 100CW:0EP, 90CW:10EP, 80CW:20EP, 60CW:40EP, 40CW:60EP, 20CW:80EP and 0CW:100EP. This naming convention for the ‘data mix’ (i.e. the fraction of computation time used with each data set) is used in throughout work. Here, the first and last cases represent ‘pure’ quasi-CW and EP image reconstructions, respectively. In all cases, the regularization parameter was set to λ = 0.01. As illustrated in Fig. 1, the two data sets were handled sequentially; the output of the first (quasi-CW) reconstruction was used as an ‘initial guess’ (xo) of the solution for the second reconstruction. Simulations were performed on a high-end dual core personal computer running the Matlab software package (The Mathworks, Natick, MA). Each two-dimensional image reconstruction required approximately 30s of processing time.
2.2. Simulated Time-Resolved Instrument
Simulated data was generated for the instrument configuration shown in Fig. 2a . A similar instrument configuration has been used previously to experimentally compare small animal fluorescence tomographic images obtained using early and quasi-CW photons [12]. The output of an ultra-short pulsed laser was assumed to illuminate the sample at 45 positions along the front plane of the 1.5 cm wide imaging chamber for each axial slice. The object was further assumed to be rotated at 2.5°increments. In this hardware configuration, the object is scanned in sequential axial slices to obtain a complete 3-dimensional image. Matching intralipid solution ( = 13 cm−1 and = 0.1 cm−1) was also simulated, since this is frequently used experimentally and simplifies modeling of photon propagation. Transmitted light was assumed to be measured with a photomultiplier tube and time-correlated single photon counting electronics at either early time gates or quasi-CW time gates. The measured intensity of light contra-lateral to the source location was simulated using appropriate forward models of light propagation and additive noise (discussed in detail in the next section).
Fig. 2.
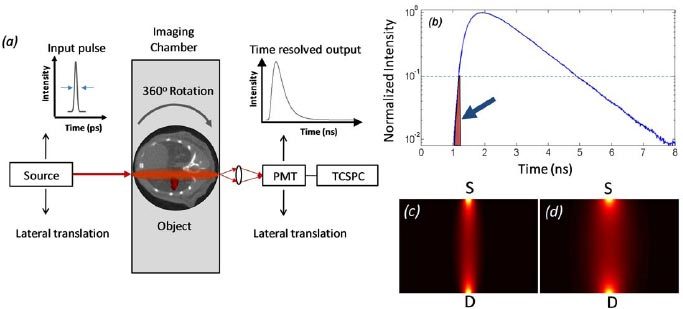
(a) Schematic of the simulated time-resolved fluorescence tomographic instrument used in these studies. (b) An example normalized Alexafluor-680 time-resolved fluorescence curve through diffusive media. The shaded area (arrow) indicates the location of the early-photon time gate, whereas quasi-CW data is equivalent to the area under the full TR curve. Calculated instrument PDSFs are also shown for (c) early and (d) quasi-CW time gates.
2.3. Forward models
Quasi-CW forward models: Generally, forward modeling in fluorescence tomography is performed using some analytical approximation to the Boltzmann Transport Equation (BTE) [29,30]. In the case of quasi-CW photons, the time-independent diffusion approximation of the BTE is frequently used. In this case, the weight function W between a source and detector pair is given by [6]:
| (1) |
where , and are the locations of the source and detector, respectively and r is a position in the diffusive media. The Green’s function G is given by the solution to the steady state diffusion approximation to the BTE:
| (2) |
where Φ is the photon fluence rate, is the diffusion coefficient, is the reduced scattering coefficient and is the absorption coefficient. A number of authors (including us) have shown that this approach yields good agreement with experimentally obtained quasi-CW data using a photon counting experimental approach [20].
Early-photon forward models: Modeling of time-dependant photon propagation at early time gates is more complicated and there is not yet consensus in the field on the most appropriate method. Time-resolved Monte Carlo simulations are very accurate but require relatively long processing times (minutes to hours) for simple geometries even with hardware acceleration [17,21]. Therefore, computationally efficient forward modeling of EPs is frequently performed using an analytical approximation to the BTE [31] such as the time-dependant diffusion approximation (TDDA) [10,16] or the second order cumulant approximation [32]. The use of higher order P-N or simplified P-N analytical models of photon propagation are also being investigated [30]. For EP forward models, the weight function for the excitation light must account for the measurement time gate, so that the total ‘time-of-flight’ of the photon density field matches the detection time t [14]:
| (3) |
where t′ is an integration factor for time. In this work we used the TDDA to model time-dependant photon propagation since it represents a well characterized, computationally efficient method for calculating time-dependent sensitivity functions. The TDDA solution for photon propagation in a diffusive medium from an infinitely short light pulse is [33]:
| (4) |
Further, the time-dependent fluorescence sensitivity function requires temporal convolution of the time-dependent excitation sensitivity function with the exponential fluorescence lifetime of decay (τ) of the fluorophore as follows [17,23]:
| (5) |
where is an integration factor for the fluorescence lifetime.
An important and well known limitation of the TDDA to the BTE is its inaccuracy in predicting photon propagation at early times following a short laser pulse [14,16]. Recently, we showed that the diffusion approximation actually underestimates the experimentally measured reduction in photon scatter at early times using a similar instrument configuration as we model here [20]. Therefore, for modeling EPs we have empirically chosen time gates that yield the correct (i.e. experimentally observed) relative width of the imaging PDSF compared to CW photons [20]. Specifically, we showed that fluorescent photons collected up to the 10% point on the rise portion of the curve yielded a 50% reduction in the PDSF FWHM relative to the quasi-CW case. An example measured full-time fluorescence curve (Alexafluor-680) is shown in Fig. 2b, and the calculated PDSFs for the EP and quasi-CW data types are shown in Figs. 2c and d. To obtain the correct relative width of the PDSF, we used t = 75ps in the calculated weight functions above, but we emphasize that we do not place physical significance in the this time gate except that it yields results that heuristically agree with experimental data. In practice our approach is close to the ‘causality corrected’ TDDA approach suggested by Feld et al. [16], wherein TDDA was used but the detection time gate was shifted by the un-scattered photon transit time through the media.
2.4. Simulated measurements and additive noise
To simulate measurement data, the appropriate weight function was first multiplied by the fluorescence object function for each experimental case. For the quasi-CW measurement, this was given by:
| (6) |
where is the fluorophore concentration at each point in the media. Likewise, for the EP simulated measurements, this was given by:
| (7) |
For these calculations the fluorescence lifetime was assumed to be 1.2 ns (corresponding at Alexafluor-680). Simulated noise was then added to each measurement according to:
| (8) |
where represents the Poisson noise and b is a normally distributed random number. The noise multiplicative factor was taken to be for quasi-CW and for early-photons, since this represents the experimentally observed noise levels relative to Poisson (i.e. photon counting) noise with a time-correlated single photon counting (TCSPC) system. As we have noted previously, measurement noise for early arriving photons is normally distributed but is actually twice as large as would be expected from Poisson (photon counting) noise due to experimental factors such as timing jitter and low frequency timing drift [20]. It should also be noted that since the intensity of the simulated quasi-CW data is significantly higher than the simulated EP data, the Poisson noise (σ) itself was also fractionally smaller in the quasi-CW case.
2.5. In silico studies
To test the relative imaging performance of the HDS image reconstruction approach, we conducted a series of studies with simulated ‘numerical phantoms’ to quantitatively assess the features of reconstructed images. In each case, the phantom was circular (1.5cm in diameter) with one or more fluorescent inclusions placed inside the object. For these studies, homogeneous optical properties were assumed, so that the fluorescence born field was computed (as opposed to the normalized born field [34]). For computations, the axial slice was discretized with a 0.33 mm × 0.33 mm mesh. Numerical phantoms were designed to test the, i) image resolution, ii) quantitative accuracy, and iii) minimum detectable concentration of images obtained with the HDS approach. In all cases, studies were limited to the two dimensional geometries; this allowed efficient computation of a large number of simulated experiments. The details of each study are described as follows.
Image Resolution: The resolution of reconstructed images was first quantified by placing two, 2 mm diameter fluorescent inclusions in the object at varying edge-to-edge separations distances between 0 and 6 mm. In this case the resolution was defined as the smallest separation for which the two inclusions were reconstructed as distinct objects. This was defined either according to the full-width-half maximum reconstructed intensity of each object, or by empirical inspection of the reconstructed images, i.e. when two distinct foci were visible. Simulations used either 10:0 (infinite), 10:1, or 5:1 object-to-background contrast ratios. In experimental practice the measured fluorescence signal is a complicated function of, e.g., the laser power, fluorophore extinction coefficient and quantum yield, optical collection efficiency and detector quantum efficiency. Therefore, the fluorophore concentrations used in our numerical phantoms were in arbitrary units, but were chosen so that, i) these yielded realistic simulated photon count levels, i.e. less than 103 total counts for EPs and less than 105 total counts for quasi-CW data (i.e. the integrated TR curve), and, ii) in the case of imperfect contrast, the contrast ratios were similar to what is experimentally observed in small animals.
Second, instrument resolution was quantified by measuring the imaging point spread function for a small (one-pixel) inclusion placed in either the center or an edge position inside of the object. Image reconstructions were the performed with the HDS approach described above and the number of reconstructed pixels for each inclusion was summed for each case.
Quantitative Accuracy: Following the resolution studies, the quantitative accuracy of each HDS combination was determined by reconstructing numerical phantoms consisting of 3 fluorescent inclusions with either infinite contrast or with background fluorescence. In the former the concentration of the inclusions were increased in a numerical ‘dilution series’ from 0.1:0 to 1:0 object-to-background ratio (specifically 0.1, 0.15, 0.2, 0.25, 0.3, 0.35, 0.4, 0.45, 0.5, and 1:0), and in the latter object-to-background ratios of 1.5:1 to 10:1 were used (specifically 1.5, 2, 2.5, 3, 3.5, 4, 4.5, 5, 7.5, and 10:1). As above, simulated noise was added to these data according to Eq. (8). At lower concentrations, noise became increasingly significant and the reconstructed intensity yielded larger errors. To quantify this effect, each object was reconstructed and the resulting intensity was converted to concentration using a linear fit to the dilution series data. The reconstructed concentrations were then plotted against the true numerical phantom concentrations for each data mix. The mean normalized error in the reconstructed intensity was defined as:
| (9) |
where N was the number of concentrations in the series (N = 10 in both cases), Cr(i) was the mean calibrated reconstructed intensity over the reconstructed area for a given concentration and Ct(i) was the true concentration of the numerical phantom. Division by Ct(i) normalized the error to each concentration value, i.e. so that errors at lower concentrations had equal weight to those at higher concentrations. Simulated data was generated and reconstructions were repeated at least 3 times for each numerical phantom.
Detection sensitivity: Lastly, we investigated the minimum detection sensitivity for the hybrid data set image reconstruction approach. As above, image reconstructions were performed with 3-fluorescent inclusion numerical phantoms with concentrations in the range of 0.1:0 to 1:0. At the lowest concentrations in the dilution series, the simulated noise was comparable to the fluorescence signal so that the reconstructed objects effectively became ‘lost in the noise’. As would be expected, this effect occurred at higher concentrations for EP data than for quasi-CW data, since the relative noise was higher. To quantify this effect, we defined the lower limit of detection sensitivity as the minimum concentration at which an observer could correctly identify the original object from the reconstructed image. As above, fluorophore concentrations were in arbitrary units so that this allowed comparison of the relative sensitivity of each HDS data mix only (as opposed to, for example, quantification of instrument sensitivity in μmol/L of Alexafluor-680). We also note that this methodology is somewhat subjective, and we attempted to minimize this subjectivity by having two viewers who did not know the details of the image reconstruction (i.e. the HDS data mix) identify the minim sensitivity in each case. As we discuss, the potential subjectivity of this approach had minimal impact on the overall conclusions of the study.
3. Results
3.1. Imaging resolution
The resolution of images obtained with the hybrid data set (HDS) imaging approach were first quantified by measuring the minimum edge-to-edge separation between two small inclusions for which two objects could be resolved.
Example simulated objects with 1 mm diameter inclusions with separation distances of 4, 2 and 0 mm for perfect contrast (10:0 object-to-background ratio) is shown in Figs. 3a-c . As anticipated, image reconstructions with the 0CW:100EP mix (i.e. pure EP data; shown in Figs. 3g-i) allowed separation of much smaller edge-to-edge separation distances than the 100CW:0EP data (i.e. pure quasi-CW data; shown in Figs. 3d-f). We then tested our HDS imaging approach and example results for 80CW:20EP (Figs. 3j-l) and 40CW:60EP (Figs. 3m-o) data mixes are shown. It is evident from these data that hybrid use CW and EP data yielded images with resolution between the pure EP and pure CW reconstructions. We note that when the two inclusions were reconstructed together, the reconstructed intensity was approximately twice as high as for the individual inclusions. We also note that reconstructed images that used larger fractions of EP data yielded final images with slightly higher reconstructed intensities; in our analysis we have presented calibrated reconstructed concentrations to remove this effect. This approach was then repeated for the case where background fluorescence was present with a more realistic 5:1 object-to-background contrast as shown in Fig. 4 . This series of experiments yielded qualitatively similar results, although the minimum edge-to-edge separation distance was larger when background was present.
Fig. 3.
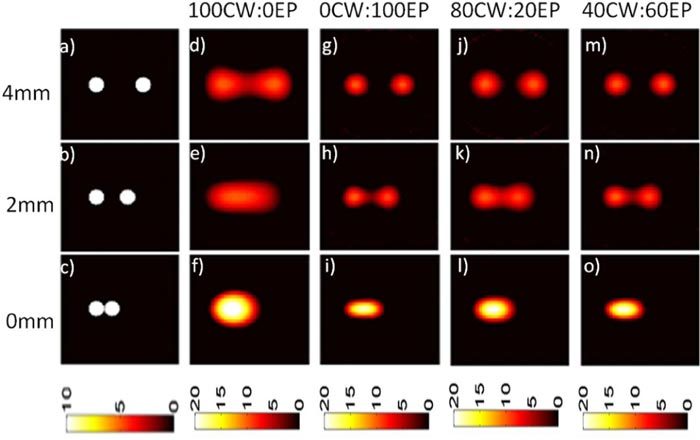
Numerical phantoms with simulated fluorescent inclusions with varying edge-to-edge separations (a-c) were used to test the resolution properties of the HDS approach. Here, the infinite (10:0) object-to-background contrast was assumed. Purely CW data (d-f) yielded worse imaging resolution than purely EP data (g-i). Images produced with the HDS reconstruction approach with 80CW:20EP (j-l) and 40CW:60EP (m-o) data mixes are shown.
Fig. 4.
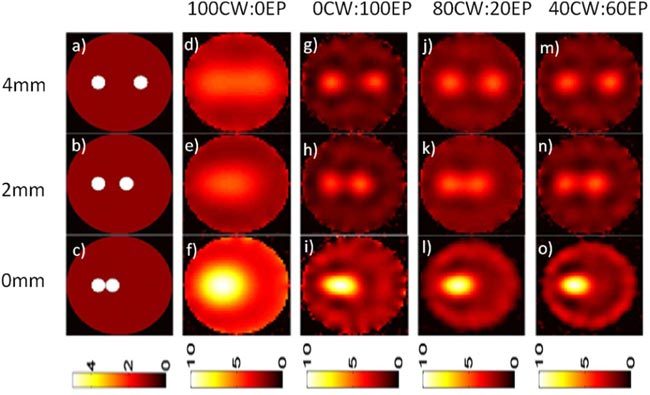
Example numerical phantoms with varying edge-to-edge separations (a-c) and an experimentally realistic object-to-background autofluorescence ratio of 5:1. Purely CW data (d-f) yielded worse imaging resolution than purely EP data (g-i). Images produced with the HDS reconstruction approach with 80CW:20EP (j-l) and 40CW:60EP (m-o) data mixes are shown.
The data from these two studies are summarized in Fig. 5 , which shows the impact of the HDS image reconstruction approach with all data mixes that were tested. Here, the minimum resolvable edge-to-edge separation distance for each data mix and object-to-background contrast is shown, defined by either the full-width half maximum reconstructed intensity (Fig. 5a) or the empirically observed separation for which two foci were visible (Fig. 5b). It is evident from these data that inclusion of more EP data in the image reconstruction—after formation of an initial guess with the CW data—yielded significantly better resolution in the final image. Further, the ‘decay rate’ of this curve is not linear; from inspection of this graph it is evident that the use of a few iterations with EP data significantly improves the resolution of the final image.
Fig. 5.

The minimum edge-to-edge separation distance between fluorescent inclusions for which two distinct objects could be reconstructed for different data mixes, defined by either (a) the full width half maximum intensity separation of both objects or (b) empirical observation of two distinct foci.
Second, we quantified the resolution by considering the imaging point spread function (PSF) obtained with each HDS data mix. A one-pixel-by-one-pixel fluorescent inclusion was placed at either the center or edge (left-offset) positions in the numerical phantom. This object was then reconstructed with each HDS mix of CW and EP data and the size of the reconstructed point object was determined. Image reconstructions were repeated over a range of HDS mixes and the resulting data—normalized to the PSF area obtained with EP data—is presented in Fig. 6 . As anticipated, the use of different CW and EP data mixes had a qualitatively similar effect on the relative imaging PSF size (and therefore resolution) as was observed in Fig. 5. The impact of the improved resolution on the quantitative accuracy of the reconstructed image is discussed in the next section.
Fig. 6.
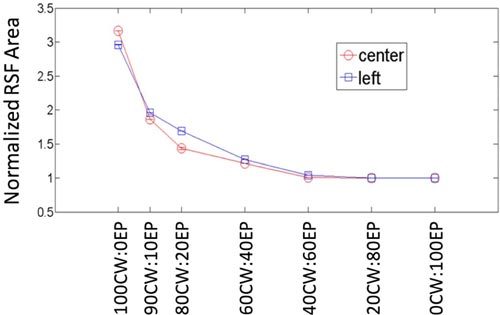
The area of the imaging point spread function for a 1 pixel by 1 pixel object placed at either the center or a left-edge position in the object for different HDS data mixes, normalized to the PSF area obtained for EPs (unitless).
It is also interesting to note that although the width of the EP sensitivity function was narrower than the quasi-CW sensitivity function by a factor of 2 (Figs. 2c-d), the imaging point spread function was actually 3 times smaller. Further investigation showed that this was consistent effect; A 60% (2.5-fold) reduction in the sensitivity function width compared to the quasi-CW case (i.e. using an earlier detection time gate) resulted in approximately 3.8-fold reduction in the imaging PSF (data not shown). In general the improvement in the imaging resolution was a factor of 1.5 greater than the reduction in the PDSF FWHM in the forward problem. The exact reason for this effect is not yet understood, but it is most likely a result of the highly ill-posed nature of the DOT image reconstruction problem [10].
3.2 Quantitative accuracy
We next performed a series of simulations designed to be analogous to an experimental ‘dilution series’ with varying concentrations of fluorophore. Three fluorescent inclusions (two with 1 mm radii and 1 with 0.5 mm radius) were assumed to be placed inside the object in a triangular configuration at the same concentration. Figure 7 shows example data from the study where perfect contrast was assumed; specifically, fluorescent objects with concentrations ranging from 1:0 to 0.1:0 object-to-background contrast ratios are shown. It should be noted that for each HDS data mix, the reconstructed intensities varied linearly with concentration. As above the reconstructed intensities were converted to the fluorescence concentration using a calibrated linear fit to the data before plotting.
Fig. 7.
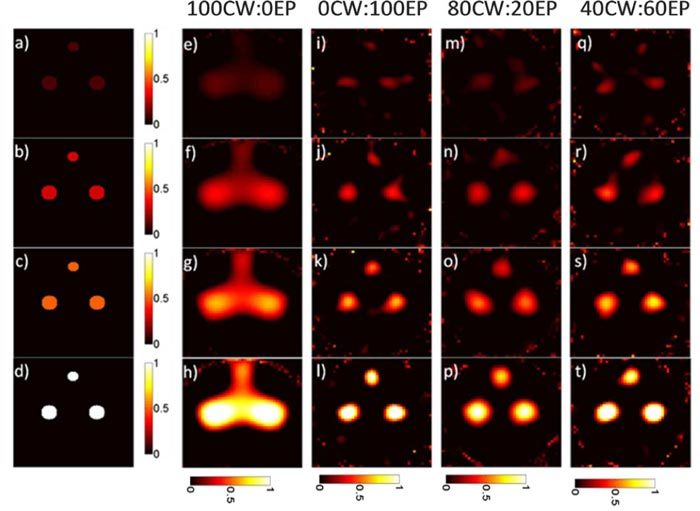
A series of objects with three fluorescent inclusions of varying concentration (a-d) are shown along with the reconstructed images for pure quasi-CW data (e-h) and pure EP data (i-l). Images produced with the HDS reconstruction approach with 80CW:20EP (m-p) and 40CW:60EP (q-t) data mixes are shown.
Qualitatively, images obtained with pure quasi-CW data (Figs. 7e-h) were smoother and less noisy than those obtained with pure EP data (Figs. 7i-l)—particularly at lower concentrations—but it is more difficult to make out the 3 distinct fluorescent inclusions present in the original image. Example image reconstructions obtained from the HDS approaches for 80CW:20EP and 40CW:60EP are also presented in Figs. 7m-t. The effect of the HDS approach is less obvious than in the resolution studies above but as we demonstrate, images that used larger fractions of CW data were more quantitatively accurate. Similar image reconstructions with the HDS approach are shown in Fig. 8 for simulations where background autofluorescence was assumed to be present in object-to-background ratios ranging from 10:1 to 2.5:1. Qualitatively, the results here were similar to Fig. 7, but it is interesting to note that reconstructed background fluorescence was much smoother in cases where higher fractions of quasi-CW data were used. In general, the algorithm yielded a slight overestimation of the background fluorescence levels compared to those of the inclusion.
Fig. 8.
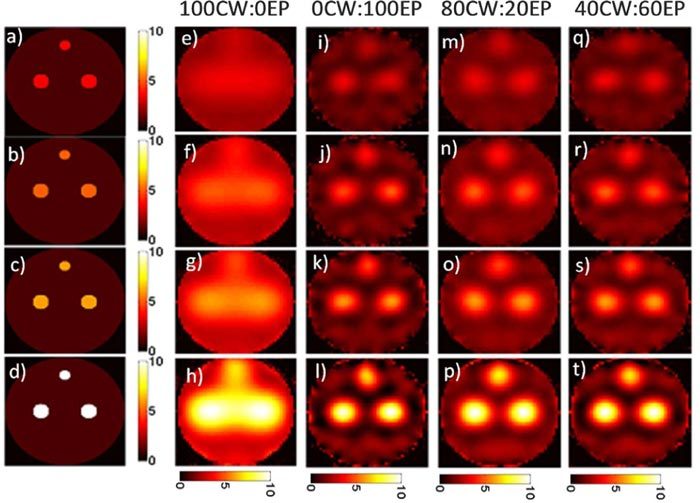
A series of objects with three fluorescent inclusions of varying concentration (a-d) with background autofluorescence are shown along with the reconstructed images for pure quasi-CW data (e-h) and pure EP data (i-l). Images produced with the HDS reconstruction approach with 80CW:20EP (m-p) and 40CW:60EP (q-t) data mixes are shown.
Practically, the greater relative noise levels in EP data propagated to noise (error) in the reconstructed concentrations. To illustrate this, example calibrated reconstructed concentration data for quasi-CW and EP data (perfect contrast) is shown in Figs. 9a and b . When the HDS image reconstruction approach was applied, this error was reduced versus EP data alone (i.e. 0CW:100EP) but was still larger than quasi-CW data (100CW:0EP). We then plotted the mean of the normalized errors in the reconstructed concentrations as defined in Eq. (9). The resulting data for numerical phantoms with perfect and imperfect contrast are shown in Figs. 9c and d, respectively. The quantitative accuracy of images produced with the HDS approach was almost linearly related to the amount of quasi-CW data included in the image reconstruction. In other words, the improved resolution observed in Figs. 5 and 6 obtained when larger fractions of EP data were included came at the cost of overall reduced noise performance of the system. By altering the HDS data mix then, it was possible to trade off of the noise and resolution properties of the system; for example, images produced with the 80CW:20EP data mix retained 74% of the resolution 80% of the quantitative accuracy of the pure EP and quasi-CW data sets, respectively.
Fig. 9.
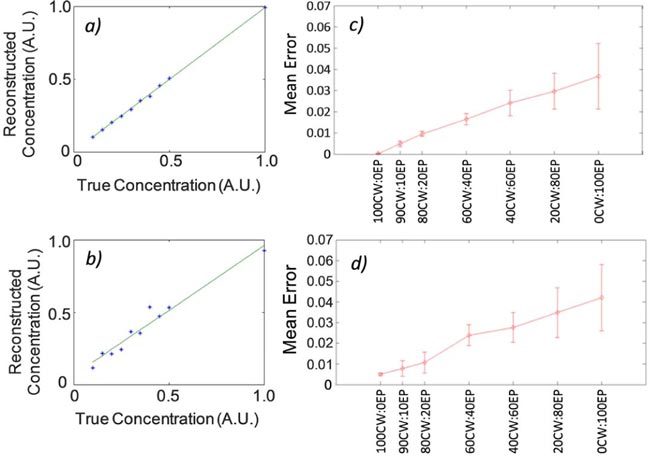
The use of more CW data in the HDS data mix resulted in worse resolution but better quantitative accuracy. Example calibrated reconstructed intensities for a dilution series of experiments (no simulated autofluorescence) for the (a) 100CW:0EP HDS data mix, and (b) 0CW:100EP data mix is shown. The mean normalized error (Eq. (9) in the reconstructed intensity for different HDS reconstruction data mixes is shown for the case (c) without background autofluorescence, and (d) with background autofluorescence.
3.3 Minimum resolvable concentration
Finally, we investigated the lowest fluorescence concentrations for which the target numerical phantom could be identified for each HDS image reconstruction data mix. For this study we inspected the reconstructed images over the range of concentrations defined in section 2.5 (without background fluorescence). At sufficiently low fluorescence concentrations, the original numerical phantom became obscured by the simulated noise (for example in Figs. 7m and 7q). As expected, this effect occurred at lower concentrations for purely quasi-CW data than for purely EP data, since the relative noise was significantly lower in the former. However, the use of the hybrid data set image reconstruction approach did not significantly improve the minimum detectable concentration compared to EP data alone. These data are summarized in Fig. 10 , wherein the lowest concentration for which the original object could be resolved is shown (averaged over 3 trials each). The reason for this is unclear, but it is evident that at low concentrations the poor noise properties of the EP data had significant negative impact on the reconstructed image, even when mixes with low EP iterations were used.
Fig. 10.
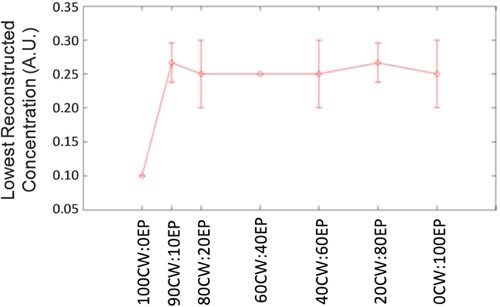
The minimum fluorescence concentration for which an object could be reconstructed for different HDS reconstruction approaches.
As discussed in section 2.3, the concentrations used in the numerical phantoms were in arbitrary units; practically, the experimental minimum detectable concentration will be highly dependent on the extinction coefficient and fluorescence quantum yield of the fluorophore as well as the instrument detection efficiency and noise properties. Therefore, our interpretations of these data is that CW data has significantly better relative sensitivity compared to EP data as well as any HDS data mix that includes some fraction of EP data. We also note that, while our methodology in quantifying the detection sensitivity was somewhat subjective, this potential subjectivity had negligible impact on the conclusions of this work, i.e. since the HDS approach did not improve the sensitivity versus a pure EP approach.
4. Discussion and conclusions
In both DOT and FMT, the quality of the final image is partially dependent on the specific choice of image reconstruction method used. While many choices of inversion algorithms are available, in this work we chose the randomized ART approach with a total of 100 iterations and a regularization parameter λ of 0.01. It is therefore conceivable that ‘better’ or ‘worse’ image reconstructions could be obtained with our simulated data using alternate algorithms or inversion parameters. However, in this work we have selected one approach and used it in all cases so that results could be compared directly between data sets. In principal, our HDS approach could be used with any inversion algorithm that allows use of an ‘initial guess’ of the reconstructed image (i.e. in the second layer in Fig. 1). Likewise, the HDS approach could be used for alternate hardware implementations, for example if the instrument allowed more or less spatial sampling of the transmitted photon fields. Although our studies were performed in two dimensions for computational efficiency, the generalization of our technique and conclusions to three-dimensional geometries is straightforward.
In general, the HDS tomographic imaging approach allowed trading off of the resolution and quantitative accuracy advantages of the early-photon and continuous wave data types. The fraction of computational processing time spent with either data set allowed us to control this tradeoff. Although it is difficult to define an ‘optimal’ operating point with these data, the 80CW:20EP HDS data mix provided an attractive balance since it allowed retention of the bulk of the advantages of both data types, i.e. it yielded an image that retained 74% of the resolution of the EP image and 80% of the quantitative accuracy of the quasi-CW image. Depending on the application, this balance could be adjusted, for example, if resolution or quantitative accuracy was of greater concern. However, adjusting the HDS data mix did not improve the minimum detectable fluorophore concentration versus images produced with EP data alone. We note also that, unsurprisingly, it was not possible with this approach to retain both the full resolution and quantitative accuracy advantages of each data set in the image reconstruction.
We also ruled out the possibility that the initial guess had a minimal or no effect on the final reconstructed image. For example, processing the early photon data set with only 20 ART iterations yielded a distinct final image from the 80CW:20EP image; specifically, the resolution of the former was worse than the HDS approach but had approximately the same noise characteristics as the images produced with early photons and 100 ART iterations. In other words, the use of less than 100 iterations with only EP data reduced the resolution but did not improve the noise properties of the resulting image relative the case where 100 iterations were used.
To some degree an effect similar to the HDS image reconstruction approach—i.e. trading off resolution and noise—can also be obtained with a time-gated imaging system simply by choosing a later measurement time gate, since later time gates yield worse resolution but better signal to noise performance. To investigate this, we compared the imaging performance for measurements that corresponded to 50% and 75% of the peak intensity on the rise portion of the curve with corresponding experimentally determined noise properties [20]. Our data shows that in the case of the 75% rise point, the resolution of the resulting image was comparable to the 90CW:10EP HDS data mix, but had 200% worse quantitative noise performance. Similarly, the 50% rise point yielded an imaging resolution comparable to the 60CW:40EP data mix, but with 133% of the quantitative reconstruction error. Therefore, the joint-data imaging approach allowed better retention of noise and resolution properties of the EP and quasi-CW images than could be obtained by simply choosing a later time gate. Intuitively, this should be the case, since the process of time gating necessarily requires rejection of large numbers of measurable photons, thereby decreasing SNR versus CW measurements. Along the same lines, the HDS image reconstruction approach is also advantageous for imaging systems where complete time-resolved data sets are not acquired—e.g. with time-gated ICCD cameras where each time-gate must be acquired sequentially—since it allows this trade-off without explicitly making measurements at each time gate.
In summary, our simulated studies show that in principle the HDS image reconstruction approach offers a powerful method for trading-off the advantages and disadvantages of EP and quasi-CW data sets for time-resolved tomographic imaging systems. We next plan to test this approach with experimental data obtained from phantoms and mice in vivo. Alternate approaches that make improved use of EP and quasi-CW data sets will also be explored.
Acknowledgments
This work was funded with a grant from the National Institutes of Health (R01EB012117‐01) and from a Northeastern University laboratory startup grant to M. Niedre.
References and links
- 1.Tromberg B. J., Pogue B. W., Paulsen K. D., Yodh A. G., Boas D. A., Cerussi A. E., “Assessing the future of diffuse optical imaging technologies for breast cancer management,” Med. Phys. 35(6), 2443–2451 (2008). 10.1118/1.2919078 [DOI] [PMC free article] [PubMed] [Google Scholar]
- 2.Hielscher A. H., “Optical tomographic imaging of small animals,” Curr. Opin. Biotechnol. 16(1), 79–88 (2005). 10.1016/j.copbio.2005.01.002 [DOI] [PubMed] [Google Scholar]
- 3.Culver J. P., Choe R., Holboke M. J., Zubkov L., Durduran T., Slemp A., Ntziachristos V., Chance B., Yodh A. G., “Three-dimensional diffuse optical tomography in the parallel plane transmission geometry: evaluation of a hybrid frequency domain/continuous wave clinical system for breast imaging,” Med. Phys. 30(2), 235–247 (2003). 10.1118/1.1534109 [DOI] [PubMed] [Google Scholar]
- 4.Franceschini M. A., Joseph D. K., Huppert T. J., Diamond S. G., Boas D. A., “Diffuse optical imaging of the whole head,” J. Biomed. Opt. 11(5), 054007 (2006). 10.1117/1.2363365 [DOI] [PMC free article] [PubMed] [Google Scholar]
- 5.Piao D., Xie H., Zhang W., Krasinski J. S., Zhang G., Dehghani H., Pogue B. W., “Endoscopic, rapid near-infrared optical tomography,” Opt. Lett. 31(19), 2876–2878 (2006). 10.1364/OL.31.002876 [DOI] [PubMed] [Google Scholar]
- 6.Ntziachristos V., Tung C. H., Bremer C., Weissleder R., “Fluorescence molecular tomography resolves protease activity in vivo,” Nat. Med. 8(7), 757–761 (2002). 10.1038/nm729 [DOI] [PubMed] [Google Scholar]
- 7.Godavarty A., Thompson A. B., Roy R., Gurfinkel M., Eppstein M. J., Zhang C., Sevick-Muraca E. M., “Diagnostic imaging of breast cancer using fluorescence-enhanced optical tomography: phantom studies,” J. Biomed. Opt. 9(3), 488–496 (2004). 10.1117/1.1691027 [DOI] [PubMed] [Google Scholar]
- 8.Graves E. E., Ripoll J., Weissleder R., Ntziachristos V., “A submillimeter resolution fluorescence molecular imaging system for small animal imaging,” Med. Phys. 30(5), 901–911 (2003). 10.1118/1.1568977 [DOI] [PubMed] [Google Scholar]
- 9.Hielscher A. H., Bluestone A. Y., Abdoulaev G. S., Klose A. D., Lasker J., Stewart M., Netz U., Beuthan J., “Near-infrared diffuse optical tomography,” Dis. Markers 18(5-6), 313–337 (2002). [DOI] [PMC free article] [PubMed] [Google Scholar]
- 10.Leblond F., Dehghani H., Kepshire D., Pogue B. W., “Early-photon fluorescence tomography: spatial resolution improvements and noise stability considerations,” J. Opt. Soc. Am. A 26(6), 1444–1457 (2009). 10.1364/JOSAA.26.001444 [DOI] [PMC free article] [PubMed] [Google Scholar]
- 11.Turner G. M., Soubret A., Ntziachristos V., “Inversion with early photons,” Med. Phys. 34(4), 1405–1411 (2007). 10.1118/1.2437103 [DOI] [PubMed] [Google Scholar]
- 12.Niedre M. J., Ntziachristos V., “Comparison of fluorescence tomographic imaging in mice with early-arriving and quasi-continuous-wave photons,” Opt. Lett. 35(3), 369–371 (2010). 10.1364/OL.35.000369 [DOI] [PubMed] [Google Scholar]
- 13.Niedre M. J., de Kleine R. H., Aikawa E., Kirsch D. G., Weissleder R., Ntziachristos V., “Early photon tomography allows fluorescence detection of lung carcinomas and disease progression in mice in vivo,” Proc. Natl. Acad. Sci. U.S.A. 105(49), 19126–19131 (2008). 10.1073/pnas.0804798105 [DOI] [PMC free article] [PubMed] [Google Scholar]
- 14.Wu J., Perelman L., Dasari R. R., Feld M. S., “Fluorescence tomographic imaging in turbid media using early-arriving photons and Laplace transforms,” Proc. Natl. Acad. Sci. U.S.A. 94(16), 8783–8788 (1997). 10.1073/pnas.94.16.8783 [DOI] [PMC free article] [PubMed] [Google Scholar]
- 15.Kepshire D., Mincu N., Hutchins M., Gruber J., Dehghani H., Hypnarowski J., Leblond F., Khayat M., Pogue B. W., “A microcomputed tomography guided fluorescence tomography system for small animal molecular imaging,” Rev. Sci. Instrum. 80(4), 043701 (2009). 10.1063/1.3109903 [DOI] [PMC free article] [PubMed] [Google Scholar]
- 16.Chen K., Perelman L. T., Zhang Q., Dasari R. R., Feld M. S., “Optical computed tomography in a turbid medium using early arriving photons,” J. Biomed. Opt. 5(2), 144–154 (2000). 10.1117/1.429981 [DOI] [PubMed] [Google Scholar]
- 17.Kumar A. T., Raymond S. B., Dunn A. K., Bacskai B. J., Boas D. A., “A time domain fluorescence tomography system for small animal imaging,” IEEE Trans. Med. Imaging 27(8), 1152–1163 (2008). 10.1109/TMI.2008.918341 [DOI] [PMC free article] [PubMed] [Google Scholar]
- 18.Soloviev V. Y., D’Andrea C., Valentini G., Cubeddu R., Arridge S. R., “Combined reconstruction of fluorescent and optical parameters using time-resolved data,” Appl. Opt. 48(1), 28–36 (2009). 10.1364/AO.48.000028 [DOI] [PubMed] [Google Scholar]
- 19.Bassi A., Brida D., D’Andrea C., Valentini G., Cubeddu R., De Silvestri S., Cerullo G., “Time-gated optical projection tomography,” Opt. Lett. 35(16), 2732–2734 (2010). 10.1364/OL.35.002732 [DOI] [PubMed] [Google Scholar]
- 20.Valim N., Brock J. L., Niedre M. J., “Experimental measurement of time-dependent photon scatter for diffuse optical tomography,” J. Biomed. Opt. 15(6), 065006 (2010). 10.1117/1.3523371 [DOI] [PMC free article] [PubMed] [Google Scholar]
- 21.Chen J., Intes X., “Time-gated perturbation Monte Carlo for whole body functional imaging in small animals,” Opt. Express 17(22), 19566–19579 (2009). 10.1364/OE.17.019566 [DOI] [PMC free article] [PubMed] [Google Scholar]
- 22.Hillman E. M., Hebden J. C., Schweiger M., Dehghani H., Schmidt F. E., Delpy D. T., Arridge S. R., “Time resolved optical tomography of the human forearm,” Phys. Med. Biol. 46(4), 1117–1130 (2001). 10.1088/0031-9155/46/4/315 [DOI] [PubMed] [Google Scholar]
- 23.Kumar A. T., Raymond S. B., Bacskai B. J., Boas D. A., “Comparison of frequency-domain and time-domain fluorescence lifetime tomography,” Opt. Lett. 33(5), 470–472 (2008). 10.1364/OL.33.000470 [DOI] [PMC free article] [PubMed] [Google Scholar]
- 24.Kumar A. T., Skoch J., Bacskai B. J., Boas D. A., Dunn A. K., “Fluorescence-lifetime-based tomography for turbid media,” Opt. Lett. 30(24), 3347–3349 (2005). 10.1364/OL.30.003347 [DOI] [PubMed] [Google Scholar]
- 25.Gao F., Zhao H., Yamada Y., “Improvement of image quality in diffuse optical tomography by use of full time-resolved data,” Appl. Opt. 41(4), 778–791 (2002). 10.1364/AO.41.000778 [DOI] [PubMed] [Google Scholar]
- 26.Hielscher A. H., Klose A. D., Hanson K. M., “Gradient-based iterative image reconstruction scheme for time-resolved optical tomography,” IEEE Trans. Med. Imaging 18(3), 262–271 (1999). 10.1109/42.764902 [DOI] [PubMed] [Google Scholar]
- 27.Intes X., Ntziachristos V., Culver J. P., Yodh A., Chance B., “Projection access order in algebraic reconstruction technique for diffuse optical tomography,” Phys. Med. Biol. 47(1), N1 (2002). 10.1088/0031-9155/47/1/401 [DOI] [PubMed] [Google Scholar]
- 28.Gaudette R. J., Brooks D. H., DiMarzio C. A., Kilmer M. E., Miller E. L., Gaudette T., Boas D. A., “A comparison study of linear reconstruction techniques for diffuse optical tomographic imaging of absorption coefficient,” Phys. Med. Biol. 45(4), 1051–1070 (2000). 10.1088/0031-9155/45/4/318 [DOI] [PubMed] [Google Scholar]
- 29.Jacques S. L., Pogue B. W., “Tutorial on diffuse light transport,” J. Biomed. Opt. 13(4), 041302 (2008). 10.1117/1.2967535 [DOI] [PubMed] [Google Scholar]
- 30.Chu M., Vishwanath K., Klose A. D., Dehghani H., “Light transport in biological tissue using three-dimensional frequency-domain simplified spherical harmonics equations,” Phys. Med. Biol. 54(8), 2493–2509 (2009). 10.1088/0031-9155/54/8/016 [DOI] [PubMed] [Google Scholar]
- 31.Bouza Domínguez J., Bérubé-Lauzière Y., “Diffuse light propagation in biological media by a time-domain parabolic simplified spherical harmonics approximation with ray-divergence effects,” Appl. Opt. 49(8), 1414–1429 (2010). 10.1364/AO.49.001414 [DOI] [PubMed] [Google Scholar]
- 32.Cai W., Lax M., Alfano R. R., “Analytical solution of the polarized photon transport equation in an infinite uniform medium using cumulant expansion,” Phys. Rev. E Stat. Nonlin. Soft Matter Phys. 63(1 Pt 2), 016606 (2001). [DOI] [PubMed] [Google Scholar]
- 33.Kienle A., Patterson M. S., “Improved solutions of the steady-state and the time-resolved diffusion equations for reflectance from a semi-infinite turbid medium,” J. Opt. Soc. Am. A 14(1), 246–254 (1997). 10.1364/JOSAA.14.000246 [DOI] [PubMed] [Google Scholar]
- 34.Soubret A., Ripoll J., Ntziachristos V., “Accuracy of fluorescent tomography in the presence of heterogeneities: study of the normalized Born ratio,” IEEE Trans. Med. Imaging 24(10), 1377–1386 (2005). 10.1109/TMI.2005.857213 [DOI] [PubMed] [Google Scholar]


